
 Open Access Article
 This Open Access Article is licensed under a Creative Commons Attribution-Non Commercial 3.0 Unported Licence
Screening of cytochrome P450 3A4 inhibitors via in silico and in vitro approaches
Xiaocong Pang†
 a,
Baoyue Zhang†a,
Guangyan Mua,
Jie Xiab,
Qian Xianga,
Xia Zhaoa,
Ailin Liu*b,
Guanhua Du*b and
Yimin Cui*a
a,
Baoyue Zhang†a,
Guangyan Mua,
Jie Xiab,
Qian Xianga,
Xia Zhaoa,
Ailin Liu*b,
Guanhua Du*b and
Yimin Cui*a
aDepartment of Pharmacy, Peking University First Hospital, Dahongluochang Street, Xicheng District, Beijing, 100034, China. E-mail: cui.pharm@pkufh.com; Fax: +86-10-6611-0802; Tel: +86-10-6611-0802
bInstitute of Materia Medica, Chinese Academy of Medical Sciences, Peking Union Medical College, Xian Nong Tan Street, Beijing 100050, China. E-mail: liuailin@imm.ac.cn; dugh@imm.ac.cn; Fax: +86-10-6316-5184; Tel: +86-10-8315-0885
First published on 10th October 2018
Abstract
Cytochrome P450 3A4 (CYP3A4) is an important member of the CYP family and responsible for metabolizing a broad range of drugs. Potential drug–drug interactions (DDIs) caused by CYP3A4 inhibitors could lead to increasing risk of side-effects/toxicity or decreasing effectiveness. The evaluation of CYP3A4 inhibitory activity is time-consuming, labor-intensive, and costly, and it is necessary to establish virtual screening models for predicting CYP3A4 inhibitors. In this study, 4 classifier algorithms, including support vector machine (SVM), naive Bayesian (NB), recursive partitioning (RP), and K-nearest neighbor (KNN), were applied to discriminate CYP3A4 inhibitors from the non-inhibitors. Correlation analysis and stepwise linear regression methods were used for descriptor selection and optimization. The performance of classifiers was measured by 5-fold cross-validation, Y-scrambling and test set validation. Finally, the optimal NB model with Matthews correlation coefficients of 0.894 for the test set was developed to screen FDA-approved drugs and natural products database. As a result, 90 compounds from FDA-approved drug databases were predicted as inhibitors, and 46% of them were identified as known CYP3A4 inhibitors. 6 natural products were selected for further bioactivity assay and molecular docking. 2 of them with good docking score also exerted significant CYP3A4 inhibitory activities with IC50 values of 0.052 and 1.120 μM, respectively. This study proved the feasibility of a new method for predicting CYP3A4 inhibitory activity and preventing the occurrence of DDIs at early stage in drug development.
1. Introduction
The evaluation of drug–drug interactions (DDI) is one of the important problems during drug research and development.1 Since most drugs are metabolized by Cytochrome P450 (CYP450), CYP450-mediated interactions between drugs are the major cause of metabolic DDIs. CYP3A4 is an important subfamily of CYP450, mainly distributed in hepatocytes, liver bile duct epithelial cells and jejunum columnar epithelial cells. It is the most abundant hepatic microsomal enzyme in the liver, and is involved in about 50% of drug metabolism.2,3 Some drugs which can inhibit the activity of CYP3A4 may lead to serious problems in clinical practice.1,4 Therefore, CYP3A4 plays an important role in assessing DDIs and avoiding adverse reactions. The early screening of CYP450 inhibitors has important theoretical and practical value for the development of innovative drugs.Because the CYP3A4 inhibitory activity evaluation process is time-consuming, labor-intensive and costly, it cannot achieve large-scale screening. Therefore, it is very necessary to establish a screening model for predicting CYP3A4 inhibitors.5 Several crystal structures of CYP3A4 and inhibitors have been identified.6–8 Unlike other CYP enzymes, CYP3A4 interacts with ligands in a complex manner. It has been found that there are two “ligand binding” subunits and one “effect binding” region in the active site of CYP3A4.9 Therefore, there may be two or more ligands that can bind to and interact with the active sites of CYP3A4 at the same time.10 The unique features of CYP3A4 make it more difficult to accurately predict CYP3A4-mediated DDI only using molecular docking.
The quantitative structure–activity relationship (QSAR) model uses various statistical methods to establish the correlation between the chemical structure or properties of a compound and its biological activity. Among these methods, partial least square (PLS) is the main method to deal with linear data analysis in QSAR. However, sometimes the relationship between the physical and chemical properties of a compound and its biological activity may be too complex to be described by a linear function. In order to solve such problems, some nonlinear methods are applied to QSAR research. In recent years, neural network methods including radial basis function neural networks, backpropagation neural networks and Kohonen self-organizing feature map have attracted more attention.11,12 However, neural network methods have unavoidable shortcomings, such as overfitting problems and high uncertainty in the model.
Compared with traditional neural networks, Support Vector Machine (SVM) has the advantages of good stability, simple geometric interpretation, kernel functions and slack variables for nonlinear decision making.13,14 Machine learning method has the characteristics of high efficiency and high accuracy in computer-aided drug design application. In recent years, SVM has been successfully applied to CYP450 enzyme studies, including the identification of substrates from non-substrates and the identification of inhibitors from non-inhibitors of CYP3A4,15–17 as well as substrate classification of other CYP450 enzymes such as 2D6 or 2C9.18–20 Kriegl et al. used the SVM method to distinguish inhibitors and drug-like molecules and to predict the inhibitory activity of the compounds. Their work shows that the SVM method can be a powerful tool for filtering compounds, predicting potential inhibitory effects on CYP3A4, and roughly estimating their inhibitory capacity. However, the prediction models developed by them include too many descriptors, and the model prediction accuracy is relatively low. In addition to SVM and neural network algorithms, common classification algorithms for machine learning include naive Bayesian (NB),21,22 recursive partitioning (RP),23,24 and K-nearest neighbor method (KNN),25,26 which are rarely reported in the application of CYP3A4 inhibitor prediction model. Therefore, in order to improve the reliability of the model and reduce the overfitting of the model, we should optimize the descriptors and use a variety of machine learning models for analysis and comparison to enhance the prediction accuracy.
In this study, we constructed virtual screening models of CYP3A4 inhibitors using a variety of machine learning methods. Firstly, we collected a large number of CYP3A4 inhibitors and non-inhibitors, which were divided into training set and test set. The descriptors were calculated for each compound and further were optimized through correlation analysis and stepwise linear regression methods. The models were constructed by SVM, NB, RP, and KNN approaches and estimated by cross-validation, Y-scrambling and test set validation methods. Next, the best prediction model was finally selected for the virtual screening of FDA-approved drug database and natural product database. Finally, the prediction results were validated in vitro CYP3A4 inhibition assay and molecular docking was used to analyze the binding modes for the compounds with high activities. The workflow of virtually screening CYP3A4 inhibitors is shown in Fig. 1.
 | ||
| Fig. 1 Workflow for classification models building, validation, and virtual screening as applied to CYP3A4 inhibitors and non-inhibitors data sets. | ||
2. Materials and methods
2.1 Data assembly and preparation
The CYP3A4 inhibitors with the values of IC50 less than 10 μM were downloaded from the BindingDB database.27 After eliminating the duplicate structures, we obtained 2803 CYP3A4 inhibitors. The decoy dataset including 1404 compounds was generated from “mubd-decoymaker” protocol. Mubd-decoymaker was originally developed for building unbiased benchmarking sets for ligand-based virtual screening (LBVS).28We also collected 1306 CYP3A4 non-inhibitors from BindingDB and ChEMBL29 database. Totally, 2830 CYP3A4 inhibitors and 2710 non-inhibitors/decoys were divided into training set and test set randomly. The training set included 2102 CYP3A4 inhibitors and 2033 non-inhibitors. There were 701 CYP3A4 inhibitors and 677 decoys in test set. Then, inorganic salt atoms of compounds were deleted, and subsequently the compounds were added hydrogen atoms, deprotonated strong acids, protonated strong bases, built valid three-dimensional conformation, and minimized of energy by Molecular Operating Environment (MOE) 2010.10 (Chemical Computing Group Inc.: Montreal, Quebec, Canada). All CYP3A4 inhibitors and decoys were marked with “1” and “0”, respectively.
2.2 Molecular descriptor calculation and selection
In our study, Discovery Studio (DS) 2016 package (Accelrys Inc.: San Diego, CA) was used to compute molecular descriptor. There were 256 2D descriptors calculated by the DS 2016 including the fat distribution coefficients A![[thin space (1/6-em)]](https://www.rsc.org/images/entities/char_2009.gif) logP, states keys, and molecular property descriptors, number of molecular properties, surface area and volume, and topology descriptors. Extended-connectivity fingerprint (ECFP) was also calculated with this software. Taking into account that molecular structure fragments should not be too large and not too small, we used a molecular fingerprint descriptor with a diameter of 6.
logP, states keys, and molecular property descriptors, number of molecular properties, surface area and volume, and topology descriptors. Extended-connectivity fingerprint (ECFP) was also calculated with this software. Taking into account that molecular structure fragments should not be too large and not too small, we used a molecular fingerprint descriptor with a diameter of 6.
Pearson correlation analysis30 can be used to eliminate low-correlation and high-auto-correlation descriptors by calculating the correlation coefficient between activity and descriptors. The descriptor whose correlation coefficient with the activity value was lower than 0.1 was deleted, and if the coefficient between the two descriptors was greater than 0.9, then descriptor with a lower correlation coefficient would also be excluded, and descriptors with a higher correlation coefficient would be retained; the last remaining descriptors were further optimized using a stepwise regression method, which considering the size of the variable, significance, or contribution. The initial regression equation was created by the first descriptor. Then, other descriptors were imported to the equation one by one. At the same time, every new regression equation would be subjected to a significance test for evaluating the addition of a new descriptor. For example, the new descriptor would be removed, if the regression equation was not “statistically significant.” In addition, the descriptors were also deleted when they did not conform to “statistically significant” in the equation. The process would be completed if there were no descriptors imported or deleted.31 Finally, we selected 20 molecular descriptors, including AlogP, ES_Count_aasC, ES_Count_dS, ES_Count_sOH, ES_Count_ssNH2, ES_Count_ ssS, ES_Count_sssN, ES_Count_sssNH, ES_Sum_aaN, ES_Sum_aaS, ES_Sum_aasC, ES_Sum_dNH, ES_Sum_dO, ES_Sum_sCl, ES_Sum_sF, Num_AromaticRings, CHI_V_3_C, Kappa_2_AM, SC_3_CH and Wiener.
2.3 Machine learning algorithm
Based on the molecular descriptors, we utilized naive Bayesian (NB), recursive partitioning (RP), K-nearest neighbor (KNN) and support vector machine (SVM) classification algorithms to construct CYP3A4 inhibitor and non-inhibitor classification models. NB and RP were performed using DS 2016, and KNN and SVM were performed in Orange Canvas 3.13.2.4 Model performance
The models built by SVM, NB, RP, and KNN methods were estimated by 5-fold cross-validation, Y-scrambling and test set validation. The predictive power of the models can be measured by some parameters, including true positives (TP), true negatives (TN), false positives (FP), false negatives (FN), sensitivity (SE), specificity (SP), prediction accuracy of inhibitors (Q+), prediction accuracy of inhibitors (Q−), matthews correlation coefficient (MCC).31 The higher the MCC value means the better the predictive power. The MCC value is between −1 and 1. The meanings and calculation formulas of each parameter are as follows:


2.5 Molecular docking
Molecular docking conducted by CDOCKER protocol of DS 2016 was investigated to further study the binding mode of CYP3A4 with natural products predicted by NB classifiers. The crystal structure of CYP3A4 was downloaded from the Protein Data Bank (PDB ID: 4NY4). The structure of CYP3A4 firstly was prepared through removing water, adding hydrogen, and we also utilized clean protein module to address some problems, such as nonstandard naming, protein residue connectivity, missing side-chain or backbone atoms, and so on. The natural products were also prepared by adding hydrogen, conversing into 3D structures, pH based ionization and charge neutralization. The original ligand was used to define the active pocket of CYP3A4. Then, re-docking was performed to calculate the root-mean-square deviation (RMSD) values between the docking and initial poses, which proved that the reliability of the docking model.2.6 CYP3A4 inhibition assay
CYP3A4-Glo™ Screening System (V9920) (Promega Corporation, Madison, WI, USA) provides a complete set of reagents for performing luminescent cytochrome CYP3A4 assay. The system included a membrane preparation containing recombinant human CYP3A4 enzyme, negative control membranes, Luciferin-IPA (the most sensitive and selective substrate for all CYP3A4 applications), NADPH regeneration system (1.3 mM NADP+, 3.3 mM glucose 6-phosphate, 3.3 mM MgCl2, and 0.4 U mL−1 glucose-6-phosphate dehydrogenase), reaction buffer, luciferin detection reagent and luciferin-free water. The membranes were prepared from baculovirus-infected insect cells and contain human CYP3A4 enzyme and P450 reductase (and cytochrome b5 for 3A4). The negative control membranes were devoid of CYP activity. The assays were ideal for testing the effects of chemical entities on CYP3A4 enzyme activities. Luciferin detection reagent was prepared for luciferin-IPA reactions with reconstitution buffer with esterase. Test compounds and control inhibitor ketoconazole were added to the corresponding wells and luciferin-free water or vehicle was added to untreated and minus-P450 control wells. Reactions were performed in opaque white 96-well plates that were incubated in 37 °C for 30 min. The reaction was initiated by adding 25 μL NADPH regeneration system. Reactions were stopped, and luminescence was initiated by adding 50 μL of Fluorescein Assay Reagent. After 20 min at room temperature, luminescence was read as relative light units (RLU) on Spectra Max M5 (Molecular Devices, Sunnyvale, CA, USA) was applied to read the luminescence.3. Results and discussion
3.1 Chemical space analysis
The prediction performance of classification model constructed by machine learning largely depends on the chemical space diversity of molecules in training set and test set. Generally, due to the narrow chemical space covered by small samples, classification model leads to lots of limitations in the application of these models. In our study, we investigated the chemical space distribution characteristics by calculating the two common physicochemical properties of training set and test set, molecular weight (MW), and lipid-water partition coefficient (AlogP), respectively. The results are shown in Fig. 2. MW values of training set and test set ranged from 30 to 1500 and their AlogP values ranged from −15 to 15. Therefore, it suggested that chemical space distributions were dispersive for all compounds, and most of the compounds in test set were well within the chemical space of training set.
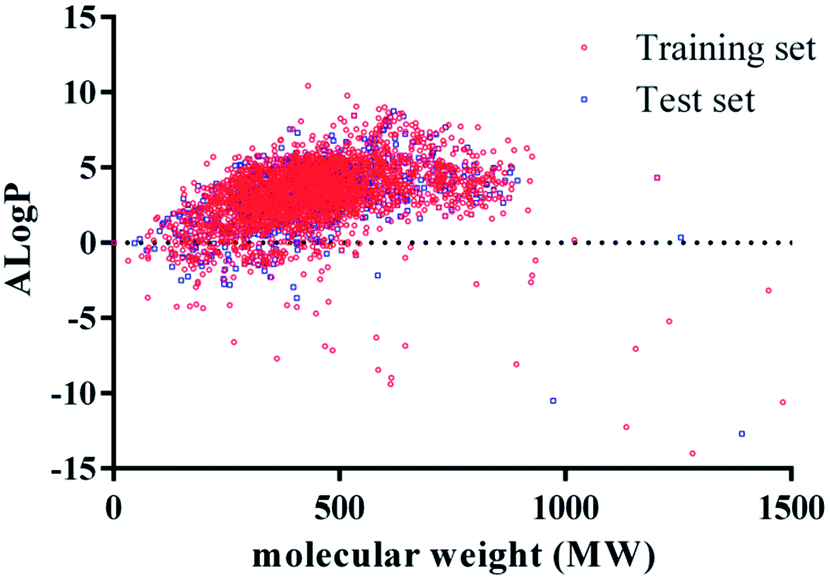 | ||
| Fig. 2 Diversity distribution of the training set and test set. Chemical space was defined by molecular weight (MW) as X-axis, and AlogP as Y-axis. In the picture, red stands for training set compounds, and blue stands for the test set compounds. | ||
3.2 Performance of machine learning models
In this study, we used molecular descriptors calculated by DS 2016 software, and SVM, KNN, RP and NB classification algorithms to construct CYP3A4 inhibitor and non-inhibitor classification models. The performances of the four models were firstly estimated by 5-fold cross validation. In cross validation, the training set was split into 5 groups. Each group was left out in turn; a model was built with the remaining data, and the model was used to make predictions for the left-out data. Then, the models were applied to predict the test set containing 1378 compounds (701 inhibitors versus 677 inactive compounds). From the results of 5-fold cross validation (Table 1), we found that sensitivity, specificity, predictive accuracy and MCC of SVM and KNN methods were better than NB and RP models. However, when the models were validated by test set, the prediction accuracy of SVM and KNN inhibitors was very low, 0.006 and 0.004, respectively, indicating that their ability to predict true positives was poor, which was unfavorable for prediction of CYP3A4 inhibitors. Thus, the performance of NB and RP models was better in test set validation, but the prediction accuracy of NB model inhibitors is also not satisfactory, only 0.211, which suggested that 2D descriptors could describe the basic properties of molecules, but they cannot extract the important substructure fragments or dominant molecular fragment features of CYP3A4 inhibitors.| Validation method | Model | SE | SP | Q+ | Q− | MCC |
|---|---|---|---|---|---|---|
| a SE: Sensitivity, SP: specificity, Q+: prediction accuracy of inhibitors, Q−: prediction accuracy of inhibitors, MCC: matthews correlation coefficient. SVM: support vector machine, NB: naive Bayesian, RP: recursive partitioning, KNN: K-nearest neighbor. | ||||||
| Training set 5-fold cross-validation | SVM | 0.987 | 0.986 | 0.951 | 0.986 | 0.967 |
| KNN | 0.993 | 0.993 | 0.986 | 0.993 | 0.998 | |
| RP | 0.874 | 0.875 | 0.919 | 0.875 | 0.899 | |
| NB | 0.813 | 0.793 | 0.770 | 0.793 | 0.869 | |
| Test validation | SVM | 1.000 | 1.000 | 0.006 | 1.000 | 0.502 |
| KNN | 1.000 | 1.000 | 0.004 | 1.000 | 0.502 | |
| RP | 0.796 | 0.801 | 0.844 | 0.801 | 0.886 | |
| NB | 0.852 | 0.809 | 0.211 | 0.809 | 0.842 | |
Therefore, on the basis of the original DS_2D descriptor, we introduced ECFP-6 for rebuilding the prediction models using NB and RP classification algorithms. The results of the modeling were shown in Table 2. After the addition of the molecular fingerprint descriptors, the prediction capabilities of NB and RP models were significantly improved. The accuracy of test set's inhibitors and MCC values were higher than those of originally built models based on DS_2D descriptors. In particular, prediction accuracy of NB model introduced ECFP-6 improved significantly (from 0.211 to 0.954). MCC values of training set and test set were 0.946 and 0.894, respectively, which were superior to those of RP model. In order to eliminate the contingency of the model's forecasting ability, we also utilized the Y-scrambling method to validate the NB model. After disturbing 30 times, the average MCC value was 0.503, indicating that the accidentality of NB's prediction ability was very low. Therefore, we used the NB model with DS 2D descriptor and ECFP-6 for further study.
| Validation method | Model with DS 2D descriptor + ECFP-6 | SE | SP | Q+ | Q− | MCC |
|---|---|---|---|---|---|---|
| Training set 5-fold cross-validation | NB | 0.948 | 0.946 | 0.960 | 0.955 | 0.946 |
| RP | 0.875 | 0.877 | 0.907 | 0.916 | 0.877 | |
| Test validation | NB | 0.902 | 0.894 | 0.954 | 0.886 | 0.894 |
| RP | 0.827 | 0.832 | 0.917 | 0.880 | 0.832 |
3.3 Good and bad fragments given by naive Bayesian classifier
The advantage of Bayesian classification method based on molecular fingerprint descriptors such as ECFP_6 is that it can identify dominant structural fragments for different taxonomic attributes (CYP3A4 inhibitors or non-inhibitors), which is particularly important for identification of CYP3A4 inhibitors. In Fig. 3, Bayesian scoring based on the NB model summarized the dominant fragments of 10 CYP3A4 inhibitors and 10 non-inhibitor dominant fragments. By analyzing the dominant fragments of CYP3A4 inhibitors, it was not difficult to find that most of non-inhibitor fragments contained positively charged nitrogen atom. These compounds were not conducive to inhibiting CYP3A4 enzyme activity. Most of inhibitor fragments contained saturated nitrogen heterocyclic ring, and the nitrogen atom was not protonated. For example, fluconazole(2-(2,4-difluorophenyl)-1,3-di(1H-1,2,4-triazol-1-yl)propan-2-ol) is an antifungal agent that is used to treat oropharyngeal candidiasis and cryptococcal meningitis in AIDS and is also a typical CYP3A4 inhibitor. Fluconazole contains 6 saturated nitrogen atoms. In addition, the dominant fragment also included phenolic hydroxyl groups, which contributes to inhibiting CYP3A4 enzyme activity. It was also reported that phenolic hydroxyl groups probably play an important role in the CYP3A4 inhibition for some natural products.36 | ||
| Fig. 3 Examples of the top 10 good (top) and bad (bottom) fragments estimated by NB model. The Bayesian score (score) is given for each fragment. | ||
3.4 Virtual screening of CYP3A4 inhibitors
Based on NB model with DS 2D descriptor and ECFP-6, we screened in-house natural product database (including 13144 compounds) and FDA-approved drug database (including 1046 drugs). Firstly, we excluded drug and natural products in the training set, and then separately calculated DS 2D descriptor and ECFP_6 for each compound. Next, NB model was applied to predict the probability of each compound as CYP3A4 inhibitor. According to classification of NB model, 90 drugs were predicted to be CYP3A4 inhibitors. As the result of Fig. 4, drugs predicted as CYP3A4 inhibitors mainly involved anticancer drugs, neuro/psychotic drugs, antifungal drugs, antiviral drugs, diabetes/obesity-related drugs, dermatological drugs, antihypertensive drugs, lipid regulating drugs, hormone agents and immunomodulators. According to investigation on Drugbank database,37 46% of the predicted 90 drugs had been reported to have CYP3A4 inhibitory activity, while 23% were substrates, 27% had not been reported for inhibitory activity, and 4% were inducers. It suggested that established NB prediction model could predict CYP3A4 inhibitors with a good positive rate and could improve the efficiency of high-throughput screening, but the model needs to be further improved for the differentiation of substrates and inhibitors, which might require the structural information of substrates to establish deep learning methods.
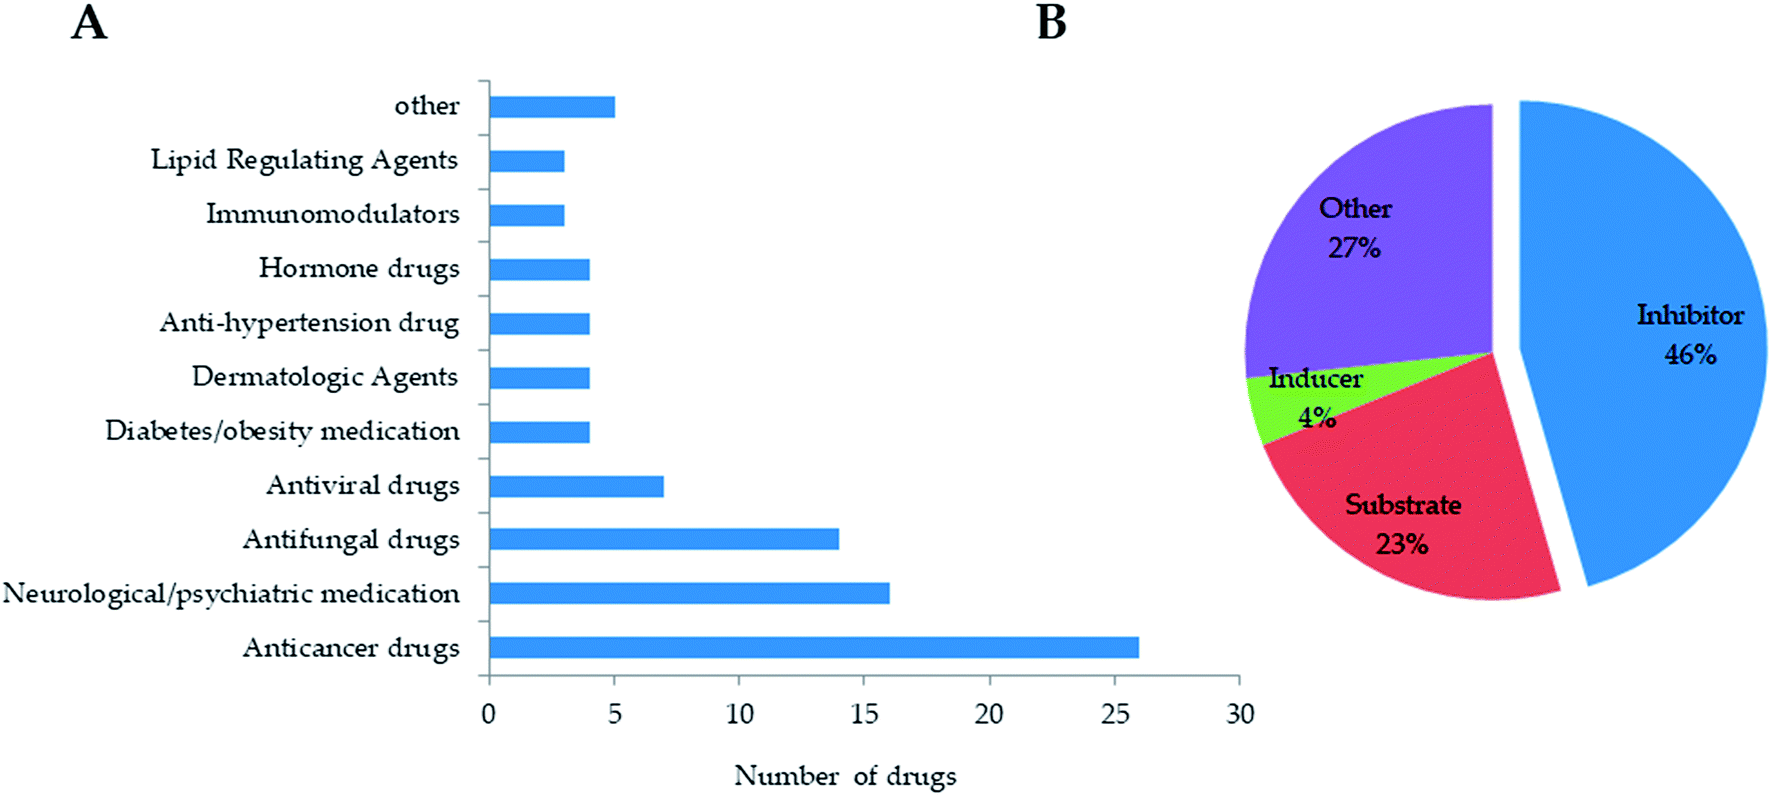 | ||
| Fig. 4 The prediction of CYP3A4 inhibitors from FDA-approved drug database. (A) drug distribution of predicted CYP3A4 inhibitors. (B) the performance of NB prediction model. | ||
Similarly, 116 natural products were predicted as potential CYP3A4 inhibitors by NB model. The EstPGood score indicates the positive probability of the compound as a CYP3A4 inhibitor. Based on the score ranking and the dominant fragment, we finally selected six compounds that have not been reported CYP3A4 inhibitory activity for subsequent screening in vitro. They were isoimperatorin, bergaptin, bisdemethoxycurcumin, azulol, pterostilbene, and ellipticine.
Then, the 6 compounds were further evaluated by CDOCKER. RMSD value calculated through redocking between the docking and initial poses was 1.136 Å, which suggested the reliability of CDOCKER methods. The 6 compounds could dock to CYP3A4 with a range of -CDOCKER interaction energy from 13.430 to 47.241. Ketoconazole, as a positive drug, had the greatest affinity and azulene was lowest affinity.
3.5 Validation in vitro
CYP3A4-Glo™ Screening System was utilized to evaluate the CYP3A4 inhibitory activity of the above 6 compounds (Table 3). Among them, pterostilbene and elliptisine had the strongest inhibitory activities and IC50 values of them were 1.120 μM and 0.052 μM, respectively, which could be compared with that of ketoconazole (0.047 μM). The CYP3A4 inhibition activity of isoimperatorin, bergaptin, bisdemethoxycurcumin and azulene were weaker. Elliptisine has a good interaction with CYP3A4 through forming hydrogen bond and pi–pi stacked bond with ARG372, ALA370 and PHE215 (Fig. 5). Pterostilbene could also bind to CYP3A4 well, and the amino acids included ARG212, SER119 and ALA370 via conventional hydrogen bond/attractive charge and pi–alkyl interaction (Fig. 5). SER119 plays an important role in the interaction between ligand and CYP3A4, which was also proved by the original ligand.| Name | Structure | -CDOCKER interaction energy | IC50 (μM) |
|---|---|---|---|
| Ketoconazole |  |
65.399 | 0.047 ± 0.002 |
| Isoimperatorin |  |
36.424 | 18.231 ± 1.721 |
| Bergaptin |  |
47.241 | 12.921 ± 1.171 |
| Bisdemethoxycurcumin |  |
42.251 | 14.821 ± 2.087 |
| Azulene |  |
13.430 | 22.485 ± 2.539 |
| Pterostilbene | 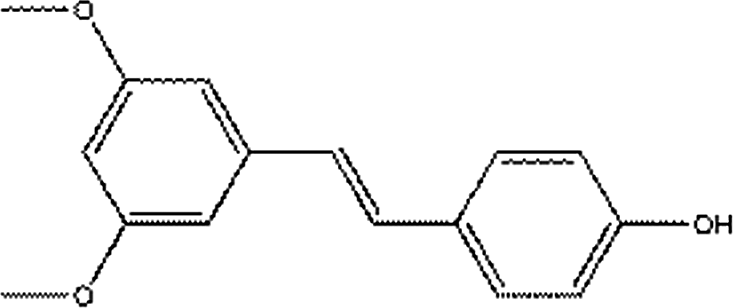 |
33.310 | 1.120 ± 0.056 |
| Ellipticine |  |
34.819 | 0.052 ± 0.003 |
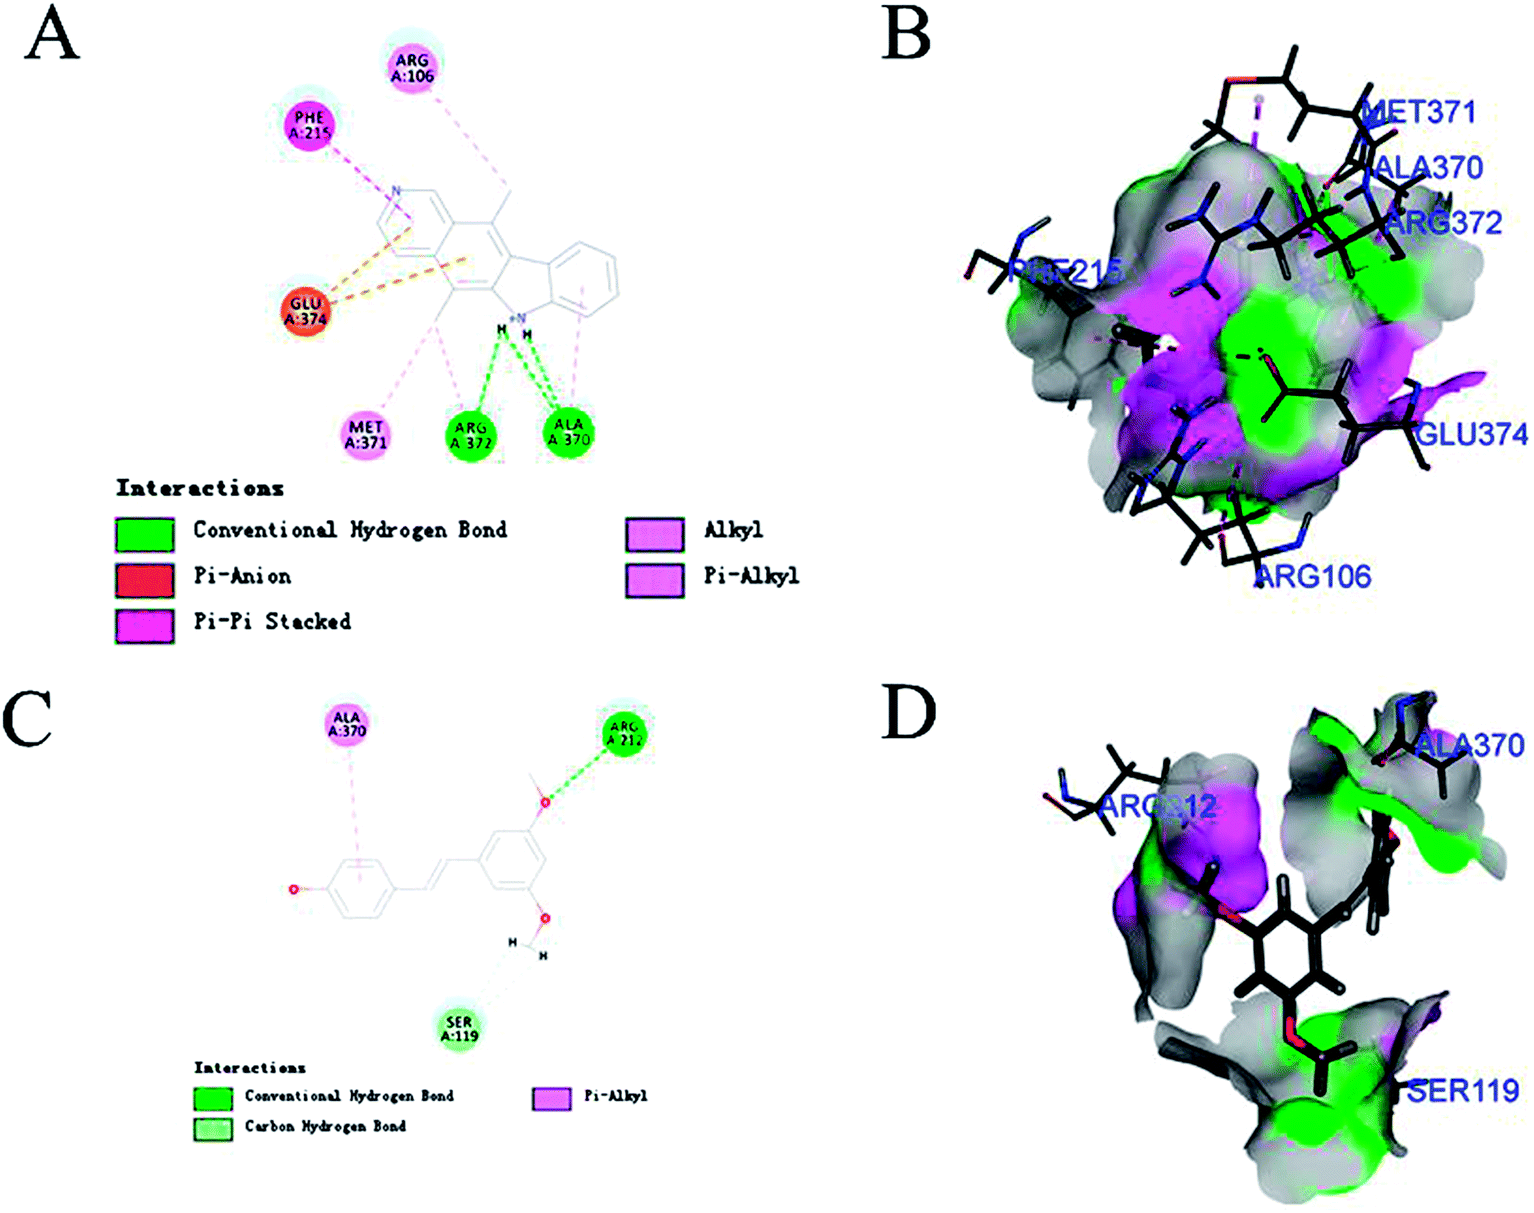 | ||
| Fig. 5 The interaction between CYP3A4 and pterostilbene/ellipticine. (A and B) Elliptisine has a good interaction with CYP3A4 through forming hydrogen bond and pi–pi stacked bond with ARG372, ALA370 and PHE215. (C and D) Pterostilbene binds to CYP3A4 by interacting with the amino acids including ARG212, SER119 and ALA370 via conventional hydrogen bond/attractive charge and pi–alkyl interaction. | ||
Pterostilbene has phenolic hydroxyl group, and elliptisine contains two saturated nitrogen atoms, which is consistent with the good fragments given by NB model. Pterostilbene is the main antioxidant of blueberry, and is also a naturally dimethylated analog of resveratrol, but it has higher in vivo bioavailability. A large body of evidence suggests that pterostilbene may have numerous preventive and therapeutic properties in a variety of human diseases including the nervous system, cardiovascular system, metabolic system and blood system diseases.38 Pterostilbene has been shown to be an effective anticancer drug in several malignancies.39 In view of the wide range of pharmacological activities of pterostilbene, we should pay attention to safety and toxicity in future research and biomedical uses. We firstly validated that pterostilbene has strong CYP3A4 inhibitory activity and DDI through CYP3A4 should be considered, especially when eating foods, like blueberry, rich in pterostilbene. Ellipticine is an alkaloid isolated from the oleander family. It is one of the simplest natural alkaloids with a planar structure. In the past few decades, ellipticine has become a very promising anti-tumor drug, and interaction with DNA is one of the most studied effects of ellipticine on cell division.40 Many anticancer drugs are metabolized by CYP3A4. Therefore, when combined with ellipticine, we should pay special attention to its strong inhibitory activity against CYP3A4, which may influence the therapeutic effect of other anti-tumor drugs.
It was suggested that their DDI occurrence based on the inhibition of CYP3A4 had low probability. Therefore, 2 of 6 compounds accurately were predicted CYP3A4 inhibitors with high activity, which indicated that the application of NB classification model could improve the positive rates of identification for CYP3A4 inhibitor remarkably.
4. Conclusions
In this study, 4 classification models were constructed to discriminate CYP3A4 inhibitors from non-inhibitors by means of SVM, NB, RP and KNN algorithms. Through molecular descriptors selection and optimization by correlation analysis and stepwise regression method, we found 20 molecular descriptors playing a vital role in the construction of the prediction models. In addition, combined with the fingerprint descriptor (ECFP-6), the models could significantly improve their prediction accuracy. Variety of validations including cross-validation, test set, and Y-scrambling verified the prediction reliability of the models. Finally, NB model was selected as the optimal model, and it was successfully developed and used in the identification of CYP3A4 inhibitors combined with molecular docking.Based on the prediction results, 90 compounds from FDA-approved drug databases were predicted as inhibitors, and 46% of them had been reported to have CYP3A4 inhibitory activity. For natural product database, 33.3% of compounds showed high CYP3A4 inhibitory activities, indicating that the prediction model could remarkably increase the probability of identifying CYP3A4 inhibitors while reducing the cost of early drug development. We also firstly reported that pterostilbene and ellipticine had strong inhibitory activity with IC50 value of 1.120 ± 0.056 μM and 0.052 ± 0.003 μM, respectively. In general, this study is the first report using multiple ligand-based machine learning methods and structure-based docking approach, validated with a successful pilot study of virtual screening in identifying CYP3A4 inhibitors, which is able to predict early adverse reactions and provide new ideas for drug development.
Conflicts of interest
There are no conflicts to declare.Acknowledgements
This study was supported by grants from the National Key R&D Program of China No. 2016YFC0904900, National Natural Science Foundation (No. 81673509 and No. 81573504) of PR China, Beijing Municipal Natural Science Foundation (No. 7171012), National Science and Technology Major Projects for “Major New Drugs Innovation and Development” of China (No. 2017ZX09304028 and No. 2017ZX09101001), National population and health scientific data sharing platform (No. 2016-NCMI-ZX-05, NCMI-AGE05-201609), National Great Science and Technology Projects (No. 2013ZX09402203, 2014ZX09507003002), and CAMS Innovation Fund for Medical Sciences (CIFMS) (No. 2016-I2M-3-007).References
- X. Pang, L. Wang, D. Kang, Y. Zhao, S. Wu, A. L. Liu and G. H. Du, Molecules, 2017, 22, E1246 CrossRef PubMed.
- A. K. Goey, K. D. Mooiman, J. H. Beijnen, J. H. Schellens and I. Meijerman, Cancer Treat. Rev., 2013, 39, 773–783 CrossRef CAS PubMed.
- D. Pal and A. K. Mitra, Life Sci., 2006, 78, 2131–2145 CrossRef CAS PubMed.
- Y. Shirasaka, J. E. Sager, J. D. Lutz, C. Davis and N. Isoherranen, Drug Metab. Dispos., 2013, 41, 1414–1424 CrossRef CAS PubMed.
- O. A. Fahmi, S. Hurst, D. Plowchalk, J. Cook, F. Guo, K. Youdim, M. Dickins, A. Phipps, A. Darekar, R. Hyland and R. S. Obach, Drug Metab. Dispos., 2009, 37, 1658–1666 CrossRef CAS PubMed.
- P. A. Williams, J. Cosme, D. M. Vinkovic, A. Ward, H. C. Angove, P. J. Day, C. Vonrhein, I. J. Tickle and H. Jhoti, Science, 2004, 305, 683–686 CrossRef CAS PubMed.
- J. K. Yano, M. R. Wester, G. A. Schoch, K. J. Griffin, C. D. Stout and E. F. Johnson, J. Biol. Chem., 2004, 279, 38091–38094 CrossRef CAS PubMed.
- M. Ekroos and T. Sjogren, Proc. Natl. Acad. Sci. U. S. A., 2006, 103, 13682–13687 CrossRef CAS PubMed.
- T. L. Domanski, Y. A. He, K. K. Khan, F. Roussel, Q. Wang and J. R. Halpert, Biochemistry, 2001, 40, 10150–10160 CrossRef CAS PubMed.
- S. Ekins, D. M. Stresser and J. A. Williams, Trends Pharmacol. Sci., 2003, 24, 161–166 CrossRef CAS PubMed.
- N. Iannella and A. D. Back, Neural Netw., 2001, 14, 933–939 CrossRef CAS PubMed.
- I. Grbatinic, N. Milosevic and B. Krstonosic, J. Theor. Biol., 2018, 438, 96–115 CrossRef PubMed.
- K. C. Chou and Y. D. Cai, J. Biol. Chem., 2002, 277, 45765–45769 CrossRef CAS PubMed.
- R. Arimoto, M. A. Prasad and E. M. Gifford, J. Biomol. Screening, 2005, 10, 197–205 CrossRef CAS PubMed.
- C. W. Yap and Y. Z. Chen, J. Chem. Inf. Model., 2005, 45, 982–992 CrossRef CAS PubMed.
- L. Terfloth, B. Bienfait and J. Gasteiger, J. Chem. Inf. Model., 2007, 47, 1688–1701 CrossRef CAS PubMed.
- M. K. Leong and T. H. Chen, Med. Chem., 2008, 4, 396–406 CrossRef CAS.
- M. K. Leong, Y. M. Chen and T. H. Chen, J. Comput. Chem., 2009, 30, 1899–1909 CrossRef CAS PubMed.
- P. Vasanthanathan, O. Taboureau, C. Oostenbrink, N. P. Vermeulen, L. Olsen and F. S. Jorgensen, Drug Metab. Dispos., 2009, 37, 658–664 CrossRef CAS PubMed.
- J. M. Kriegl, T. Arnhold, B. Beck and T. Fox, J. Comput.-Aided Mol. Des., 2005, 19, 189–201 CrossRef CAS PubMed.
- A. Abdo, B. Chen, C. Mueller, N. Salim and P. Willett, J. Chem. Inf. Model., 2010, 50, 1012–1020 CrossRef CAS PubMed.
- A. Abdo and N. Salim, J. Chem. Inf. Model., 2011, 51, 25–32 CrossRef CAS PubMed.
- N. R. Garge, G. Bobashev and B. Eggleston, BMC Bioinf., 2013, 14, 125 CrossRef PubMed.
- D. W. Miller, J. Chem. Inf. Comput. Sci., 2001, 41, 168–175 CrossRef CAS PubMed.
- H. Shen and K. C. Chou, Biochem. Biophys. Res. Commun., 2005, 334, 288–292 CrossRef CAS PubMed.
- J. Sim, S. Y. Kim and J. Lee, Bioinformatics, 2005, 21, 2844–2849 CrossRef CAS PubMed.
- M. K. Gilson, T. Liu, M. Baitaluk, G. Nicola, L. Hwang and J. Chong, Nucleic Acids Res., 2016, 44, D1045–D1053 CrossRef CAS PubMed.
- J. Xia, E. L. Tilahun, E. H. Kebede, T. E. Reid, L. Zhang and X. S. Wang, J. Chem. Inf. Model., 2015, 55, 374–388 CrossRef CAS PubMed.
- M. Davies, M. Nowotka, G. Papadatos, N. Dedman, A. Gaulton, F. Atkinson, L. Bellis and J. P. Overington, Nucleic Acids Res., 2015, 43, W612–W620 CrossRef CAS PubMed.
- L. Wang, M. Wang, A. Yan and B. Dai, Mol. Diversity, 2013, 17, 85–96 CrossRef CAS PubMed.
- J. Fang, R. Yang, L. Gao, D. Zhou, S. Yang, A. L. Liu and G. H. Du, J. Chem. Inf. Model., 2013, 53, 3009–3020 CrossRef CAS PubMed.
- R. Gomeni and E. Merlo-Pich, Br. J. Clin. Pharmacol., 2007, 63, 595–613 CrossRef PubMed.
- L. Wang, L. Chen, Z. Liu, M. Zheng, Q. Gu and J. Xu, PLoS One, 2014, 9, e95221 CrossRef PubMed.
- L. Y. Hu, M. W. Huang, S. W. Ke and C. F. Tsai, SpringerPlus, 2016, 5, 1304 CrossRef PubMed.
- X. Zhao, Z. Ma and M. Yin, Int. J. Mol. Sci., 2012, 13, 2196–2207 CrossRef CAS PubMed.
- S. Yamaori, J. Ebisawa, Y. Okushima, I. Yamamoto and K. Watanabe, Life Sci., 2011, 88, 730–736 CrossRef CAS PubMed.
- D. S. Wishart, Y. D. Feunang, A. C. Guo, E. J. Lo, A. Marcu, J. R. Grant, T. Sajed, D. Johnson, C. Li, Z. Sayeeda, N. Assempour, I. Iynkkaran, Y. Liu, A. Maciejewski, N. Gale, A. Wilson, L. Chin, R. Cummings, D. Le, A. Pon, C. Knox and M. Wilson, Nucleic Acids Res., 2018, 46, D1074–D1082 CrossRef PubMed.
- D. McCormack and D. McFadden, Oxid. Med. Cell. Longevity, 2013, 2013, 575482 Search PubMed.
- D. McCormack and D. McFadden, J. Surg. Res., 2012, 173, e53–61 CrossRef CAS PubMed.
- M. Stiborova and E. Frei, Curr. Med. Chem., 2014, 21, 575–591 CrossRef CAS PubMed.
Footnote |
| † These authors contributed equally. |
| This journal is © The Royal Society of Chemistry 2018 |