DOI:
10.1039/C8RA06145A
(Paper)
RSC Adv., 2018,
8, 38506-38516
A combination of experiment and theoretical methods to study the novel and low-cost corrosion inhibitor 1-hydroxy-7-azabenzotriazole for mild steel in 1 M sulfuric acid
Received
20th July 2018
, Accepted 5th November 2018
First published on 15th November 2018
Abstract
1-Hydroxy-7-azabenzotriazole (HOAT) was explored via experimental and theoretical computation methods as a corrosion inhibitor for mild steel in 1 M sulfuric acid. These data indicate that HOAT has good ability to suppress corrosion of the mild steel, with ideal agreement with between experimental and computational results. Besides, the electrochemical experiments show that HOAT is a mixed-type corrosion inhibitor for mild steel in 1 M H2SO4. Furthermore, HOAT adsorption on the surface of steel conforms to the Langmuir isotherm model. Finally, computational simulation was executed to deeply investigate the mechanism to HOAT inhibition corrosion of steel.
1. Introduction
Mild steel has a wide range of applications in production and life because of its excellent properties.1–5 These include the production of various building components, containers, tanks, furnaces and agricultural machinery, in addition to various heat exchange equipment, heat transfer equipment and cooling equipment, etc. However, thermal equipment such as boilers and heat exchangers gradually form various types of dirt during use, and the poor thermal conductivity of this dirt causes the local temperature of the furnace tubes to rise, which reduces the strength of steel materials and often causes tube explosion accidents as well as affecting the boiler operation. Therefore, pickling plays a very important role in boiler operation of a power plant to remove these dirt and oxidation products.
Sulfuric acid is the most commonly used pickling solution. It can effectively remove metal surface dirt and oxidation products.6 However, sulfuric acid has certain corrosion effects on the substrate of metal equipment.7 At the same time, the hydrogen released will diffuse into the interior of the metal, causing hydrogen embrittlement in the washed equipment. In addition, a large amount of acid gas that is precipitated will deteriorate working conditions. Therefore, corrosion inhibitors should be added during pickling to inhibit the corrosion of metals in acidic media, reducing the amount of acid used, improving the pickling effect, and extending the service life of thermal equipment.
The majority of pickling corrosion inhibitors are organic compounds containing oxygen (O), nitrogen (N), sulfur (S), phosphorus (P), etc.8–15 Such as amines, thioureas, aldehydes and ketones phosphorus compounds. Its mechanism of action differs from the fact that inorganic corrosion inhibitors with no surface activity undergo chemical reactions on the metal surface, relying on molecular adsorption to form molecularly oriented protective films on the surface of metal to prevent corrosion of the metal by corrosive media. On the one hand, oxygen, nitrogen, sulfur, phosphorus and other elements contain lone pair electrons, and they all exist as polar groups in organic compounds. On the other hand, transition metals such as iron and copper can be used as electron acceptors when they are not filled with d electron orbitals. These elements coordinate with metal elements to form a strong chemical adsorption layer. In addition, double bonds, triple bonds, and benzene rings can also be chemically adsorbed on metal surfaces by the action of π bonds.
In this work, we studied for the first time the corrosion inhibition performance of 1-hydroxy-7-azabenzotriazole (HOAT), an organic compound of triazole, in low-carbon steel in sulfuric acid solution. It has not been reported in other literatures.
2. Experimental
2.1. Material
The 1 M sulfuric acid corrosion solution was prepared with analytically pure concentrated sulfuric acid and ultrapure water. HOAT was added to 1 M sulfuric acid solution to prepare 0.5, 1, 2, 5, and 10 mM solution. The HOAT structure was shown in Fig. 1 and HOAT was purchased at Adamas Reagent Co., Ltd. The purity of HOAT is greater than 99.9%. The chemical composition (in wt%) of mild steel as follow: C is 0.1%, Si is 0.035%, Mn is 0.4%, Cr is 0.3%, Ni is 0.3% and the rest is iron. The mild steel working electrode was cut into 1 × 1 × 1 cm3 squares and then mounted in epoxy to leave a 1 × 1 cm2 work surface exposed to the test system. The mild steel electrode was sanded on sandpaper (400, 800, 1200, and 2000 mesh) prior to electrochemical measurement experiments. Then it was washed with distilled water, absolute ethanol and acetone solution, and finally the electrode surface was dried at room temperature.
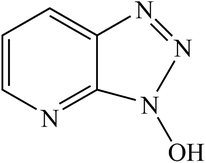 |
| | Fig. 1 Molecular structural formula of the 1-hydroxy-7-azabenzotriazole. | |
2.2. Weight loss experiment
Weight-loss test samples (mild steel) were cut into 5.0 × 2.5 × 0.5 cm3 cuboids. These samples were hung to HOAT in different concentrations (0.5, 1, 2, 5, and 10 mM) solution and 1 M H2SO4 solution in triplicate for 4 hours at different temperatures (298 K, 308 K, 318 K, and 328 K), respectively. These mild steel cuboids were carefully washed via banister brush with distilled water, absolute ethanol and acetone. Finally, these mild steel cuboids were dried and weighed.
2.3. Electrochemical tests
All electrochemical tests were executed at 298 K via the chi760e electrochemical workstation, a product of Shanghai Chenhua Co., Ltd, using a three-electrode system. Mild steel acts as a working electrode (1 × 1 cm2), saturated calomel electrode with Luggin capillary as a reference electrode, and a platinum electrode (1 × 1 cm2) as a counter electrode. Firstly, Mild steel electrode was dipped in the test solution for thirty minutes to measure its open circuit potential (OCP) and obtain stable state. Electrochemical impedance spectroscopy (EIS) was carried out under the EOCP with the frequency range from 105 Hz to 10−2 Hz. Corresponding EIS parameters are fitted using Zsimpwin software. Tafel curves were tested with in the potential range of −0.25 V to +0.25 V vs. EOCP in the scan rate of 0.5 mV s−1.16 Electrochemical tests at each concentration were repeated three times to get a perfect same result.
2.4. Surface analysis
Mild steel were cut into 0.5 × 0.5 × 0.5 cm3 cuboids. After sanding carefully, the steel samples soaked at 298 K in 1 M H2SO4 solutions in the absence and presence HOAT (10 mM) for 2 hours. The corrosion product of the tested steel surface was fully rinsed via distilled water and a soft brush. After that, the steel surface was observed using SEM (JEOL-JSM-7800F), under high vacuum condition. Pretreatment of the steel sample surface in the same manner as the test SEM. The 3D images and the average roughness of the steel surfaces were tested using AFM (MFP-3D-BIO), using tapping mode.
2.5. Calculation details
Quantum chemistry of HOAT molecule was calculated via Gaussian 03W. Based on the density functional theory, the basis set is 6–311 ++G (d, p), the job type is Opt + Freq, and the B3LYP as a function quantifies HOAT molecule. To more closely simulate the real state of HOAT in 1 M sulfuric acid. We calculated the morphology of different HOAT heteroatoms after protonation, and further compared their optimized energies. The lowest energy, the most stable protonated state of HOATH+ is used for the subsequent dynamics simulation.
HOATH+ adsorption on the mild steel was studied using Dynamic simulations with forcite module in Material Studio 8.0. The model of Fe (110) surface was chose as simulated substrate due to low Miller index steel surface. HOATH+ and three hundred H2O molecules adsorption on the Fe (110) surface were assumed in the simulation 3D box (2.1 × 2.2 × 4.1 nm3) with COMPASS force field. The calculation task is dynamics, fine as the optimization type of quality. Energy is 1 × 10⁻⁴ kcal mol−1. Force is 0.005 kcal mol−1 Å−1. Displacement is 5 × 10⁻⁵ Å. Max iterations is 500. Electrostatic and van der Waals are all set to Ewald. Charges is Forcefield assigned. The four layers of Fe atoms restricted their position and the 298 K as simulated temperature, NVT as the specification set, 1 fs as the time step, and 300 ps as the simulation time.
3. Results and discussion
3.1. Weight loss experiment
Weight loss tests were carried out in diverse temperatures (298 K, 308 K, 318 K, and 328 K) in 1 M H2SO4 without and with different concentrations HOAT. The weight loss data were presented in the Table 1. Mild steel corrosion rate (ν), inhibition efficiency (η) and surface coverage (θ) are calculated, respectively, as followings:17–19| |
 | (1) |
| |
 | (2) |
| |
 | (3) |
where W represents the difference value between the steel mass before and after weight loss test. S represents the steel surface area. t represents the time of the researched samples soaked in the corrosion solution, ν0 is the mild steel corrosion rate without HOAT and ν is the mild steel corrosion rate with different concentrations of HOAT.
Table 1 The weight loss experiment data to steel in 1 mol L−1 H2SO4 with and without diverse concentrations of HOAT for four hours at diverse temperatures
| T (K) |
C (mM) |
V (g m−2 h−1) |
η (%) |
θ |
| 298 |
Blank |
18.71 |
— |
— |
| 0.5 |
2.39 |
87.2 |
0.872 |
| 1 |
2.15 |
88.5 |
0.885 |
| 2 |
1.81 |
90.3 |
0.903 |
| 5 |
1.36 |
92.7 |
0.927 |
| 10 |
0.95 |
94.9 |
0.949 |
| 308 |
Blank |
28.92 |
— |
— |
| 0.5 |
6.22 |
78.5 |
0.785 |
| 1 |
5.69 |
80.3 |
0.803 |
| 2 |
5.17 |
82.1 |
0.821 |
| 5 |
3.99 |
86.2 |
0.862 |
| 10 |
2.34 |
91.9 |
0.919 |
| 318 |
Blank |
40.86 |
— |
— |
| 0.5 |
12.13 |
70.3 |
0.703 |
| 1 |
10.34 |
74.7 |
0.747 |
| 2 |
9.35 |
77.1 |
0.771 |
| 5 |
7.23 |
82.3 |
0.823 |
| 10 |
3.80 |
90.7 |
0.907 |
| 328 |
Blank |
62.13 |
— |
— |
| 0.5 |
26.84 |
56.8 |
0.568 |
| 1 |
21.06 |
66.1 |
0.661 |
| 2 |
16.28 |
73.8 |
0.738 |
| 5 |
10.87 |
82.5 |
0.825 |
| 10 |
7.02 |
88.7 |
0.887 |
As shown in Table 1, it can be find that the values of v of researched steel increases sharply with 1 mol L−1 H2SO4 without HOAT with the increase of temperatures. Furthermore, it can get conclusion that as the concentrations of HOAT increases, the v decreases and the η increases significantly, indicating that increase of HOAT concentrations are favorable to increase the adsorption amount of mild steel surface inhibitors. The η of HOAT is up to 94.9% with the HOAT concentration reaching 10 mM at 298 K, which shows that HOAT can effectively adsorb on steel surface. In addition, the η shows a downward trend with the augment of temperatures, which indicates that the augment of the temperature causes the thermal motion of the inhibitor molecules to increase, which is unfavorable for the HOAT molecules adsorption on the steel surface. Whereas, when the concentrations (5 mM and 10 mM) of HOAT are high, excellent performance of steel corrosion inhibition in 1 mol L−1 H2SO4 can still be exhibited at high temperature.
3.2. Tafel curves
Tafel curves of steel at 298 K in 1 mol L−1 H2SO4 without and with diverse concentrations of the HOAT are displayed in Fig. 2.
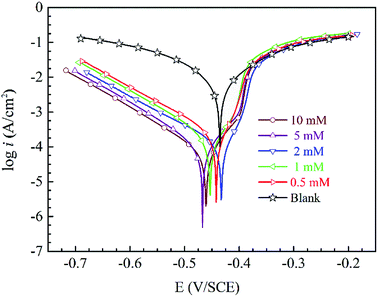 |
| | Fig. 2 Tafel curves for mild steel at 298 K in 1 M H2SO4 without and with different concentrations of HOAT. | |
To further understand the inhibition mechanism of HOAT to mild steel in the 1 mol L−1 H2SO4, relevant parameters are shown in Table 2. Using extrapolation to obtain the corrosion voltage (Ecorr) and corrosion current density (Icorr). The important electrochemical parameters are showed in Table 2. The η is calculated via eqn (4) as following:20–26
| |
 | (4) |
where
Icorr and
Icorr,0 are current densities with and without HOAT in the 1 M H
2SO
4, respectively.
Table 2 Parameters of electrochemistry for mild steel at 298 K in 1 M H2SO4 without and with diverse concentrations of HOAT
| C (mM L−1) |
Ecorr (mV/SCE) |
Icorr (mA cm−2) |
βc (mV dec−1) |
βa (mV dec−1) |
η (%) |
| Blank HOAT |
−435 |
2.48 |
−39.84 |
42.1 |
— |
| 0.5 |
−442 |
0.26 |
−120.04 |
38.48 |
89.5 |
| 1 |
−453 |
0.23 |
−109.66 |
37.55 |
90.7 |
| 2 |
−433 |
0.15 |
−126.39 |
38.59 |
93.9 |
| 5 |
−467 |
0.09 |
−101.27 |
44.51 |
96.3 |
| 10 |
−461 |
0.08 |
−104.01 |
39.26 |
96.7 |
In Fig. 2, cathodic and anodic polarization curves transfer obviously to lower electric current with adding of HOAT, which means the accretion of HOAT decreases anodic steel dissolution and prevents reduction of the hydrogen ions. In addition, the cathode current density decline trend is more obvious than the anode, which shows that HOAT adsorption on mild steel effectively inhibits the evolution of hydrogen at the cathode. By observing the anodic polarization curve, it can be found that when the polarization potential is high, HOAT shows a significant desorption phenomenon on the steel surface.
As showed in Table 2, the η augments markedly with the increase of researched inhibitor concentrations. Moreover, corrosion potentials move in the cathode direction with increasing HOAT concentrations. The maximum subtractive shift value is 32 mV and less than 85 mV.27 Therefore, HOAT is a mixed-type corrosion inhibition behavior for steel in sulfuric acid. We can find that the values of βc and βa changed with different concentrations HOAT, indicating that the HOAT can control the cathode and anode reactions. Furthermore, the η acquired from Tafel curves have an ideal accord with the weight loss tests.
3.3. EIS measurements
The plots of steel Nyquist (a) and Bode (b) in 1 M sulfuric acid at 298 K without and with diverse concentrations of HOAT are presented in Fig. 3. It can be found that the Nyquist plots are defective capacitive loops, which indicate that steel corrosion are dominated by process of charge shift in the test solution.28,29 The capacitive loop shows non-ideal semicircle in test solution due to the roughness and inhomogeneity surface of mild steel electrode.30 From Fig. 3(a), all of the Nyquist plots are constituted of capacitive loop and inductive loop corresponding to in the high and low frequency area, respectively. As the HOAT concentrations increase, the radius of the capacitive loop increases significantly, while the inductive loop gradually decreases in the low frequency area. This phenomenon is called impedance spectrum “degradation”, which shows that HOAT molecules effectively inhibit steel corrosion in 1 M H2SO4.
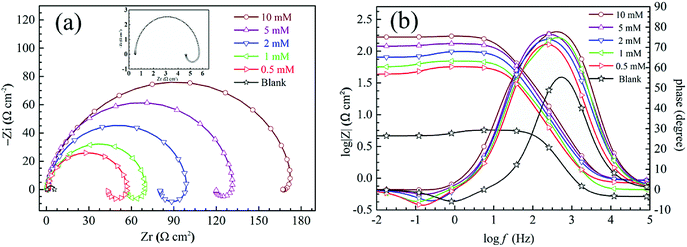 |
| | Fig. 3 EIS plots of the mild steel at 298 K in 1 M H2SO4 solution without and with diverse concentrations of HOAT: (a) Nyquist and (b) Bode plots. | |
The capacitive loop of high frequency ascribe to double layer capacitance and charge shift resistance. As the HOAT concentration increases, the radius of the capacitive loop increases significantly, indicating that HOAT molecules adsorption on the surface of steel greatly increases charge shift resistance.31 The inductive loop of low frequency ascribe to adsorption species as SO42− and H+ on the mild steel surface or to the passivated surface re-dissolution of mild steel.11
As shown the Bode plot in Fig. 3(b), the values of impedance modulus and phase angle significantly increase with the HOAT concentrations increases. The value of impedance modulus increases two orders of magnitude and phase angle increased to 80° with the HOAT reaches optimum concentration (10 mM), which indicates that the adsorption of HOAT effectively inhibits the steel corrosion in 1 mol L−1 H2SO4.30
In order to obtain the impedance spectrum parameters, corresponding equivalent circuit is executed to fit the data of impedance spectrum in Fig. 4. Rs stands for the solution resistance, Rct represents the charge transfer resistance, L and RL are inductive and inductive resistance, respectively. CPE stands for constant phase element. The impedance of the CPE is obtained via formula (5) as following:32–34
| |
 | (5) |
where
Y0 represents the CPE constant, j represents the imaginary root and
ω represents the angular frequency.
n represents the deviation parameter. Double layer capacitance (
Cdl) is used to replace CPE because it can more accurately fit the impedance values. The
Cdl is calculated as follow:
35,36
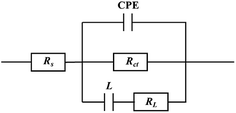 |
| | Fig. 4 The best equivalent circuit model to use for fitting. | |
The vital impedance parameters are presented in Table 3. The η is obtained via formula (7) as following:37,38
| |
 | (7) |
where
Rct,0 and
Rct stand for the charge transfer resistances in the absence and presence of diverse concentrations HOAT, respectively.
Table 3 Impedance parameters for mild steel at 298 K in 1 M H2SO4 with and without diverse concentrations of the HOAT
| C (mM) |
Rs (Ω cm2) |
Y0 × 10−6 (S sn cm−2) |
n |
Cdl (μF cm−2) |
Rct (Ω cm2) |
L (Ω cm2) |
RL (Ω cm2) |
χ2 ( × 10−3) |
η (%) |
| Blank HOAT |
0.51 |
216.5 |
0.98 |
197.01 |
5.23 |
3.81 |
19.61 |
0.78 |
— |
| 0.5 |
0.84 |
150.7 |
0.94 |
127.42 |
56.55 |
196.52 |
170.52 |
1.23 |
90.75 |
| 1 |
0.65 |
111.2 |
0.96 |
100.19 |
65.08 |
207.10 |
186.26 |
1.35 |
91.96 |
| 2 |
0.91 |
106.6 |
0.94 |
91.17 |
99.65 |
241.92 |
391.30 |
0.87 |
94.75 |
| 5 |
0.93 |
78.3 |
0.95 |
70.74 |
131.80 |
991.48 |
1288.94 |
0.91 |
96.03 |
| 10 |
0.90 |
71.6 |
0.95 |
68.65 |
169.91 |
29.96 |
29.96 |
1.02 |
96.92 |
Table 3 indicates that values of Rct augment, accordingly, the η values augment, which reveals that HOAT can availably inhibit the mild steel corrosion at 298 K in H2SO4 with the increase of concentrations, whereas, the values of Cdl reduce with the augment of HOAT concentrations. This phenomenon can be explained using the Helmholtz model as follow:39
| |
 | (8) |
where
ε0 stands for the air dielectric constant,
ε stands for local dielectric constant.
S is surface area of work electrode.
d stands for the thickness of double layer. On the one hand, the dielectric constant value of HOAT is lower than that of water molecules. On the other hand, HOAT has a larger molecular volume than water. Therefore, the local dielectric constant decreases and the
d value of the double layer capacitance augments with HOAT replaces the water molecules on the surface of work electrode, resulting in a decrease in the
Cdl values.
40 In addition, the values of deviation index
n are very close to 1, which manifests the behaves of steel interface nearly capacitive.
3.4. Adsorption isotherm and thermodynamic research
In general, corrosion inhibitors restrain metal corrosion via adsorption on the surface of metal, whereas the adsorption isotherm help understand vital information about corrosion inhibitors adsorption on surface of metal. Some important adsorption isotherms, containing Temkin, Frumkin, Flory–Huggins, Langmuir, El-Awady and so on, were used to fit weight loss experimental data. These results indicate that Langmuir adsorption isotherm shows a good linear relationship with weight loss test data. The Langmuir adsorption isotherm described as follow:41–44| |
 | (9) |
where C is HOAT concentration, θ is the coverage of surface (η/100), which gained in Table 1 by weight loss test. Kads is the equilibrium constant of adsorption.
The C vs. C/θ obtain straight lines with R2 and the slope near 1 at different temperatures as shown in Fig. 5. The slope values at different temperatures is very close to 1, indicating that the adsorption of HOAT in steel is consistent with Langmuir adsorption isotherm. The standard adsorption free energy (ΔG0ads),45–47 enthalpy, and entropy are obtained by the following equations:32
| |
 | (10) |
| |
 | (11) |
| | |
ΔG0ads = ΔH0ads − TΔS0ads
| (12) |
where the 55.5 is the molar concentration of H
2O.
R is the universal gas constant.
T is the absolute temperature.
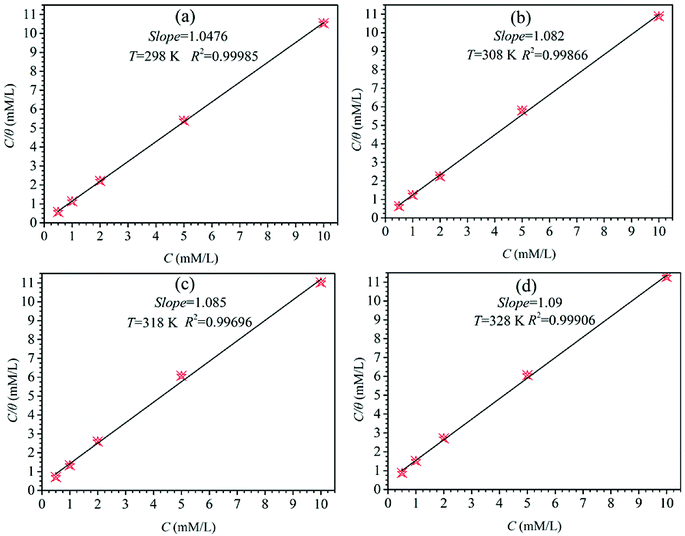 |
| | Fig. 5 The plots of Langmuir isotherm for mild steel in 1 M H2SO4 including different concentrations of HOAT at diverse temperatures (298 K, 308 K, 318 K and 328 K). | |
Via the eqn (11), ln![[thin space (1/6-em)]](https://www.rsc.org/images/entities/char_2009.gif) Kads vs. 1/T to obtain a straight line is appeared in Fig. 6. The thermodynamic parameters, such as ΔH0ads, ΔS0ads, ΔG0ads and Kads, are presented in Table 4. In generally, the large value of Kads and the small value of ΔG0ads indicate that the HOAT can compactly adsorb on the steel surface, effectively restrain mild steel corrosion. As shown in Table 4, it can be found that the Kads values decreases and the ΔG0ads values increases with temperature augment, which means that decreases of corrosion inhibition ability of HOAT for steel in H2SO4 with increasing temperatures. This phenomenon is attributed to the fact that thermal excursions between molecules with increasing temperature are not conducive to the HOAT adsorption on surface of steel. In addition, the value of ΔG0ads is between −31 and −33 kJ mol−1, so it can be considered that the HOAT adsorption on the surface of steel is mainly based on physical and chemical adsorption.48 In addition, ΔH0ads is −25.69 kJ mol−1, which indicates that the HOAT adsorption on the surface of steel is an exothermic process.11 ΔS0ads are approximately between −24 and −26 J k−1 mol−1, indicating HOAT lose its translation freedom when adsorption on the steel.32
Kads vs. 1/T to obtain a straight line is appeared in Fig. 6. The thermodynamic parameters, such as ΔH0ads, ΔS0ads, ΔG0ads and Kads, are presented in Table 4. In generally, the large value of Kads and the small value of ΔG0ads indicate that the HOAT can compactly adsorb on the steel surface, effectively restrain mild steel corrosion. As shown in Table 4, it can be found that the Kads values decreases and the ΔG0ads values increases with temperature augment, which means that decreases of corrosion inhibition ability of HOAT for steel in H2SO4 with increasing temperatures. This phenomenon is attributed to the fact that thermal excursions between molecules with increasing temperature are not conducive to the HOAT adsorption on surface of steel. In addition, the value of ΔG0ads is between −31 and −33 kJ mol−1, so it can be considered that the HOAT adsorption on the surface of steel is mainly based on physical and chemical adsorption.48 In addition, ΔH0ads is −25.69 kJ mol−1, which indicates that the HOAT adsorption on the surface of steel is an exothermic process.11 ΔS0ads are approximately between −24 and −26 J k−1 mol−1, indicating HOAT lose its translation freedom when adsorption on the steel.32
Table 4 The thermodynamic parameters at diverse temperatures for mild steel in 1 M H2SO4 solution including different concentrations of HOAT
| Temperature (K) |
Kad (103 L mol−1) |
ΔG0ads (kJ mol−1) |
ΔH0ads (kJ mol−1) |
ΔS0ads (J K−1 mol−1) |
| 298 |
10.71 |
−32.94 |
−25.69 |
−24.50 |
| 303 |
6.33 |
−32.69 |
|
−23.93 |
| 308 |
2.99 |
−31.78 |
|
−23.57 |
| 313 |
2.21 |
−31.95 |
|
−26.39 |
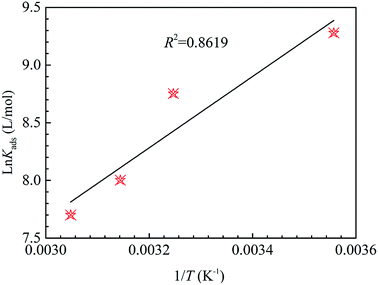 |
| | Fig. 6 The relation between ln![[thin space (1/6-em)]](https://www.rsc.org/images/entities/char_2009.gif) Kads and 1/T for mild steel at 1 M H2SO4 containing different concentrations of HOAT. Kads and 1/T for mild steel at 1 M H2SO4 containing different concentrations of HOAT. | |
3.5. Corrosion kinetic analysis
The different temperatures influence on the mild steel corrosion in 1 M H2SO4 in the absence and presence different concentrations of HOAT has been explored. The relevant kinetic parameters including activation energy (Ea), activation enthalpy (ΔHa), and activation entropy (ΔSa) for steel corrosion in the absence and present various concentrations of HOAT are acquired via Arrhenius (13) and transition state formulas (14) as followings:11,32| |
 | (13) |
| |
 | (14) |
where R represents universal gas constant, T represents thermodynamic temperature, v represents corrosion rate, A represents pre-exponential factor, N represents Avogadro's number and h represents Plank's constant. The ln![[thin space (1/6-em)]](https://www.rsc.org/images/entities/char_2009.gif) v vs. 1/T presented in Fig. 7. Moreover, the ln(v/T) vs. 1/T presented in Fig. 8. The relevant kinetic parameters, Ea, ΔHa and ΔSa, are calculated via formulas (13) and (14).
v vs. 1/T presented in Fig. 7. Moreover, the ln(v/T) vs. 1/T presented in Fig. 8. The relevant kinetic parameters, Ea, ΔHa and ΔSa, are calculated via formulas (13) and (14).
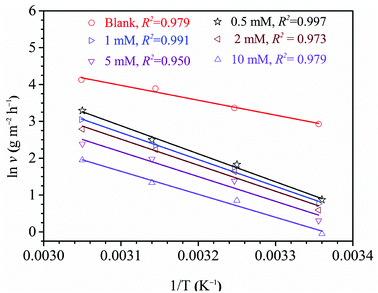 |
| | Fig. 7 The plots of Arrhenius for steel in 1 M H2SO4 without and with diverse concentrations of HOAT. | |
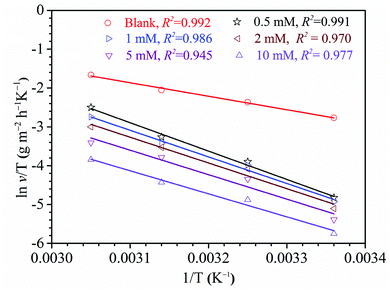 |
| | Fig. 8 The plots of transition state to steel in 1 M H2SO4 without and with diverse concentrations of HOAT. | |
As shown in Table 5, it is generally believed that the Ea and λ values increase after adding HOAT, indicating that HOAT has physical adsorption on the steel surface at this stage.11,49–51 When the HOAT concentration was 1 mM, it was clearly found that both the Ea and λ values decreased, which was attributed to HOAT chemical adsorption on the steel surface.49 Therefore, HOAT adsorbs on the surface of steel by means of physical and chemical adsorption, which is highly accordant to the results obtained by thermodynamics. In addition, the values of ΔHa are positive, which indicates that the steel dissolution in sulfuric acid is an endothermic process.18,52 Finally, the ΔSa values are significantly larger than that of the blank solution in the presence of HOAT. This is due to the presence of competitive adsorption of HOAT molecules to replace the water molecules on the surface of mild steel to increase the degree of chaos. As the concentration of HOAT increases, the ΔSa values decreases, which is attributed to HOAT molecules forming a dense and ordered protective film on the steel surface, resulting decline in the degree of chaos of steel surface.
Table 5 Kinetic parameters in 1 mol L−1 H2SO4 for steel with and without of diverse concentrations of HOAT
| Concentrations (mM) |
Ea (kJ mol−1) |
ΔHa (kJ mol−1) |
ΔSa (J k−1 mol−1) |
λ |
| Blank |
33.60 |
28.90 |
−138.01 |
1.47 × 10⁷ |
| 0.5 |
63.26 |
60.72 |
−48.30 |
3.13 × 10¹¹ |
| 1 |
60.59 |
56.96 |
−61.52 |
9.58 × 10¹⁰ |
| 2 |
58.82 |
55.06 |
−68.92 |
4.15 × 10¹⁰ |
| 5 |
55.83 |
52.38 |
−79.98 |
9.63 × 10⁹ |
| 10 |
51.87 |
49.30 |
−93.94 |
1.23 × 10⁹ |
3.6. Morphological analysis
3.6.1. Scanning electron microscopic research. Fig. 9 presents the images of SEM about the specimens of researched steel after and before dip in 1 M sulfuric acid for 2 h at 298 K in the presence and absence of the 10 mM HOAT. Fig. 9(a) shows the steel specimen soaked in 1 mol L−1 sulfuric acid for 2 hours. We can clearly see that the mild steel corrosion is very serious. The corrosion holes are large and deep. Fig. 9(b) shows the mild steel soaked into 1 M H2SO4 solution containing 10 mM HOAT. After soaking for 2 hours, due to the HOAT molecules adsorption on the surface of steel, the steel corrosion is significantly reduced. Fig. 9(c) presents a topography of the polished steel surface. The surface of the steel is very bright and a few polished scratches. Therefore, SEM images can intuitively express the inhibition of HOAT for t steel corrosion in 1 mol L−1 H2SO4.
 |
| | Fig. 9 The mild surface dipped in 1 M H2SO4 without HOAT (a) and with 10 mM HOAT (b) and freshly burnished steel surface (c) of SEM at 298 K for 2 h. | |
3.6.2. AFM observation. AFM is used diffusely study the surface nature of materials and roughness of surface.53,54 The 3D images of AFM and height profiles of mild steel in 1 mol L−1 H2SO4 without and with 10 mM HOAT for 2 hours at 298 K are presented in Fig. 10. As showed in Fig. 10(a), 3D topography surface of steel is very rough 1 mol L−1 sulfuric acid without HOAT. Fig. 10(b) shows that surface 3D topography of steel is relatively flat with 10 mM HOAT. Fig. 10(c) presents that 3D surface topography of newly polished steel. Fig. 10(d)–(f) are correspond to two-dimensional contour map of blank solution, 10 mM HOAT and new polished, respectively. Moreover, the roughness of the surface after adding the 10 mM HOAT reduce by 29 nm from the original 107 nm. It shows that HOAT molecules can effectively inhibit steel in sulfuric acid.
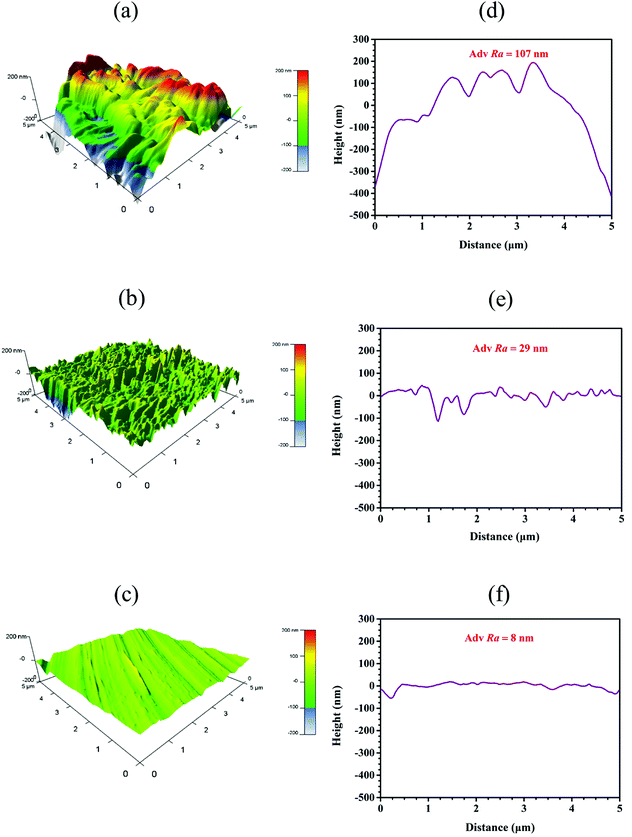 |
| | Fig. 10 The images of AFM 3D and height profile plots of corroded steel (a and d) without HOAT, steel (b and e) with 10 mM HOAT in 1 M H2SO4 solution and new polished steel (c and f) for 2 h at 298 K. | |
3.7. Quantum chemical research
To more realistically simulate the state of HOAT molecules in sulfuric acid. Quantum chemical calculation was performed for HOAT and its protonated form in acid. As shown in Fig. 11 and 12, their structures were optimized, the distribution of electron clouds and their energy values, electrostatic potential map, and dipole moments were calculated, respectively. The electron cloud is evenly distributed throughout the HOAT molecule, so the HOAT is most likely to adsorb on the surface of steel in a parallel adsorption manner. In addition, the ΔE values of HOAT and HOATH+ are 5.31 eV and 4.66 eV, respectively. It is generally accepted that a small ΔE value corresponds to a high corrosion inhibition efficiency.30,55 The dipole moment values of HOAT and HOATH+ are 3.28 Debye and 2.8433 Debye, respectively. Many researchers believe that small value of dipole moment favor the accumulation of corrosion inhibitor molecules on the surface of steel, thereby exhibiting higher corrosion inhibition performance.56 Therefore, it can be found that HOAT molecules are protonated to facilitate its adsorption on the steel surface.
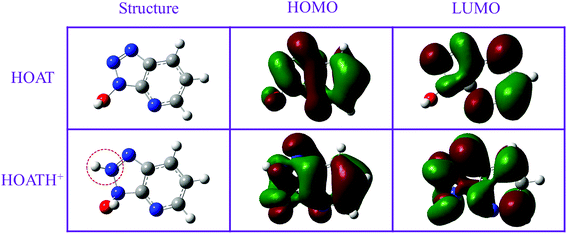 |
| | Fig. 11 The optimized structures, HOMO and LUMO of the HOAT and HOATH+. | |
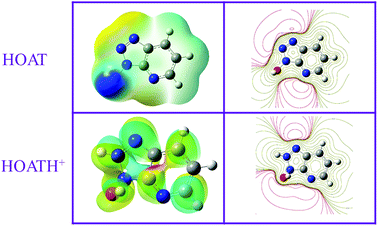 |
| | Fig. 12 Surface and contours maps of the electrostatic potential (ESP) of HOAT and HOATH+. | |
Fig. 12 shows the electrostatic potential maps of HOAT and HOATH+, including surface and contours maps, respectively. The blue (positive) and brown-red (negative) regions in the ESP map are related to electrophilic activity and nucleophilicity, respectively.57 It is clearly found that the brown-red region is mainly distributed near the nitrogen atom of the HOAT molecule and is conducive to forming a covalent bond with Fe. In addition, the brown-red area of HOATH+ is significantly larger than HOAT. Therefore, protonated HOAT is favorably adsorbed on the steel surface.
3.8. Molecular dynamics simulation research
We have in-depth explored the state of HOAT in acid in the previous quantum chemistry calculations. The calculation results show that the HOAT is protonated to facilitate the adsorption on the surface of steel. The top and side views of the HOATH+ adsorption on the steel surface are located in Fig. 13. It is obvious that HOATH+ is adsorbed on the Fe (110) surface with nitrogen and oxygen atoms as the reaction sites in parallel, which is consistent with the prediction of the previous frontier molecular orbital. In addition, the binding energy (Ebinding) is calculated using the following formulas (15) and (16):58,59| | |
Ebinding = −Einteract
| (15) |
| | |
Einteract = Etot − (Esubs + Einh)
| (16) |
where Etot represents total energy of entire simulation system, Esubs represents the energy except HOATH+, Einh represents the energy value of HOATH+. The value of this binding energy is 480.52 kJ mol−1 via formulas (15) and (16). This large binding energy value indicates that the HOAT can be closely adsorbed on the steel surface.
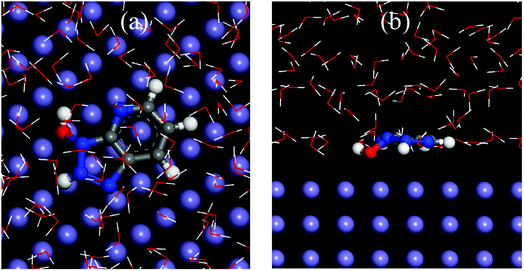 |
| | Fig. 13 Equilibrium adsorption configuration for HOATH+ on the Fe (110) surface: (a) top and (b) side views. | |
4. Conclusions
(1) The weight loss tests prove that HOAT is a superior inhibitor at different temperatures for steel in 1 M H2SO4. Whereas, the inhibition efficiency sharply changes in diverse concentrations of HOAT with increasing temperatures.
(2) The data of Tafel curves show that HOAT is a mixed-type corrosion inhibitor for mild steel in 1 M H2SO4. Namely, HOAT can both inhibit the cathodic and anodic processes to the mild steel in 1 M H2SO4.
(3) AFM and SEM images demonstrate a smoother steel surface in 10 mM HOAT than in 1 M sulfuric acid without HOAT, owing to the HOAT compact adsorption on the steel surface.
(4) Computational simulation studies prove that the HOAT adsorbs on surface of mild steel with a parallel mode attribute to HOAT conjugate ring of triazole and azaphenyl ring.
Conflicts of interest
There are no conflicts to declare.
References
- Y. Zhou, L. Guo, S. Zhang, S. Kaya, X. Luo and B. Xiang, RSC Adv., 2017, 7, 23961–23969 RSC.
- M. Ramezanzadeh, Z. Sanaei, G. Bahlakeh and B. Ramezanzadeh, J. Mol. Liq., 2018, 256, 67–83 CrossRef CAS.
- Y. Qiang, L. Guo, S. Zhang, W. Li, S. Yu and J. Tan, Sci. Rep., 2016, 6, 33305–33319 CrossRef CAS PubMed.
- L. Guo, S. Kaya, I. B. Obot, X. Zheng and Y. Qiang, J. Colloid Interface Sci., 2017, 506, 478–485 CrossRef CAS PubMed.
- A. S. Fouda, M. A. Ismail, A. S. Abousalem and G. Y. Elewady, RSC Adv., 2017, 7, 46414–46430 RSC.
- Y. Meng, W. Ning, B. Xu, W. Yang, K. Zhang, Y. Chen, L. Li, X. Liu, J. Zheng and Y. Zhang, RSC Adv., 2017, 7, 43014–43029 RSC.
- A. Mishra, C. Verma, H. Lgaz, V. Srivastava, M. A. Quraishi and E. E. Ebenso, J. Mol. Liq., 2018, 251, 317–332 CrossRef CAS.
- C. Verma, L. O. Olasunkanmi, E. E. Ebenso and M. A. Quraishi, J. Mol. Liq., 2018, 251, 100–118 CrossRef CAS.
- E. Alibakhshi, M. Ramezanzadeh, G. Bahlakeh, B. Ramezanzadeh, M. Mahdavian and M. Motamedi, J. Mol. Liq., 2018, 255, 185–198 CrossRef CAS.
- H. Lgaz, K. Subrahmanya Bhat, R. Salghi, Shubhalaxmi, S. Jodeh, M. Algarra, B. Hammouti, I. H. Ali and A. Essamri, J. Mol. Liq., 2017, 238, 71–83 CrossRef CAS.
- X. Zheng, S. Zhang, W. Li, L. Yin, J. He and J. Wu, Corros. Sci., 2014, 80, 383–392 CrossRef CAS.
- G. Khan, W. J. Basirun, S. N. Kazi, P. Ahmed, L. Magaji, S. M. Ahmed, G. M. Khan, M. A. Rehman and A. Badry, J. Colloid Interface Sci., 2017, 502, 134–145 CrossRef CAS PubMed.
- Z. Zhang, N. Tian, X. Li, L. Zhang, L. Wu and Y. Huang, Appl. Surf. Sci., 2015, 357, 845–855 CrossRef CAS.
- A. Kumar, M. Trivedi, B. Bhaskaran, R. Kishore Sharma and G. Singh, New J. Chem., 2017, 41, 8459–8468 RSC.
- F. El-Taib Heakal, M. A. Deyab, M. M. Osman, M. I. Nessim and A. E. Elkholy, RSC Adv., 2017, 7, 47335–47352 RSC.
- M. M. Solomon and S. A. Umoren, J. Colloid Interface Sci., 2016, 462, 29–41 CrossRef CAS PubMed.
- Y. Qiang, S. Zhang, S. Xu and W. Li, J. Colloid Interface Sci., 2016, 472, 52–59 CrossRef CAS PubMed.
- X. Zheng, S. Zhang, W. Li, M. Gong and L. Yin, Corros. Sci., 2015, 95, 168–179 CrossRef CAS.
- E. M. Sherif and S.-M. Park, Electrochim. Acta, 2006, 51, 4665–4673 CrossRef CAS.
- R. Fuchs-Godec, J. Mol. Liq., 2017, 228, 230–235 CrossRef CAS.
- Y. Qiang, S. Zhang, L. Guo, X. Zheng, B. Xiang and S. Chen, Corros. Sci., 2017, 119, 68–78 CrossRef CAS.
- S. Mo, H. Q. Luo and N. B. Li, J. Colloid Interface Sci., 2017, 505, 929–939 CrossRef CAS PubMed.
- K. F. Khaled, J. Appl. Electrochem., 2010, 41, 277–287 CrossRef.
- H. Huang, Q. Yao, B. Liu, N. Shan and H. Chen, New J. Chem., 2017, 41, 12205–12217 RSC.
- M. A. Deyab, RSC Adv., 2018, 8, 20996–21001 RSC.
- S. Kumar, M. Goyal, H. Vashisht, V. Sharma, I. Bahadur and E. E. Ebenso, RSC Adv., 2017, 7, 31907–31920 RSC.
- Z. Z. Tasic, M. M. Antonijevic, M. B. Petrovic Mihajlovic and M. B. Radovanovic, J. Mol. Liq., 2016, 219, 463–473 CrossRef CAS.
- K. R. Ansari, M. A. Quraishi and A. Singh, Corros. Sci., 2014, 79, 5–15 CrossRef CAS.
- K. Stanly Jacob and G. Parameswaran, Corros. Sci., 2010, 52, 224–228 CrossRef CAS.
- B. Tan, S. Zhang, Y. Qiang, L. Guo, L. Feng, C. Liao, Y. Xu and S. Chen, J. Colloid Interface Sci., 2018, 526, 268–280 CrossRef CAS PubMed.
- M. A. Deyab, M. T. Zaky and M. I. Nessim, J. Mol. Liq., 2017, 229, 396–404 CrossRef CAS.
- B. Tan, S. Zhang, Y. Qiang, L. Feng, C. Liao, Y. Xu and S. Chen, J. Mol. Liq., 2017, 248, 902–910 CrossRef CAS.
- A. Ehsani, M. G. Mahjani, M. Hosseini, R. Safari, R. Moshrefi and H. Mohammad Shiri, J. Colloid Interface Sci., 2017, 490, 444–451 CrossRef CAS PubMed.
- L. Feng, H. Yang, X. Cui, D. Chen and G. Li, RSC Adv., 2018, 8, 6507–6518 RSC.
- N. Labjar, M. Lebrini, F. Bentiss, N.-E. Chihib, S. E. Hajjaji and C. Jama, Mater. Chem. Phys., 2010, 119, 330–336 CrossRef CAS.
- M. T. Alhaffar, S. A. Umoren, I. B. Obot and S. A. Ali, RSC Adv., 2018, 8, 1764–1777 RSC.
- Y. Qiang, S. Zhang, S. Xu and L. Yin, RSC Adv., 2015, 5, 63866–63873 RSC.
- R. K. Gupta, M. Malviya, C. Verma, N. K. Gupta and M. A. Quraishi, RSC Adv., 2017, 7, 39063–39074 RSC.
- B. J. Usman, S. A. Umoren and Z. M. Gasem, J. Mol. Liq., 2017, 237, 146–156 CrossRef CAS.
- M. A. Azaroual, E. F. El Harrak, R. Touir, A. Rochdi and M. E. Touhami, J. Mol. Liq., 2016, 220, 549–557 CrossRef CAS.
- L. Liao, S. Mo, H. Luo and N. Li, J. Colloid Interface Sci., 2018, 520, 41–49 CrossRef CAS PubMed.
- N. K. Gupta, C. Verma, R. Salghi, H. Lgaz, A. K. Mukherjee and M. A. Quraishi, New J. Chem., 2017, 41, 13114–13129 RSC.
- L. Liao, S. Mo, J. Lei, H. Luo and N. Li, J. Colloid Interface Sci., 2016, 474, 68–77 CrossRef CAS PubMed.
- Z. Zhang, F. Wang, Y. Liu, S. Wu, W. Li, W. Sun, D. Guo and J. Jiang, RSC Adv., 2018, 8, 20648–20654 RSC.
- A. E.-A. S. Fouda, S. E.-D. H. Etaiw, M. M. El-bendary and M. M. Maher, J. Mol. Liq., 2016, 213, 228–234 CrossRef CAS.
- J. Haque, V. Srivastava, C. Verma and M. A. Quraishi, J. Mol. Liq., 2017, 225, 848–855 CrossRef CAS.
- H. S. Gadow, M. M. Motawea and H. M. Elabbasy, RSC Adv., 2017, 7, 29883–29898 RSC.
- Y. Wang, Y. Zuo, X. Zhao and S. Zha, Appl. Surf. Sci., 2016, 379, 98–110 CrossRef CAS.
- S. Hari Kumar and S. Karthikeyan, Ind. Eng. Chem. Res., 2013, 52, 7457–7469 CrossRef CAS.
- Sudheer and M. A. Quraishi, Ind. Eng. Chem. Res., 2014, 53, 2851–2859 CrossRef CAS.
- H. K. Sappani and S. Karthikeyan, Ind. Eng. Chem. Res., 2014, 53, 3415–3425 CrossRef CAS.
- I. Jevremović, M. Singer, S. Nešić and V. Mišković-Stanković, Corros. Sci., 2013, 77, 265–272 CrossRef.
- B. Zhang, C. He, X. Chen, Z. Tian and F. Li, Corros. Sci., 2015, 90, 585–596 CrossRef CAS.
- G. Ji, S. Anjum, S. Sundaram and R. Prakash, Corros. Sci., 2015, 90, 107–117 CrossRef CAS.
- Y. Qiang, S. Zhang, S. Yan, X. Zou and S. Chen, Corros. Sci., 2017, 126, 295–304 CrossRef CAS.
- L. Guo, S. Zhu, S. Zhang, Q. He and W. Li, Corros. Sci., 2014, 87, 366–375 CrossRef CAS.
- Y. Qiang, S. Zhang, B. Tan and S. Chen, Corros. Sci., 2018, 133, 6–16 CrossRef CAS.
- Y. Yu, D. Yang, D. Zhang, Y. Wang and L. Gao, Appl. Surf. Sci., 2017, 392, 768–776 CrossRef CAS.
- M. A. Deyab, M. M. Osman, A. E. Elkholy and F. El-Taib Heakal, RSC Adv., 2017, 7, 45241–45251 RSC.
|
| This journal is © The Royal Society of Chemistry 2018 |
Click here to see how this site uses Cookies. View our privacy policy here.  Open Access Article
 *,
Shini Peng,
Zhili Gong and
Jie Chen


![[thin space (1/6-em)]](https://www.rsc.org/images/entities/char_2009.gif) Kads vs. 1/T to obtain a straight line is appeared in Fig. 6. The thermodynamic parameters, such as ΔH0ads, ΔS0ads, ΔG0ads and Kads, are presented in Table 4. In generally, the large value of Kads and the small value of ΔG0ads indicate that the HOAT can compactly adsorb on the steel surface, effectively restrain mild steel corrosion. As shown in Table 4, it can be found that the Kads values decreases and the ΔG0ads values increases with temperature augment, which means that decreases of corrosion inhibition ability of HOAT for steel in H2SO4 with increasing temperatures. This phenomenon is attributed to the fact that thermal excursions between molecules with increasing temperature are not conducive to the HOAT adsorption on surface of steel. In addition, the value of ΔG0ads is between −31 and −33 kJ mol−1, so it can be considered that the HOAT adsorption on the surface of steel is mainly based on physical and chemical adsorption.48 In addition, ΔH0ads is −25.69 kJ mol−1, which indicates that the HOAT adsorption on the surface of steel is an exothermic process.11 ΔS0ads are approximately between −24 and −26 J k−1 mol−1, indicating HOAT lose its translation freedom when adsorption on the steel.32
Kads vs. 1/T to obtain a straight line is appeared in Fig. 6. The thermodynamic parameters, such as ΔH0ads, ΔS0ads, ΔG0ads and Kads, are presented in Table 4. In generally, the large value of Kads and the small value of ΔG0ads indicate that the HOAT can compactly adsorb on the steel surface, effectively restrain mild steel corrosion. As shown in Table 4, it can be found that the Kads values decreases and the ΔG0ads values increases with temperature augment, which means that decreases of corrosion inhibition ability of HOAT for steel in H2SO4 with increasing temperatures. This phenomenon is attributed to the fact that thermal excursions between molecules with increasing temperature are not conducive to the HOAT adsorption on surface of steel. In addition, the value of ΔG0ads is between −31 and −33 kJ mol−1, so it can be considered that the HOAT adsorption on the surface of steel is mainly based on physical and chemical adsorption.48 In addition, ΔH0ads is −25.69 kJ mol−1, which indicates that the HOAT adsorption on the surface of steel is an exothermic process.11 ΔS0ads are approximately between −24 and −26 J k−1 mol−1, indicating HOAT lose its translation freedom when adsorption on the steel.32
![[thin space (1/6-em)]](https://www.rsc.org/images/entities/char_2009.gif) Kads and 1/T for mild steel at 1 M H2SO4 containing different concentrations of HOAT.
Kads and 1/T for mild steel at 1 M H2SO4 containing different concentrations of HOAT.

![[thin space (1/6-em)]](https://www.rsc.org/images/entities/char_2009.gif) v vs. 1/T presented in Fig. 7. Moreover, the ln(v/T) vs. 1/T presented in Fig. 8. The relevant kinetic parameters, Ea, ΔHa and ΔSa, are calculated via formulas (13) and (14).
v vs. 1/T presented in Fig. 7. Moreover, the ln(v/T) vs. 1/T presented in Fig. 8. The relevant kinetic parameters, Ea, ΔHa and ΔSa, are calculated via formulas (13) and (14).


