 Open Access Article
Effects of proton conduction on dielectric properties of peptides†
Taehoon Sungab,
Seok Daniel Namgungab,
Jaehun Lee c,
Ik Rang Choec,
Ki Tae Nam
 *c and
Jang-Yeon Kwon
 *ab
*ab
aSchool of Integrated Technology, Yonsei University, Incheon 21983, Republic of Korea
bYonsei Institute of Convergence Technology, Yonsei University, Incheon 21983, Republic of Korea. E-mail: jangyeon@yonsei.ac.kr
cDepartment of Materials Science and Engineering, Seoul National University, Seoul 08826, Republic of Korea. E-mail: nkitae@snu.ac.kr
First published on 3rd October 2018
Abstract
Peptides have been overlooked for their use in the field of electronics, even though they are one of the most commonly found bio-induced materials, and are not only easy to mass-produce but also exhibit a high dielectric constant. Additionally, unlike proteins, which are gaining considerable interest with materials researchers, peptides are much simpler, rendering their original characteristics easier to maintain without significant alteration of their structure. On the other hand, proteins tend to deform due to their susceptibility to environmental changes. Combining such superb dielectric properties with their relatively stable nature, peptides could be utilized as a component of electronic devices ranging from basic capacitors to more complex thin-film transistors. In this paper, a peptide chain (YYACAYY) composed of tyrosine, alanine, and cysteine was extensively studied using an impedance analyzer to determine its innate charge movement mechanism in order to extend our understanding of the electric properties of peptides. The movement of mobile protons inside the peptide insulator was found to be the source of the high relative permittivity of the peptide insulator, and the dielectric constant of the peptide insulator was found to be over 17 in humid conditions. By widening the understanding of the dielectric properties of the peptide insulator, it is expected that the peptide can be further utilized as an insulator in various electronic devices.
1. Introduction
Recently, a growing interest has been shown in the use of bio-induced materials that include proteins and polysaccharides as components for electronic devices, and considerable progress has been made in this area.1–4 For example, as a bio-induced material, many previous researchers have suggested using various types of proteins, and this has attracted interest in the areas of both material science and electronics, with promising results exhibited.Similar to the proteins that are used extensively as bio-induced materials, peptides serve as a building block in many natural organic systems. The various types of bonding exhibited by proteins and peptides make them available for advanced chemical, mechanical, and especially, electrical properties.
One interesting electrical property of peptides is proton conductivity. Although it has been reported that peptides have high proton conductivity,5,6 most earlier research on the proton conduction of bio-molecules was carried out at the molecular level, and mostly focused on revealing the underlying proton conduction mechanism of the molecules.7 Additionally, recent research on the bulk protonic conduction found in most bio-molecules demonstrates that such bio-molecules exhibit proton conductivity,6,8–11 although little effort has been made in utilizing the proton conductivity in actual electronic devices.
Therefore, this paper focuses on studying the dielectric property of the suggested peptide molecules with respect to their proton conductivity, and on the applicability of the peptide as a dielectric layer that can be utilized in many different types of electronic devices.
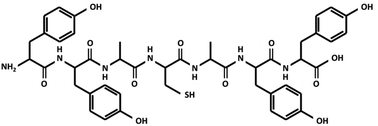
The peptide chain (YYACAYY) used in this research is composed of tyrosine (Y), alanine (A), and cysteine (C), as shown in Fig. 1. This specific peptide sequence contains functional groups, including –OH, –COOH, –NH2, and –SH, which are known to be hydrophilic and to exhibit good ionic conductivity.12,13 There are few amino acids that take critical role in proton conduction in biological systems. Especially, amino acids with phenol groups, for example tyrosine, are known to be an important constituents that construct proton-coupled electron transfer observable in ribonucleotide reductase14 and photosystem II15 in association with inorganic clusters. In addition, tyrosine is a precursor of eumelanins,16 which exhibit humidity-dependent high proton conductivity. Such protonic conductivity is due to the absorption of water molecules introduced to the peptide film from the ambient atmosphere.5,10,17 Furthermore, the absorbed water molecules constitute a hydrogen bond network, where protons may easily hop from one place to another as described by the Grotthuss mechanism,11,18,19 and the proton conductivity present inside the peptide may enhance the dielectric properties of the peptide, since protons, which cannot pass through metal electrodes, may form an electrical double layer (EDL) at the interface, therefore increasing the relative permittivity of the material.20
Additionally, unlike proteins that are susceptible to environmental changes due to their complex bonding and structure, the peptides remain fairly stable during conventional device-fabrication processes, which often induce heat and relatively strong organic solvents. Furthermore, short-chain peptides are relatively small and stable molecules that are easier to synthesize with well-known processes.21 Also, the specific peptide sequence used in this research can be formed into a large-area film and its resistivity can easily be tuned.22,23 Such flexibility of the peptide sequence is expected to be helpful in future research, as the mechanical and electrical properties of the peptide can be altered in researcher's favor.
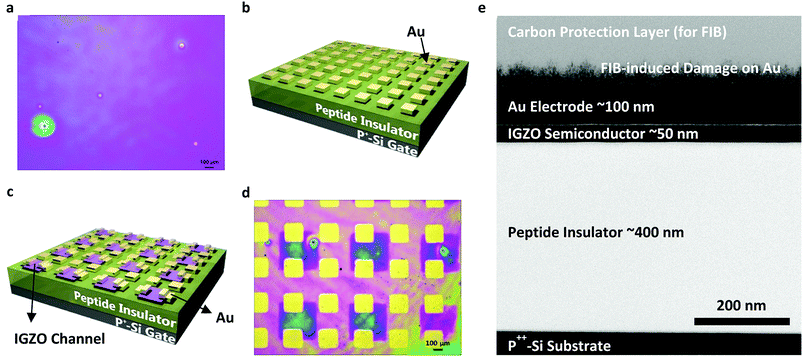
To ease the fabrication process and to prove that this peptide insulator can be integrated into conventional electronic devices, conventional thin-film fabrication methods such as spin-coating, sputtering, and evaporating techniques were utilized in the fabrication of the test samples. The 3-D schematics and microscopic images of the fabricated devices are shown in Fig. 2. Fig. 2b shows the 3-D schematics of the metal-insulator-metal (MIM) samples that are used in the impedance and breakdown analyses, while Fig. 2c shows the schematics of the Thin Film Transistor (TFT) samples that are fabricated with an In-Ga-Zn-O (IGZO) active layer and a peptide insulator. From the optical microscopic image in Fig. 2d and the side-view using Transmission Electron Microscopy (TEM) in Fig. 2e, successful fabrication of the TFT samples was confirmed.
Using the fabricated MIM and TFT samples, the peptides were analyzed using various electronic analysis techniques involving an impedance analyzer and a semiconductor analyzer. From the analysis, the relative permittivity of the peptide insulator was found to be over 20 in humid conditions. In addition, the origin of the high relative permittivity and internal movement of the protons inside the peptide insulator could be examined, and the relationship between the protonic movement and the relative permittivity could be found.
Based on the understanding from studying the property of the peptide insulator, it could also be integrated into a functioning oxide TFT to illustrate the applicability of the peptide insulator. The resulting peptide-integrated TFT showed superior characteristics in terms of on-current and on–off ratio due to large dielectric constant of the peptide insulator. Combined with the understanding of the protonic movement reported in this paper, it is believed that the electrical property of the peptide insulator can be further enhanced to provide bio-induced high-k insulator that can be employed in many electronic applications.
2. Experimental
2.1. Sample preparation
In the case of the SiO2, 400 nm-thick Plasma-Enhanced Chemical Vapor Deposition (PE-CVD) SiO2 and 100 nm-thick thermally grown SiO2 were used for the MIM and TFT samples, respectively. Since the capacitance is greatly influenced by the thickness of the insulator, SiO2 with the same thickness as the peptide insulator was utilized during impedance analysis. However, in order to discount the effect of annealing process on the TFT samples, neither the peptide TFT nor the reference SiO2 TFT were annealed. Therefore, thermally grown SiO2 with better characteristics was used instead of the same-thickness PE-CVD SiO2 to optimize the performance of the reference SiO2 TFT.
For the 400 nm-thick PE-CVD SiO2, the Radio Frequency (RF) power was set as 100 W at 300 °C under 950 mTorr, with gas flow rates of 30 sccm, 100 sccm, and 100 sccm for SiH4, N2O, and Ar, respectively. The refractive index was measured from an ellipsometer as 1.451.
For the 100 nm-thick thermally grown SiO2, pre-fabricated 100 nm-thick thermally grown oxides on a P++-Si substrate were used, which were produced from Dasom RMS in South Korea.
2.2. Characterization
3. Results & discussion
3.1. Impedance analysis
As the first part of the experiment, the impedance analyzer was utilized to measure the impedance in terms of the capacitance and phase angle, as well as the real and imaginary impedance of the peptide insulator under various alternating current (AC) perturbation frequency and RH conditions to understand the conduction mechanism of the peptides.24 From the results of impedance analysis, the true nature of the mobile charges that reside inside the peptide insulator were expected to be discovered,25 and based on the understanding on the movement of mobile charges, the source of the high relative permittivity of the peptides in relation to the protonic behavior can be studied.20This section analyzes the Metal-Insulator-Metal (MIM) samples, which are composed of an insulator layer sandwiched between the top and the bottom electrodes. Since the MIM samples are basically parallel-plate capacitors, the capacitance of the peptide insulator was measured first by changing both the RH conditions and the frequency of AC perturbation. The AC perturbation is an AC signal superimposed on the direct current (DC) signal and is usually in the range of less than 1 V. By altering the relative electric potential of the top and bottom electrodes, the AC perturbation causes mobile charges to move in and out of the capacitor. Also, by measuring the number of charges that respond, the capacitance can be measured.
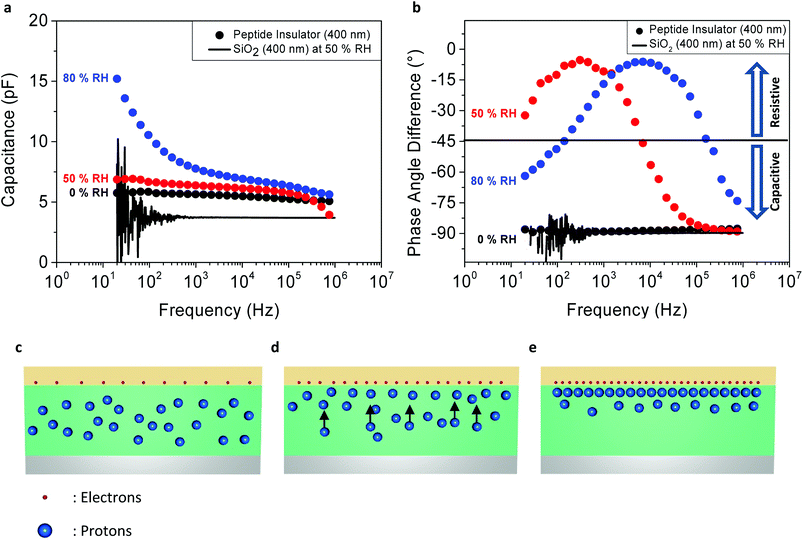
Fig. 3a shows the relationship between the capacitance of the peptide insulator and the frequency of AC perturbation. The level of AC perturbation was 500 mV, and the DC bias was set at −1 V. From the capacitance–frequency curves of the peptide insulator measured at the RH level of 50% and 80%, it is found that the capacitance of the peptide insulator increased as the AC frequency decreased and as the humidity level increased. On the other hand, the capacitance of the peptide insulator measured at the RH level of 0% and the reference SiO2 MIM sample with the dielectric thickness of 400 nm remain relatively constant under the entire frequency range. The corresponding dielectric constants of the peptide insulator at 20 Hz for 0% RH, 50% RH and 80% RH conditions are 6.5, 7.8 and 17.2, respectively.
Also, in Fig. 3b, the graph shows the relationship between the phase angle difference and the frequency of AC perturbation. From the curves of the peptide insulator measured at 50% RH and 80% RH, the phase angle difference between the voltage and the current of the peptide capacitor showed both capacitive and resistive behaviors, since the ideal resistor shows a phase angle difference of 0° and the ideal capacitor shows a phase angle difference of 90°.26
By combining the results shown in Fig. 3a and b, this changing behavior can be further explained by detailed analysis on the movement of the mobile charges inside the peptide insulator.
At a high frequency range, only the electrons have sufficient mobility to react to fast-changing AC perturbation and form capacitance, while the protons barely shift their positions due to their lower mobility than that of the electrons, as shown in the diagram in Fig. 3c. This results in the capacitive behavior shown in Fig. 3b, since the movement of protons, or the protonic current (which shows resistive behavior) is minimized.
At a medium frequency range, the protons start responding to the AC perturbation, since the polarity of the electrical field changes to a slower speed compared to the high frequency range, and the protonic current flows inside the peptide insulator, as shown in Fig. 3d. However, the AC perturbation is still sufficiently fast to prevent a large portion of the protons from forming capacitance. Therefore, based on the polarity of the electrical field induced by the AC perturbation, the majority of protons continuously move vertically up and down inside the peptide insulator. Since the protonic current has dissipative characteristics, it appears as a resistive term in the phase angle difference plot in Fig. 3b.
Lastly, at low frequency range, since the protons now have a sufficient time period between the polarity shifts of the AC perturbation, the protons start contributing more to the formation of the EDL at the top or the bottom interfaces between the peptide insulator and the electrodes, by being pushed to one side of the electrodes. Their positions are thus maintained until the polarity of the AC perturbation changes and the AC perturbation exerts a sufficient opposite directional electric force to inversely push the protons to the other electrode, as shown in Fig. 3e.
In addition, the RH dependency of the resistive and capacitive behaviors can be observed in both Fig. 3a and b. As mentioned above, the peptide insulator may show capacitive or resistive behavior, depending on the frequency of AC perturbation and the amount of protons that react to the AC perturbation. By comparing the curves of the peptide insulator under different humidity conditions, as shown in Fig. 3b, it was found that the peptide insulator measured in a higher humidity condition exhibits more resistive behavior, implying that larger protonic current flows at the same AC frequency than the peptide insulator measured in the lower humidity condition. For example, at 104 Hz shown in Fig. 3b, the peptide insulator under 80% RH shows a phase angle difference of nearly 0°, where that of the peptide insulator under 50% RH is approximately −45°, and nearly −90° for the peptide insulator under 0% RH.
Since proton mobility is mostly affected by the fraction of absorbed water molecules that function as bridges for the protons to move around in the medium, the peptide insulator exhibits higher proton mobility at 80% RH, which induces the protons inside the peptide insulator to start responding to the AC perturbation, even at higher frequency, compared to the proton mobility at 50% RH; ultimately, very diminished protonic movements at 0% RH can be inferred from the graph.
Similar to the behavior of the peptide insulator at 0% RH, the reference sample with the SiO2 insulator behaves only as a capacitor, even at 50% RH, where its phase angle difference remains at −90° for the entire frequency range. This is because the protonic conductivity of SiO2 is much less than that of the peptide insulator. This result suggests that both the electrons and the protons contribute to the formation of overall capacitance in the peptide insulator.
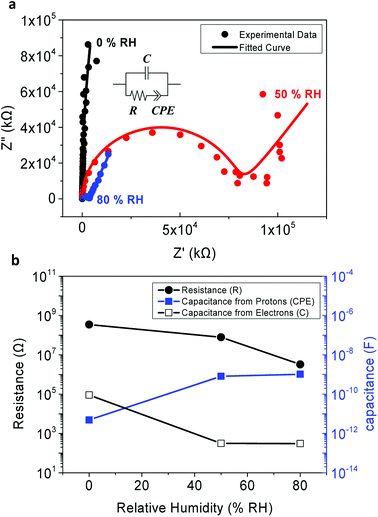
In this equivalent circuit, the capacitance formed due to the electrons at each electrode was represented as the “C” term, and the resistance formed due to the flow of protons and electrons was represented as the “R” term. The electrical double layer formed by the protons at the interface between the peptide insulator and electrodes was represented by a constant phase element (CPE) term due to its non-perfect and dissipative nature.20,28
In the experimental results represented as dots in Fig. 4a, a semicircle and low-frequency tail was observed. This is a commonly observed behavior as protons are blocked at the electrodes,5,12 since the top and the bottom electrodes of the MIM samples were fabricated using Au and highly-doped p-type Si, respectively, which are not proton-conducting materials.
From the simulated results, it was found that the phases of the CPE terms are 0.641 and 0.747 for RH 50% and RH 80% respectively. This demonstrates the dissipative property of each EDL, resulting in the slanted low-frequency tail. Also, note that the radius of each semi-circle differs with respect to the value of the resistivity. A larger resistance implies a larger radius of the semi-circle.8 Unfortunately, due to the detection limit of our equipment, a full complex plain impedance plot of the peptide insulator at 0% RH was not achievable, since the peptide insulator showed very high resistance at the RH level of 0%.
As shown in Fig. 4a, the fitted curve with the equivalent circuits agreed well with the experimental data, and such coherence implies that our equivalent circuits have accurately modeled charge movements in the peptide insulator. Therefore, it was concluded that the mobile protons, which tend to accumulate at the surface of the blocking electrode, reside inside the peptide insulator, and the protons are the main causes of the high relative permittivity of the peptide insulator.
Additionally, as shown in Fig. 4b, the tendency of increasing capacitance with respect to the increasing humidity condition, as previously observed in Fig. 3a, was again confirmed from the simulated R, C, and CPE values from the equivalent circuits. Especially, the capacitance due to electrons, which is represented by the C term, showed a decreasing tendency as the humidity level increased. It is believed that this is due to the increased level of leakage current which prohibits the electrons from accumulating at each side of the electrodes. Instead, the electrons further dissipate into the electrodes from the insulator or vice versa as the humidity level increases. On the other hand, the capacitance due to EDL formed by protons, which is represented as the CPE term, increased with increased level of humidity condition. As discussed earlier in the results of capacitance and phase angle measurement, this behavior can be explained by considering the increased proton conductivity at the higher humidity condition.
Since the CPE terms in the 50% RH and 80% RH conditions are greater than the C term by at least 3 orders of magnitude, it is safe to conclude that the formation of EDL by protons is the source of the high relative permittivity of the peptide insulators.
After discovering the origin of the high relative permittivity of the peptide insulator, the dielectric strength and resistivity of the peptide insulator were analyzed to determine the applicability of the peptide insulator in electronic devices.
3.2. Dielectric strength and resistivity
Before integrating the peptide insulator in the TFT samples, the leakage current and voltage of the induced electrical field were measured from the MIM samples to confirm that the peptide has suitable resistivity and dielectric strength to be utilized as an insulator.In Fig. 5a, current density is shown as a function of a vertical DC electrical field induced on the peptide MIM samples. The breakdown voltage is the maximum level of electric potential difference between the top and the bottom electrodes that insulators can withstand before letting the current pass through, and is often used to represent the dielectric strength of an insulator.
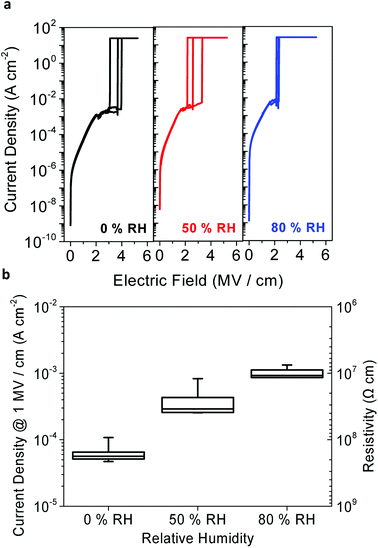 | ||
| Fig. 5 Dielectric strength and resistivity of the peptide insulator. (a) Breakdown curves and (b) current density graph of the peptide insulator under various RH conditions. | ||
The median of the electrical breakdown voltage was observed at 3.7 MV cm−1, 2.6 MV cm−1, and 2.15 MV cm−1 for 0% RH, 50% RH, and 80% RH, respectively. Of the ten measurements, the three curves that were closest to the median value of the electrical breakdown voltage were chosen, as shown in Fig. 5a, for each humidity level to enhance the graphical representation of the result. Such degradation of the dielectric strength in the peptide insulator at higher humidity levels is typical, and has been well explained in many other studies.29–31
Fig. 5b shows the current density and resistivity of the ten measurements for each humidity level. The current density can be converted to resistivity, and the subsequent resistivity is shown on the right axis in Fig. 5b. In terms of the leakage current, the peptide insulator exhibited relatively higher leakage current, which varied from around 10−4 A cm−2 to 10−3 A cm−2 according to the RH conditions, compared to that of the reference SiO2 insulator, which was around 10−8 A cm−2. It is significant that the resistivity of the peptide insulator decreased at higher humidity levels, indicating that the electrical conductivity of the peptide insulator increased as the RH increased. Also, this result supports the simulation result shown in Fig. 4b, where the resistance represented by the R term decreased with increased humidity level. This is possibly because the water molecules enhance not only the proton conduction, but also the electronic conduction.5
Since the peptide insulator with the thickness of 400 nm withstood at least 80 V, which is equal to 2 MV cm−1, and showed a resistivity larger than 107 Ω cm, it can be concluded that the peptide meets our expectation and functions as an insulator. Based on the confirmation that the peptide has a sufficiently large dielectric strength, the peptide insulator was deemed ready to be incorporated into an actual electronic device; for example, the TFT incorporated with the peptide insulator was tested.
3.3. TFT characteristics
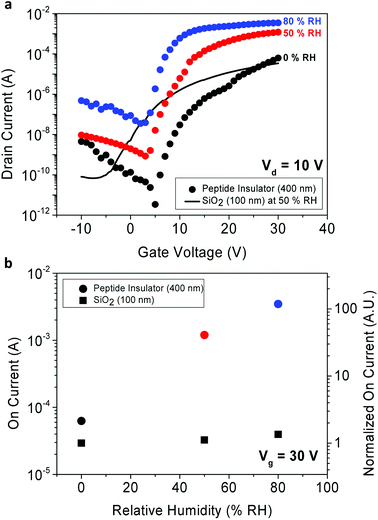
The 3-D schematics, optical microscopic image, and transmission electron microscopy (TEM) cross-sectional image of the TFT fabricated as a possible application for the peptide insulator are shown in Fig. 2c–e, respectively.The transfer curve is often used to characterize the performance of TFT by plotting the drain current as a function of gate voltage. From the transfer curves, device parameters were extracted and summarized in Table 1.
| Insulator | SiO2 | Peptide | ||
|---|---|---|---|---|
| a *Calculation of the mobility of the peptide-incorporated TFT was unable due to absence of the peptide's quasi-static capacitance. | ||||
| Humidity | 50% RH | 0% RH | 50% RH | 80% RH |
| Ion (A) | 3.4 × 10⁻⁵ | 6.3 × 10⁻⁵ | 1.2 × 10⁻³ | 3.5 × 10⁻³ |
| Ioff (A) | 6.8 × 10⁻¹¹ | 2.2 × 10⁻¹² | 8.3 × 10⁻¹⁰ | 2.9 × 10⁻⁸ |
| Ion/Ioff | 5.0 × 10⁻⁵ | 2.9 × 10⁻⁷ | 1.4 × 10⁻⁶ | 1.2 × 10⁻⁵ |
| Mobility (cm2 V−1 s−1)* | 3.01 | |||
| Vth (V) | 4.75 | 21.76 | 9.82 | 6.18 |
| Subthreshold swing (dec V−1) | 0.53 | 4.24 | 1.67 | 2.40 |
Due to absence of the peptide's quasi-static capacitance data, the mobility of the peptide-incorporated TFT was unobtainable, unfortunately. Still, comparison to the reference TFT with other parameters was able to be made. In terms of the subthreshold swing, the peptide TFT exhibited higher value compared to the reference TFT, and it was expected as the capacitance per unit area (Ci) of the peptide insulator is larger than that of the reference SiO2 owing to its huge dielectric constant. It is also notable that the threshold voltage (Vth) of the peptide TFT shifts to more positive way as the RH decreases. This is probably due to charge trapping that occurs at the interface between the IGZO and the peptide insulator, and requires further study to find its origin.
Additionally, by comparing the performance between the peptide TFT and the reference SiO2 TFT in terms of the on-current and off-current levels, the on-current enhancement due to increased relative permittivity of the peptide insulator was confirmed. As shown in Fig. 6a, the large relative permittivity of the peptide insulator significantly enhanced the on-current of the peptide TFT. In Fig. 6b, the on-current values from the TFTs are shown and normalized with respect to the on current of the SiO2 TFT in 0% RH. The on-current of the peptide TFT was greater than that of the SiO2 TFT by 1.9 times, 35 times, and 102 times at the RH of 0%, 50%, and 80%, respectively. Additionally, it is important to note that the SiO2 used in the reference sample was thermally grown with the thickness of 100 nm, which is 1/4 of the thickness of the peptide insulator. It is believed that the peptide insulator can be utilized in many applications, such as displays or sensors to enhance the performance of the transistors by increasing their capacitance significantly. In addition, the off-current also increased as the RH increased.
This tendency was illustrated in our earlier discussion about Fig. 5b, which showed the decreased resistivity of the peptide insulator in higher RH conditions. As shown in Fig. 6b, due to the increase in the off-current level in higher RH conditions, the on–off ratio decreased from 2.9 × 10⁷ at 0% RH to 1.4 × 10⁶ at 50% RH, and to 1.2 × 10⁵ at 80% RH. Even though both the on and off-current were increased, the on–off ratio of the peptide TFT exhibited a higher or similar value compared to that of the reference sample, which was 5.1 × 10⁵ at 50% RH; this is due to the considerably increased on-current level of the peptide TFT.
Additionally, in Table 2, the performance of the insulator and the peptide-incorporated TFT can be compared with the TFTs that used different conventional inorganic and organic insulator and channel materials. The peptide insulator showed the highest dielectric constant among different types of insulators and the TFT performance in terms of the on–off ratio was superior than the organic insulators while comparable to the inorganic insulators.
| Dielectric material | Casting method | Ci (nF cm−2) | Thickness (nm) | Dielectric constant | Semiconductor | Mobility (cm2 V−1 s−1) | Ion/Ioff | Reference | |
|---|---|---|---|---|---|---|---|---|---|
| a Pentacene was utilized as a p-type semiconductor.b C60 was utilized as an n-type semiconductor.c Value varies according to the relative humidity. Numbers written on the right side of the dash is the value from the RH 80% condition. | |||||||||
| Inorganic | SiO2 | PE-CVD | 28.8 | 120 | IGZO | 16.9 | ∼109 | 32 | |
| SiO2 | Thermally grown | 21.5 | 148 | IGZO | 4.1 | ∼106 | 33 | ||
| Al2O3 | Anodization | 54 | 140 | 8.7 | IGZO | 21.6 | ∼108 | ||
| Organic | CYPEL | Spin-coating | 8.9 | 1200 | 12 | P3BT | 0.04 | 34 | |
| PVP | 5.6 | 900 | 5 | 0.0002 | |||||
| PVA | 17.8 | 500 | 10 | 0.03–0.003 | |||||
| Chicken albumen | Spin-coating | 12.5–13.3 | 400 | 5.3–6.1 | Pentacenea | 0.09 | 104 | 1 | |
| C60b | 0.13 | ||||||||
| Silk fibroin | Spin-coating | 12.8–17.5 | 30 | 6.1 | Pentacene | 23.2 | 3 × 10⁴ | 35 | |
| YYACAYY | Spin-coating | 15–38c | 400 | 6.5–17.2c | IGZO | 2.9 × 10⁷–1.2 × 10⁵c | |||
Since the transfer curves of the peptide TFT samples showed switching characteristics with the on–off ratio of over 105 in all of the RH conditions, it can be concluded that the peptide insulator is successfully incorporated into the conventional IGZO TFT, and can be further utilized as a superior bio-induced dielectric material in conjunction with organic or even conventional inorganic electronic materials.
4. Conclusion
In conclusion, the peptide insulator was studied extensively to find the source of high relative permittivity. It was proven that the electrolytic behavior of the peptide insulator due to proton conduction is the major source of high relative permittivity. Although the peptide insulator suffers from relatively high leakage current and low dielectric constant at high frequency, a promising result was achieved by incorporating the peptide insulator into an oxide TFT as an alternate gate insulator, where the on-current level of the TFT was enhanced drastically due to the high relative permittivity of the peptide insulator, with the verification on the compatibility of the peptide insulator with the conventional inorganic materials. The peptide insulator is expected to be further utilized as a gate dielectric for low-frequency and low-voltage operating devices, such as sensors, especially in conjunction with the aforementioned film-forming technology22 and further tuning of its chemical characteristics, as well as the electrical characteristics.Conflicts of interest
The authors have no conflicts of interest to declare.Acknowledgements
This work was supported by the Samsung Research Funding Center of Samsung Electronics under Project Number SRFC-MA1401-51.Notes and references
- J. W. Chang, C. G. Wang, C. Y. Huang, T. D. Tsai, T. F. Guo and T. C. Wen, Adv. Mater., 2011, 23, 4077–4081 CrossRef CAS PubMed.
- M. Ambrico, P. F. Ambrico, A. Cardone, T. Ligonzo, S. R. Cicco, R. D. Mundo, V. Augelli and G. M. Farinola, Adv. Mater., 2011, 23, 3332–3336 CrossRef CAS PubMed.
- M. Irimia-Vladu, N. S. Sariciftci and S. Bauer, J. Mater. Chem., 2011, 21, 1350–1361 RSC.
- R. Capelli, J. J. Amsden, G. Generali, S. Toffanin, V. Benfenati, M. Muccini, D. L. Kaplan, F. G. Omenetto and R. Zamboni, Org. Electron., 2011, 12, 1146–1151 CrossRef CAS PubMed.
- J. Lee, I. R. Choe, Y. O. Kim, S. D. Namgung, K. Jin, H. Y. Ahn, T. Sung, J. Y. Kwon, Y. S. Lee and K. T. Nam, Advanced Functional Materials, 2017 Search PubMed.
- M. Amit, S. Appel, R. Cohen, G. Cheng, I. W. Hamley and N. Ashkenasy, Adv. Funct. Mater., 2014, 24, 5873–5880 CrossRef CAS.
- T. J. Peckham, J. Schmeisser and S. Holdcroft, J. Phys. Chem. B, 2008, 112, 2848–2858 CrossRef CAS PubMed.
- D. D. Ordinario, L. Phan, W. G. Walkup IV, J.-M. Jocson, E. Karshalev, N. Hüsken and A. A. Gorodetsky, Nat. Chem., 2014, 6, 596 CrossRef CAS PubMed.
- J. Wünsche, Y. Deng, P. Kumar, E. Di Mauro, E. Josberger, J. Sayago, A. Pezzella, F. Soavi, F. Cicoira and M. Rolandi, Chem. Mater., 2015, 27, 436–442 CrossRef.
- P. Gascoyne, R. Pethig and A. Szent-Györgyi, Proc. Natl. Acad. Sci., 1981, 78, 261–265 CrossRef CAS.
- C. Zhong, Y. Deng, A. F. Roudsari, A. Kapetanovic, M. Anantram and M. Rolandi, Nat. Commun., 2011, 2, ncomms1489 Search PubMed.
- G. Wu, P. Feng, X. Wan, L. Zhu, Y. Shi and Q. Wan, Artificial Synaptic Devices Based on Natural Chicken Albumen Coupled Electric-Double-Layer Transistors, 2016 Search PubMed.
- S. Kelkar, K. Pandey, S. Agarkar, N. Saikhedkar, M. Tathavadekar, I. Agrawal, R. V. N. Gundloori and S. Ogale, ACS Sustainable Chem. Eng., 2014, 2, 2707–2714 CrossRef CAS.
- J. Stubbe, Curr. Opin. Chem. Biol., 2003, 7, 183–188 CrossRef CAS PubMed.
- V. K. Yachandra, K. Sauer and M. P. Klein, Chem. Rev., 1996, 96, 2927–2950 CrossRef CAS PubMed.
- P. A. Riley, Int. J. Biochem. Cell Biol., 1997, 29, 1235–1239 CrossRef CAS PubMed.
- H. Morgan, R. Pethig and G. Stevens, J. Phys. E: Sci. Instrum., 1986, 19, 80 CrossRef CAS.
- J. F. Nagle and S. Tristram-Nagle, J. Membr. Biol., 1983, 74, 1–14 CrossRef CAS PubMed.
- N. Agmon, Chem. Phys. Lett., 1995, 244, 456–462 CrossRef CAS.
- O. Larsson, E. Said, M. Berggren and X. Crispin, Adv. Funct. Mater., 2009, 19, 3334–3341 CrossRef CAS.
- R. B. Merrifield, J. Am. Chem. Soc., 1963, 85, 2149–2154 CrossRef CAS.
- H.-S. Jang, J.-H. Lee, Y.-S. Park, Y.-O. Kim, J. Park, T.-Y. Yang, K. Jin, J. Lee, S. Park and J. M. You, Nat. Commun., 2014, 5, 3665 CrossRef PubMed.
- S. D. Namgung, J. Lee, I. R. Choe, T. Sung, Y.-O. Kim, Y.-S. Lee, K. T. Nam and J.-Y. Kwon, APL Mater., 2017, 5, 086109 CrossRef.
- V. F. Lvovich, Impedance spectroscopy: applications to electrochemical and dielectric phenomena, John Wiley & Sons, 2012 Search PubMed.
- R. A. Huggins, Ionics, 2002, 8, 300–313 CrossRef CAS.
- S. Herman, Delmar's standard textbook of electricity, Nelson Education, 2014 Search PubMed.
- D. K. Paul, R. McCreery and K. Karan, J. Electrochem. Soc., 2014, 161, F1395–F1402 CrossRef CAS.
- P. Zoltowski, J. Electroanal. Chem., 1998, 443, 149–154 CrossRef CAS.
- A. K. Jonscher, Universal relaxation law: a sequel to Dielectric relaxation in solids, Chelsea Dielectrics Press, 1996 Search PubMed.
- T. Kumazawa, M. Oishi and M. Todoki, IEEE Trans. Dielectr. Electr. Insul., 1994, 1, 133–138 CrossRef CAS.
- A. K. Jonscher, J. Phys. D: Appl. Phys., 1999, 32, R57 CrossRef CAS.
- K. H. Ji, J.-I. Kim, Y.-G. Mo, J. H. Jeong, S. Yang, C.-S. Hwang, S.-H. K. Park, M.-K. Ryu, S.-Y. Lee and J. K. Jeong, IEEE Electron Device Lett., 2010, 31, 1404–1406 CAS.
- L. Lan and J. Peng, High-Performance Indium–Gallium–Zinc Oxide Thin-Film Transistors Based on Anodic Aluminum Oxide, 2011 Search PubMed.
- R. Parashkov, E. Becker, G. Ginev, T. Riedl, H.-H. Johannes and W. Kowalsky, J. Appl. Phys., 2004, 95, 1594–1596 CrossRef CAS.
- C. H. Wang, C. Y. Hsieh and J. C. Hwang, Adv. Mater., 2011, 23, 1630–1634 CrossRef CAS PubMed.
Footnote |
| † Electronic supplementary information (ESI) available. See DOI: 10.1039/c8ra06121a |
| This journal is © The Royal Society of Chemistry 2018 |

