 Open Access Article
Study on adsorption of methylene blue by a novel composite material of TiO2 and alum sludge
Yani Geng *ab,
Jun Zhangabc,
Jinhong Zhouab and
Ji Leiab
aCollege of Geography and Environment, Baoji University of Arts and Sciences, Baoji 721013, P. R. China
bShaanxi Key Laboratory of Disasters Monitoring and Mechanism Simulation, Baoji 721013, P. R. China. E-mail: gyn1977@126.com
cKey Laboratory of Subsurface Hydrology and Ecological Effect in Arid Region of Ministry of Education, Chang'an University, Xi'an 710054, China
First published on 21st September 2018
Abstract
A composite material of TiO2 and alum sludge (TiO2@AS) is reported in this paper. The samples of alum sludge (AS) and TiO2@AS were characterized using a field emission scanning electron microscope (FE-SEM), an energy dispersive spectrometer (EDS) and an Ultima IV X-ray diffractometer (XRD). In order to study the adsorption capacity and the adsorption mechanism of methylene blue by TiO2@AS in aqueous solution, three indexes — pH, adsorbent dosage and initial concentration of methylene blue — were investigated to evaluate the adsorption capacity of TiO2@AS. Moreover, thermodynamic, kinetic and isothermal model analyses of the adsorption process were carried out. The results showed that pH has little effect on the adsorption capacity. The maximum adsorption efficiency occurred at an optimized pH value of 11 for the aqueous solution. The adsorbed amount of methylene blue on TiO2@AS increased with the initial concentration of adsorbate and decreased with an increase in TiO2@AS dosage. The adsorption kinetics of methylene blue by TiO2@AS were in good agreement with the quasi-second-order kinetic model (R2 ≥ 0.9964), indicating that chemisorption is the main rate-controlling step. The Freundlich isotherm equation can best describe the experimental data (R2 = 0.9788). It is revealed that the adsorption is mainly multilayer adsorption. Because ΔG < 0 and ΔH > 0, the adsorption is a spontaneous endothermic process. Furthermore, the TiO2@AS can be regenerated under ultraviolet light, thus prolonging the service life of AS and facilitating a solution to the problem of adsorption plugging.
1 Introduction
AS is usually discharged as waste from the coagulation process in a water supply plant. It is considered cheap, easily obtainable, and environmentally friendly to utilize for the removal of pollutants from water.1–3 Initially, AS was used to remove dyes from dyeing wastewater.4 Moreover, a large amount of research focused on the use of AS to adsorb phosphate in water.5–11 Later, AS was successfully used for the adsorption of some inorganic substances, such as hexavalent chromium12 and fluoride ions13 in water. Duan et al.14 found that AS has a good adsorption effect on humic acid in water. Most studies on adsorption by AS focus only on the removal by adsorption of inorganic substances in water, and the removal of organic matter is rarely involved. Considering that the adsorption process is only a simple phase transfer of the material and cannot achieve the degradation of the pollutants,15 especially the degradation of organic pollutants in water, degradation can achieve a more thorough removal of pollutants. In addition, saturated adsorbents are normally difficult to regenerate, so adsorption capacity will be significantly reduced, resulting in the limited service life of the AS adsorbent. This is the main factor leading to the limitation of the service life of the AS sorbent. Zhao Xiaohong believes that the life of an AS filter used in constructed wetlands is 4 to17 years.16TiO2 presents many physical and chemical advantages, such as large surface area, large surface energy,17,18 good chemical stability, and photocatalytic reactions19,20 in natural light.21,22 However, suspended TiO2 is difficult to recycle and regenerate.23 Therefore, TiO2 may be immobilized on AS to create new materials. These new materials can better adsorb and degrade organic pollutants in water. Besides, these new materials are easily regenerated to improve their useful life. This provides new methods and new ideas for the removal of organic pollutants in water and for the improvement of water treatment technology.
Methylene blue is an organic compound widely added to chemical indicators,24–26 dyes and biological dyes, etc. In the dye wastewater, it is usually one of the most toxic substances27,28 discharged into natural water bodies, as it will affect the growth of plants and animals and threaten the safety of human drinking water, and is found in sewage, rivers and soils.29,30 Common methods for treating dye wastewater are biodegradation and physicochemical methods,31–34 but most of these are expensive and complicated. Therefore, finding new materials with low cost and high adsorption efficiency is necessary for the treatment of dye wastewater.
In this paper, a novel composite adsorbent, TiO2@alum sludge (TiO2@AS), was prepared using TiO2 loaded onto AS. Methylene blue was used as the treatment target, and the adsorption process and mechanism of TiO2@AS were analyzed by a study of adsorption-influencing factors, isothermal adsorption lines, adsorption kinetics and adsorption thermodynamics. The adsorption and regeneration capability of TiO2@AS were verified, which provided a theoretical basis for solving the problem of the plugging of AS filters in the sewage treatment process.
2 Materials and methods
2.1 Preparation of TiO2@AS
The AS (taken from the coagulation pool of a water plant in Baoji City) was dried, ground, and sieved through an 80–160 mesh. Thereafter, 5 g of treated AS and 2 g of TiO2 colloid (prepared by the sol–gel method35) were mixed in a crucible. Then the mixture was baked at 60 °C (40 min), placed in a muffle furnace and calcined (600 °C, 2 h) and cooled at room temperature to obtain TiO2@alum sludge (TiO2@AS).2.2 Adsorption experiments
The pH values of the test solutions were adjusted with concentrated hydrochloric acid and sodium hydroxide. The volume of methylene blue solution was 50 mL in the adsorption experiment. Adsorption reactions were performed in a shaker (25 °C, 250 rpm). At the end of the reaction, the sample was centrifuged (6000 rpm, 8 min) in a high-speed centrifuge (5810 R, Saiyataike), and the supernatant was taken to determine the concentration of residual methylene blue in the solution using a UV-Vis spectrophotometer (DR6000, Hash, USA) (665 nm).2.3 Data processing
Test data were measured using 3 replicates. All tests were conducted in a dark room except for the regeneration experiments.3 Results and discussion
3.1 The appearance of TiO2@AS
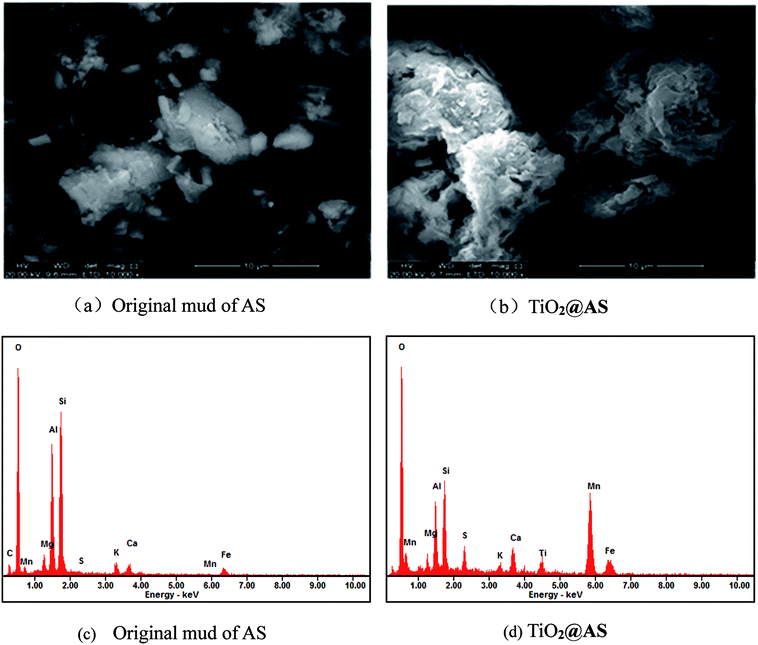
Scanning electron microscope photographs (SEM) and energy dispersive spectra (EDS) of AS and TiO2@AS samples are shown in Fig. 1Fig. 1(a) shows that the surface of the AS in a muffle furnace after being calcined at 600 °C for 2 h has a sheet-like structure, and the surface is dense with sporadic particulate matter. TiO2@AS has a relatively loose composite structure. The main body is AS, and there is a large amount of white granular material on its surface (Fig. 1(b)), indicating that TiO2 has been loaded onto the surface of AS. Meanwhile the AS surface still maintains a layered structure, and there are a lot of loose pores, indicating that there are still many vacancies on the surface of AS after loading with titanium dioxide, which can be used to adsorb organic pollutants in water.
The EDS diagrams of AS and TiO2@AS are shown in Fig. 1(c) and (d), respectively. It can be seen that the diffraction peak of Ti appears in Fig. 1(d) compared with Fig. 1(c), illustrating that TiO2 has been successfully loaded onto the original mud of AS.
3.2 Crystal structure of TiO2@AS
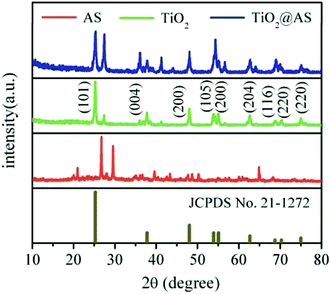
XRD patterns of AS, titanium dioxide, and TiO2@AS are shown in Fig. 2. It can be seen that the AS is in an amorphous state, and the main diffraction peaks correspond to quartz (SiO2), albite and calcium carbonate (see Fig. 2(a)). After loading with TiO2, as shown in Fig. 2(c), 9 new diffraction peaks appeared at 25.2°, 37.8°, 48.0°, 53.9°, 55.1°, 62.7°, 68.8°, 70.3°, and 75.0°. Comparing them with the JCPDS no. 21–1272 anatase titanium dioxide PDF card, these roughly correspond to the crystal planes (101), (004), (200), (105), (204), (116), and (220). This indicates that titanium dioxide has been loaded onto the AS and exists as an anatase crystal form.3.3 Influencing-factors experiment
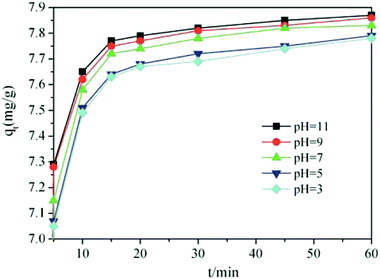
At different pH values, the TiO2@AS presented a good adsorption effect on methylene blue, and the adsorption capacities of the adsorbent were continuously strengthened with an increase in pH. When the pH value was 11, the adsorption capacity of TiO2@AS was the greatest and the adsorption rate reached 80%. The above phenomenon may be attributed to the different pHpzc values of TiO2 and the aluminum hydroxy compound being 6.1618 (ref. 36) and 8.5–9.5.7 When the pH of the solution is greater than the pHpzc of the adsorbent, the adsorbent is negatively charged, whereas the adsorbent surface is positive. However, the methylene blue molecule is cationic. And the capacity of methylene blue to be adsorbed by TiO2@AS was enhanced due to electrostatic attraction in alkaline conditions. Furthermore, the change in pH had little effect on the adsorption capacity.
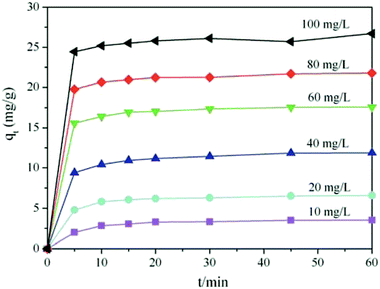
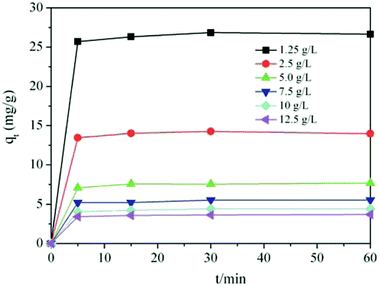
As shown in Fig. 4, the unit adsorption capacities of TiO2@AS increased with an increase in the concentration of methylene blue in the solution. The concentrations of methylene blue increased from 10 mg L−1 to 100 mg L−1, and the unit adsorption capacities of TiO2@AS increased from 10 mg g−1 to 25 mg g−1. In addition, the removal rate is above 88%. The above results show that the initial concentration of methylene blue is an important factor affecting the adsorption capacity of TiO2@AS. This may be because with an increase in the initial concentration of methylene blue, the adsorption sites on the surface of TiO2@AS were quickly surrounded by more methylene blue molecules, which improved the mass transfer rate of the adsorbate to the surface of the adsorbent, so the adsorption capacity of TiO2@AS was enhanced.
In addition, methylene blue was adsorbed rapidly by TiO2@AS at 0–10 min, the adsorption reached saturation at 5 min and adsorption equilibrium was achieved after 60 min. The time of adsorption equilibrium was independent of the initial concentration of the adsorbate. The adsorption process was roughly divided into 3 stages. The initial stage was 0–5 min, and the adsorption capability increased rapidly with time. At this point, this may be because TiO2@AS had a larger specific surface area, larger pores, and many adsorption vacancies on the surface. Moreover, the concentration of methylene blue in the solution was high. Therefore, the diffusion rate was high, and methylene blue molecules diffused rapidly to the surface of TiO2@AS to be adsorbed. Stage 2 was between 5 and 45 min. With the filling of TiO2@AS adsorption vacancies and a decrease in the concentration of the adsorbate in the external solvent, the adsorption rate slowed down, and the adsorption capability was gradually reduced. In the third stage (after 45 min), adsorption by TiO2@AS basically achieved equilibrium, the concentration of methylene blue in the external solvent was low, the adsorption rate was basically unchanged and the adsorption capability was basically unchanged, when the adsorption time was prolonged.
At the same time, the unit adsorption capability of TiO2@AS decreased with an increase in adsorbent dosage. When the adsorbent dosage was a minimum (1.25 g L−1), the adsorbent exhibited the largest adsorption capacity, and the maximum unit adsorption capacity was 26 mg g−1 at adsorption equilibrium. When the adsorbent dosage was a maximum (12.5 g L−1), the adsorbent presented the smallest unit adsorption amount (2.5 mg g−1), and the utilization rate of the adsorbent was reduced. This is because the dose of adsorbent is inversely proportional to the unit adsorption capability in the adsorption equation. Moreover, high doses of adsorbent may also cause aggregation, which results in a decrease in the surface area of the adsorbent and a decrease in its adsorption capacity.37
3.4 Adsorption isotherm
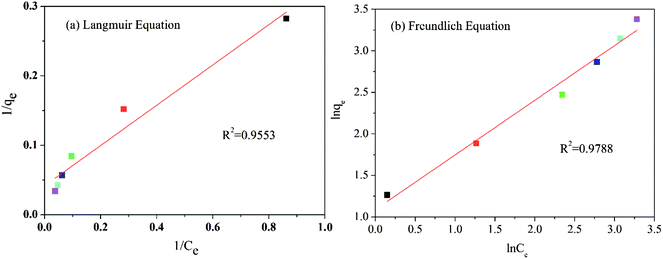
In order to better determine the adsorption process, an adsorption isotherm model was used to describe the equilibrium relationship and the affinity between the adsorbent and the adsorbant and to investigate the adsorption capacity and surface characteristics of the adsorbent. In the present study, both linear Langmuir and Freundlich adsorption isotherm model formula (1) and formula (2)38–40 were used to describe the adsorption data.
 | (1) |
 | (2) |
| Dosage of TiO2@AS/(g L−1) | Langmuir model | Freundlich model | ||||
|---|---|---|---|---|---|---|
| qm/(mg g−1) | K/(L mg−1) | R2 | Kf/((mg g−1) (mg L−1)−1/n) | n−1 | R2 | |
| 2.5 | 23.95 | 0.14 | 0.9533 | 2.97 | 0.66 | 0.9788 |
The adsorption data is in good agreement with the Langmuir and Freundlich models (R2 > 0.95) (see Table 1). One can conclude that the adsorption of methylene blue by TiO2@AS includes monolayer and multimolecule adsorption processes.37 However, the Freundlich model was more consistent with the data (R2 = 0.9788), indicating the probability that multilayer adsorption dominates in the adsorption process of TiO2@AS. The Kf value increased along with an increase in adsorption temperature. This can be explained as the increase in temperature being favorable to the adsorption of methylene blue by TiO2@AS, and this adsorption reaction is an endothermic reaction. The value of 1/n is between 0 and 1, indicating that the adsorption process is favorable to adsorption.41 That is, methylene blue molecules are easily adsorbed on the surface of TiO2@AS.
3.5 Adsorption kinetics
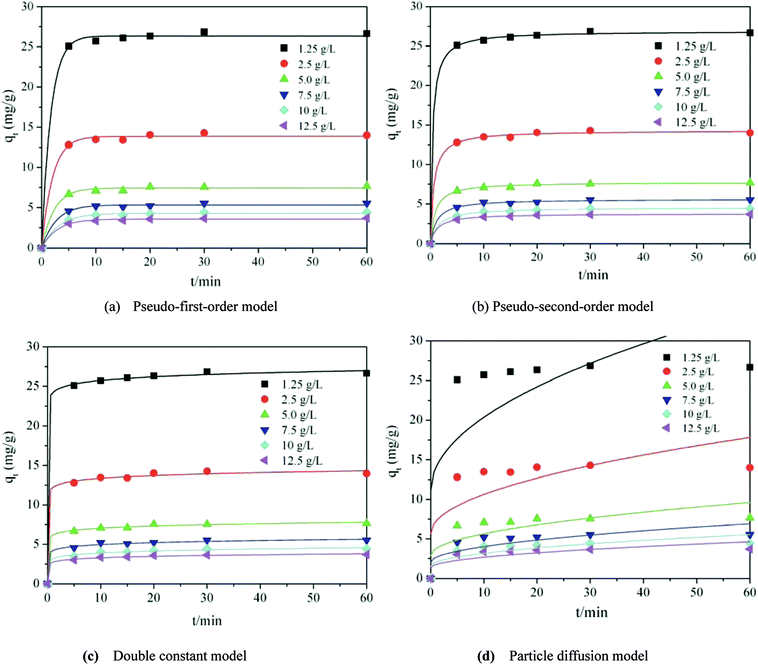
Adsorption kinetics are usually used to describe the adsorption rate between the adsorbent and the adsorbate.42–44 In this paper, the pseudo-first-order kinetic model,45,46 the pseudo-second-order kinetic model,47,48 the dual constant model, and the intragranular diffusion model (as in formulae (3)–(6))49 were used to describe the relevant data.
 | (3) |
 | (4) |
| Intragranular diffusion model qt = kpt0.5 + c | (5) |
Dual constant model ln![[thin space (1/6-em)]](https://www.rsc.org/images/entities/char_2009.gif) qt = a + k qt = a + k![[thin space (1/6-em)]](https://www.rsc.org/images/entities/char_2009.gif) ln ln![[thin space (1/6-em)]](https://www.rsc.org/images/entities/char_2009.gif) t t
| (6) |
Fig. 7 and Table 2 clearly show that the pseudo-second-order kinetic model was the most consistent with the experimental data (R2 ≥ 0.9964). This indicates that the adsorption of methylene blue by TiO2@AS is mainly chemical adsorption. Therefore, the main rate control step is chemical adsorption, and the adsorption process is controlled by chemical reaction.50 The bond strength was generated by electron sharing or exchange between adsorbate and adsorbent.48 Furthermore, it can be seen that with an increase in TiO2@AS dosage, the fitting effect was gradually getting worse, and k2 showed an increasing trend. This is attributed to the fact that it will take less time to reach a certain qt/qe value at high dosages:7 ie the adsorption rate is improved. The c continuously declined with increasing dosage of TiO2@AS, indicating that the effect of boundary layer thickness on the mass transfer rate is reducing. It can also be deduced that the c value will increase with an increase in adsorbate, indicating that the increase in adsorbate can improve the influence of the thickness of the boundary layer.
| Dosage of TiO2@AS/(g L−1) | Qe,exp/(mg g−1) | Pseudo-first-order kinetic model | Pseudo-second-order kinetic model | ||||
|---|---|---|---|---|---|---|---|
| k1 | qe | R2 | k2 | qe | R2 | ||
| a Qe,exp refers to the saturated adsorption amount of methylene blue by TiO2@AS. | |||||||
| 1.25 | 26.65 | 0.60 | 26.35 | 0.9985 | 0.10 | 26.88 | 0.9997 |
| 2.5 | 13.98 | 0.50 | 13.86 | 0.9962 | 0.12 | 14.27 | 0.9982 |
| 5.0 | 7.67 | 0.44 | 7.44 | 0.9934 | 0.15 | 7.75 | 0.9981 |
| 7.5 | 5.53 | 0.38 | 5.34 | 0.9924 | 0.15 | 5.62 | 0.9964 |
| 10.0 | 4.42 | 0.32 | 4.28 | 0.9931 | 0.15 | 4.56 | 0.9981 |
| 12.5 | 3.70 | 0.35 | 3.57 | 0.9934 | 0.20 | 3.78 | 0.9994 |
| Dosage of TiO2@AS/(g L−1) | Qe,exp/(mg g−1) | Dual constant model | Intragranular diffusion model | ||||
|---|---|---|---|---|---|---|---|
| k | a | R2 | kp | c | R2 | ||
| 1.25 | 26.65 | 24.22 | 0.03 | 0.999 | 2.93 | 11.09 | 0.436 |
| 2.5 | 13.98 | 12.21 | 0.04 | 0.997 | 1.57 | 5.66 | 0.461 |
| 5.0 | 7.67 | 6.19 | 0.06 | 0.997 | 0.87 | 2.90 | 0.505 |
| 7.5 | 5.53 | 4.21 | 0.07 | 0.994 | 0.63 | 2.00 | 0.536 |
| 10.0 | 4.42 | 3.19 | 0.09 | 0.992 | 0.52 | 1.53 | 0.567 |
| 12.5 | 3.70 | 2.75 | 0.08 | 0.996 | 0.43 | 1.31 | 0.553 |
3.6 Adsorption thermodynamics
In order to study the thermodynamic properties of the adsorption process, three important parameters, Gibbs free energy (ΔG0), enthalpy (ΔH0), entropy (ΔS0), must be calculated, as in formulae (7)–(9).38
 | (7) |
ΔG = −RT![[thin space (1/6-em)]](https://www.rsc.org/images/entities/char_2009.gif) ln(Kc) ln(Kc)
| (8) |
 | (9) |
The values of the thermodynamic parameters are listed in Table 3. The value of ΔG0 is negative under all set temperature conditions (ΔG0 < 0), indicating that the reaction is spontaneous. And with an increase in T, ΔG0 decreased, indicating that warming is favorable to adsorption. The positive value of ΔH0 indicates that the reaction is endothermic. The value of ΔH0 is less than 100 kJ mol−1, which shows that the temperature has little effect on the adsorption reaction, and the interaction between TiO2@AS and methylene blue is not strong. The positive value of ΔS0 indicates that there is an affinity between TiO2@AS and methylene blue molecules, and the adsorption reaction increases the disorder of the solid–liquid interface of TiO2@AS.
| T (K−1) | Kc | ΔG0/(kJ mol−1) | ΔH0/(kJ mol−1) | ΔS0/(kJ (mol K)−1) |
|---|---|---|---|---|
| 288.15 | 3.42 | −2.94 | 13.065 | 0.747 |
| 298.15 | 3.71 | −3.25 | ||
| 308.15 | 4.11 | −3.622 | ||
| 318.15 | 4.06 | −3.707 | ||
| 328.15 | 4.05 | −3.815 | ||
| 338.15 | 4.34 | −4.124 |
3.7 Regeneration of TiO2@AS
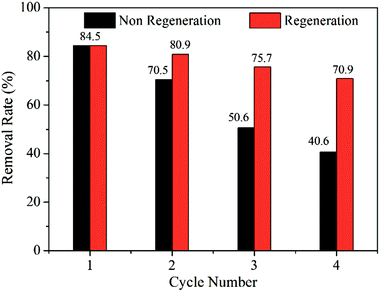
The regeneration experiment was performed on the basis of the adsorption equilibrium experiment, and the experimental conditions were all optimized. After the first adsorption equilibrium, the TiO2@AS was centrifugally separated from the solution and placed in 20 mL of distilled water. Then, ultraviolet light was used to catalyze the methylene blue adsorbed on TiO2@AS.The trend of the regeneration cycle is shown in Fig. 8. Unregenerated TiO2@AS reduced the removal rate of methylene blue from 85% to 41% after 4 cycles. This shows that the adsorption sites of TiO2@AS are saturated and it cannot continue to effectively adsorb methylene blue. After 4 cycles of regenerated TiO2@AS, the removal rate of methylene blue can still reach over 70%, and the removal efficiency is not reduced significantly. This shows that by irradiation with ultraviolet light, electrons in the valence band of titanium dioxide absorb ultraviolet light energy, react with water molecules to generate hydroxyl radicals, and degrade methylene blue into carbon dioxide and water.15 Due to the better adsorption capacity of AS, this can provide a higher substrate concentration for photocatalysis and accelerate the decomposition of methylene blue. Moreover, the presence of titania particles in TiO2@AS composites can make TiO2@AS composites regenerate in UV light, prolong the service life of AS, and provide high-quality filters that can be recycled for use in constructed wetlands and other water treatment industries.
4 Conclusion
In the present study, a new type of composite adsorbent TiO2@AS was prepared. Then the structural evolution and morphological features were investigated using XRD, EDS and SEM. The titanium dioxide was loaded onto the surface of the AS with anatase crystal form. The surface of the TiO2@AS presented a layered structure and good adsorption capacity. The adsorption capacity of TiO2@AS for methylene blue was analyzed. The results showed that pH had little effect on the adsorption capacity, the adsorption capacity of TiO2@AS for methylene blue increased with an increase in the initial concentration of adsorbate, and decreased with an increase in TiO2@AS dosage. The isothermal adsorption equation was most consistent with the Freundlich model. The adsorption is multi-layer adsorption. The fact that n−1 < 1 indicates that the adsorption process is easy to carry out. The kinetic equation was consistent with the pseudo-second-order kinetic equation, indicating that the adsorption is chemical adsorption, and the chemical adsorption process is the rate control step. The negative ΔG0 and positive ΔH0 indicate that the adsorption process is a spontaneous, entropy-increasing endothermic process, and a temperature increase is conducive to the adsorption process. The TiO2@AS had a good adsorption effect on methylene blue. Moreover, it can be regenerated under ultraviolet light, thus prolonging the service life of AS and facilitating a solution to the problem of adsorption plugging.Conflicts of interest
There are no conflicts to declare.Acknowledgements
This work was supported by the Key Program of National Natural Science Foundation of China (41771215), the program for Changjiang Scholars and Innovative Research Team of the Chinese Ministry of Education (IRT0811), the Open Fund of Key Laboratory of Subsurface Hydrology and Ecological Effects in Arid Region (Ministry of Education) (No. 310829151140), the Open Fund of Key Laboratory of Subsurface Hydrology and Ecological Effects in Arid Region (Ministry of Education) (No. 310829151141).Notes and references
- L. Largitte and R. Pasquier, Chem. Eng. Res. Des., 2016, 109, 495–504 CrossRef.
- J. Li, L. Liu, J. Liu, T. Ma, A. Yan and Y. Ni, J. Environ. Chem. Eng., 2016, 4, 746–752 CrossRef.
- M. A. Tantawy, Mater. Res. Bull., 2015, 61, 415–421 CrossRef.
- W. Chu, Water Res., 2001, 35, 3147–3152 CrossRef PubMed.
- Y. Yang, Y. Q. Zhao, A. O Babatunde, L. Wang, Y. X. Ren and Y. Han, Sep. Purif. Technol., 2006, 51, 193–200 CrossRef.
- X. H. Zhao and Y. Q. Zhao, Sep. Purif. Technol., 2009, 66, 71–75 CrossRef.
- W. H. Hu, H. F. WU, M. Xu and F. Wu, Chin. J. Environ. Eng., 2011, 10, 2287–2292 Search PubMed.
- K. B. Dassanayake, G. Y. Jayasinghe, A. Surapaneni and C. Hetherington, Waste Management, 2015, 38, 321–335 CrossRef PubMed.
- F. G. Qiu, C. Lu, J. T. Xu, Y. F. Dai and K. M. Fu, Technol. Water Treat., 2017, 43, 77–81 Search PubMed.
- R. Liu, Y. Zhao, C. Sibille and B. Ren, Chem. Eng. J., 2016, 302, 120–127 CrossRef.
- Y. Wang, Y. Yu, H. Li and C. Shen, J. Environ. Sci., 2016, 50, 79–86 CrossRef PubMed.
- C. Liu, Y. Z. Yang and N. Wan, Chin. J. Environ. Eng., 2013, 7, 97–102 Search PubMed.
- H. Y. Xu, Z. L. Li, Q. Zhang, Y. N. Wang and S. K. Yang, Appl. Chem. Ind., 2016, 10, 1808–1811 Search PubMed.
- E. G. Duan, H. F. Wu and R. Y. Yang, Technol. Water Treat., 2015, 41, 66–69 Search PubMed.
- P. Zheng, B. Bai and W. S. Guan, Environ. Sci. Technol., 2016, 39, 128–133 Search PubMed.
- X. H. Zhao, Y. Q. Zhao, W. K. Wang, Y. Z. Yang, Y. S. Hu and L. Kumar, China Water Wastewater, 2015, 31, 131–136 Search PubMed.
- H. Khani, M. K. Rofouei, P. Arab, V. K. Gupta and Z. Vafaei, J. Hazard. Mater., 2010, 1, 402–409 CrossRef PubMed.
- V. K. Gupta, R. Kumar, A. Nayak, T. A. Saleh and M. A. Barakat, Adv. Colloid Interface Sci., 2013, 193–194, 24–34 CrossRef PubMed.
- V. K. Gupta, R. Jain, A. Nayak, S. Agarwal and M. Shrivastava, Mater. Sci. Eng., C, 2011, 5, 1062–1067 CrossRef.
- T. A. Saleh and V. K. Gupta, J. Colloid Interface Sci., 2012, 1, 101–106 CrossRef PubMed.
- M. Abdullah and S. K. Kamarudin, Renewable Sustainable Energy Rev., 2017, 76, 212–225 CrossRef.
- R. Dai, X. Y. Zheng, L. T. Cao, X. Wu, M. S. Zhang, Y. Z. Han and K. Zheng, Ion Exch. Adsorpt., 2016, 32, 368–376 Search PubMed.
- Y. Liu, P. Liang, L. Guo and H. B. Lu, Acta Chim. Sin., 2005, 63, 312–316 Search PubMed.
- W. Liu, X. L. Zhu and L. Q. Zhang, J. Tianjin Polytech. Univ., 2017, 63, 1–6 Search PubMed.
- J. Q. Jia, K. Q. Li, Y. X. Zhang and X. D. Qiao, Chin. J. Environ. Eng., 2014, 8, 92–97 Search PubMed.
- Q. W. Lin, Q. Zhao, M. F. Gao, J. L. Chang and H. Z. Ma, Chin. J. Environ. Eng., 2016, 11, 1–6 Search PubMed.
- M. Ghaedi, S. Hajjati, Z. Mahmudi, I. Tyagi, S. Agarwal, A. Maity and V. K. Gupta, Chem. Eng. J., 2015, 268, 28–37 CrossRef.
- R. Saravanan, S. Joicy, V. K. Gupta, V. Narayanan and A. Stephen, Mater. Sci. Eng., C, 2013, 8, 4725–4731 CrossRef PubMed.
- R. Saravanan, S. Karthikeyan, V. K. Gupta, G. Sekaran, V. Narayanan and A. Stephen, Mater. Sci. Eng., C, 2013, 1, 91–98 CrossRef PubMed.
- R. Saravanan, E. Sacari, F. Gracia, M. M. Khan, E. Mosquera and V. K. Gupta, J. Mol. Liq., 2016, 221, 1029–1033 CrossRef.
- C. Chang, T. Q. Liu, Y. T. Wang and Y. Y. Zhao, Acta Sientiae Circumstantiae, 2017, 37, 2680–2690 Search PubMed.
- Q. H. Liao, Q. Y. Liu, M. W. Meng, Y. M. Zhao, X. M. Ji, C. Y. Kang and S. Y. Huang, Chin. J. Environ. Eng., 2011, 5, 2447–2452 Search PubMed.
- D. Robati, B. Mirza, M. Rajabi, O. Moradi, I. Tyagi, S. Agarwal and V. K. Gupta, Chem. Eng. J., 2016, 284, 687–697 CrossRef.
- T. A. Saleh and V. K. Gupta, J. Colloid Interface Sci., 2011, 2, 337–344 CrossRef PubMed.
- L. D. Liang, X. X. Yan, Z. H. Ping, W. C. Xia and C. H. Qin, Chem. Ind. Eng., 2003, 20, 256–260 Search PubMed.
- X. Zhou, C. Lai, D. Huang, G. Zeng, L. Chen, L. Qin, P. Xu, M. Cheng, C. Huang, C. Zhang and C. Zhou, J. Hazard. Mater., 2018, 346, 113–123 CrossRef PubMed.
- K. Nithya, A. Sathish, P. Senthil Kumar and T. Ramachandran, J. Ind. Eng. Chem., 2018, 59, 230–241 CrossRef.
- M. Abbas and M. Trari, Process Saf. Environ. Prot., 2015, 98, 424–436 CrossRef.
- H. W. B. Teo, A. Chakraborty, Y. Kitagawa and S. Kayal, Int. J. Heat Mass Transfer, 2017, 114, 621–627 CrossRef.
- S. Yang, D. Ding, Y. Zhao, W. Huang, Z. Zhang, Z. Lei and Y. Yang, J. Environ. Chem. Eng., 2013, 1, 355–362 CrossRef.
- A. Tor and Y. Cengeloglu, J. Hazard. Mater., 2006, 138, 409–415 CrossRef PubMed.
- N. F. Abd Razak, M. Shamsuddin and S. L. Lee, Chem. Eng. Res. Des., 2018, 130, 18–28 CrossRef.
- E. Gunasundari and P. S. Kumar, Ind. Eng. Chem., 2017, 56, 129–144 CrossRef.
- R. Mohamed, H. H. El-Maghrabi, M. Riad and S. Mikhail, Journal of Water Process Engineering, 2017, 16, 212–222 CrossRef.
- H. Von Daake and D. Stephan, Cem. Concr. Res., 2017, 102, 119–126 CrossRef.
- J. Ye, X. Cong, P. Zhang, E. Hoffmann, G. Zeng, Y. Liu, W. Fang, Y. Wu and H. Zhang, Appl. Surf. Sci., 2015, 356, 128–134 CrossRef.
- A. Wang, K. Zhou, X. Liu, F. Liu, C. Zhang and Q. Chen, J. Colloid Interface Sci., 2017, 505, 947–955 CrossRef PubMed.
- W. Konicki, A. Hełminiak, W. Arabczyk and E. Mijowska, Chem. Eng. Res. Des., 2018, 129, 259–270 CrossRef.
- A. O. Babatunde and Y. Q. Zhao, J. Hazard. Mater., 2010, 184, 746–752 CrossRef PubMed.
- M. Chahkandi, Mater. Chem. Phys., 2017, 202, 340–351 CrossRef.
| This journal is © The Royal Society of Chemistry 2018 |

