 Open Access Article
Creative Commons Attribution 3.0 Unported Licence
Synthesis of coaxial carbon@NiMoO4 composite nanofibers for supercapacitor electrodes†
Changqing Teng,
Xuehui Gao,
Ning Zhang,
Yu Jia,
Xiaoyu Li,
Zhengyu Shi,
Zongxiao Wu,
Mingjia Zhi * and
Zhanglian Hong*
State Key Laboratory of Silicon Material, School of Materials Science and Engineering, Zhejiang University, 38 Zheda Road, Hangzhou, 310027, China. E-mail: Mingjia_zhi@zju.edu.cn; Hong_zhanglian@zju.edu.cn
First published on 24th September 2018
Abstract
This work reports the synthesis of coaxial carbon@NiMoO4 nanofibers for supercapacitor electrode applications. Thin NiMoO4 nanosheets are uniformly coated on the conductive electrospun carbon nanofibers by a microwave assisted hydrothermal method to form a hierarchical structure, which increases the porosity as well as the conductivity of the electrode. The thickness of the NiMoO4 can be easily adjusted by varying the precursor concentrations. The high specific surface area (over 280 m2 g−1) and conductive carbon nanofiber backbone increase the utilization of the active pseudocapacitive NiMoO4 phase, resulting a high specific capacitance of 1840 F g−1.
1. Introduction
In recent years, transitional metal oxides, especially binary and ternary metal oxides, have attracted much interest for supercapacitor electrodes, since they can offer higher energy density than typical carbonaceous materials.1,2 The superior performance of these complex oxides originated from the higher number of multiple oxidation states than that in the single component metal oxides. Among them, NiMoO4 is believed to be one of the most proposing candidates, as it has high specific capacitance. The main charge storage capability comes from the high electrochemical activity of Ni.4Nevertheless, like other metal oxides, NiMoO4 also suffers from the drawbacks of poor electronic conductivity, which may hinder its application in high-power density supercapacitors. In addition, increasing the numbers of the surface redox sites is crucial for high energy density purpose. One strategy is to tune the microstructure of the pristine NiMoO4 materials. Different types of NiMoO4 nanostructures such as nanorods,4–8 nanospheres,5 nanosheets9–12 and nanotubes13 have been prepared so far. High specific capacitances were also reported. For instance, hierarchical NiMoO4 nanosheets were directly grown on Ni foam by a facile hydrothermal and deliver the specific capacitance of 1221 F g−1 at 1 A g−1.9 NiMoO4 nanospheres had a high specific capacitance of 974 F g−1.5
Another possible solution would be incorporating NiMoO4 with conductive substrate, especially carbon nanostructures, which may improve the charge transfer capability of the composite and enable increasing the specific surface area.14–18 The NiMoO4/rGO composite electrode showed 1274 F g−1 capacitance at 1 A g−1, due to the enlarged specific surface area by coupled with conductive rGO.19 The key requirements for constructing these structures lay on the porous nature of the carbon nanomaterials, as well as the intimate coupling between NiMoO4 and the carbon interface. Such rational designing would not only improve the electrical conductivity, it even shortens the ions diffusion path.20–22
In this work, coaxial carbon/NiMoO4 composite nanofibers are prepared. In such composite, thin NiMoO4 nanosheets are grown outwards on the conductive electrospun carbon nanofibers (CNFs) to form the coaxial porous structure, in which the carbon fibers serve as the core and NiMoO4 nanosheets as the shell. The nanosheets form an intimate connection with the CNFs, which benefits the electron transfer and enlarges the redox active surface. Also, the porous CNFs backbone facilitates the electrolyte penetration into the composite, which is desirable for improve the rate capability. As a result, the prepared CNF@NiMoO4 has a large surface area of over 280 m2 g−1 and manifests faradaic capacitance of 1840 F g−1 (based on the mass of active NiMoO4). The asymmetric capacitor based on the CNF@NiMoO4 cathode can deliver a high energy density of 23.9 W h kg−1 at a power density of 0.75 kW kg−1 (the calculation is based on the whole electrode, including the mass of NiMoO4 and CNFs) and it shows good cycling stability with the retention of 78.3% after 10![[thin space (1/6-em)]](https://www.rsc.org/images/entities/char_2009.gif) 000 cycles.
000 cycles.
2. Experimental
2.1. Synthesis of the carbon nanofibers backbones
The carbon nanofibers were fabricated by electrospinning PAN (polyacrylonitrile)–DMF (N,N-dimethylformamide) precursor and followed by carbonization process.23–25 The electrospinning precursor was prepared by dissolving 1.2 g of PAN in 10 ml of DMF at 60 °C under vigorous stirring. 0.6 g of iron(III) acetylacetonate was then added into the precursor. According to the literature, the addition of Iron(III) acetylacetonate into the precursor can significantly enhance the conductivity of CNFs.26,27 The precursor was subsequently loaded into an electro-spinner. A high voltage of 15 kV was adopted and the distance between the needle and plate collector was fixed at 15 cm. The flow rate was maintained at 1.0 ml h−1. The as-spun nanofibers were stabilized at 280 °C for 60 min in air and then carbonized at 800 °C for 2 h in N2 atmosphere. The carbonized nanofibers were then washed in HCl solution (1 mol l−1) for 24 h to remove any soluble Fe oxides. The obtained carbon nanofibers (CNFs) were cut into small pieces (1 × 1 cm2).2.2. Synthesis of NiMoO4 @CNF
Ni(NO3)2·6H2O and Na2MoO4·2H2O was used to prepare NiMoO4 nanosheets. Typically, the chemicals were dissolved in the mixed solvent of H2O and ethanol (in 1![[thin space (1/6-em)]](https://www.rsc.org/images/entities/char_2009.gif) :
:![[thin space (1/6-em)]](https://www.rsc.org/images/entities/char_2009.gif) 1 volume ratio, totally 30 ml) as the Ni–Mo precursor. The CNFs pieces were then immersed into the Ni–Mo precursor. After that, the suspension was heated in a sealed microwave reactor at 140 °C for 60 min. After the reaction chamber was cooled down to room temperature, the CNF@Ni–Mo precursor fibers were taken out and washed with DI water and ethanol for several times. Finally, the samples were heated at 450 °C for 120 min to obtain CNF@NiMoO4 composite nanofibers. Four different amounts of Ni–Mo precursors were applied and the samples were designated as CNF@NiMo-0.5, CNF@NiMo-1, CNF@NiMo-2 and CNF@NiMo-3. More detail information can be found in the ESI Table S1†. For comparison, pristine NiMoO4 was synthesized by the same procedure with CNF@NiMo-2.
1 volume ratio, totally 30 ml) as the Ni–Mo precursor. The CNFs pieces were then immersed into the Ni–Mo precursor. After that, the suspension was heated in a sealed microwave reactor at 140 °C for 60 min. After the reaction chamber was cooled down to room temperature, the CNF@Ni–Mo precursor fibers were taken out and washed with DI water and ethanol for several times. Finally, the samples were heated at 450 °C for 120 min to obtain CNF@NiMoO4 composite nanofibers. Four different amounts of Ni–Mo precursors were applied and the samples were designated as CNF@NiMo-0.5, CNF@NiMo-1, CNF@NiMo-2 and CNF@NiMo-3. More detail information can be found in the ESI Table S1†. For comparison, pristine NiMoO4 was synthesized by the same procedure with CNF@NiMo-2.
2.3. Materials characterization
The crystal structure of the samples was characterized with X-ray diffraction (XRD, Cu-Kα irradiation; λ = 1.5418 Å). The morphology was observed by a scanning electron microscopy (SEM Hitachi S-4800) and transmission electron microscope (TEM; FEI Tecnai G2 F20 S-TWIN). The surface areas and the pore structures were measured by N2 adsorption/desorption method using Micrometric ASAP 2020 analyzer. The pore size distributions were calculated using the Barrett–Joyner–Halenda (BJH) method. The NiMoO4 loading amount was analysed by thermogravimetry (TG) and the samples were heated from room temperature up to 800 °C at a heating rate of 10 °C min−1 in air. The content of Fe in pure CNFs was analysed by ICP-OES (Optima 2100DV).2.4. Electrochemical measurements
The electrochemical measurements were conducted using a three-electrode system in a 6 M KOH aqueous solution with a 760E electrochemical workstation (CH Instruments, Shanghai, China). The CNF@NiMo nanofiber mats were directly used as working electrodes, with Ag/AgCl as the reference electrode and Pt foil as the counter electrode.The asymmetric supercapacitor device was fabricated with AC (activated carbon, Xianfeng Corp.) as the negative electrode and CNF@NiMo-2 as the positive electrode. The AC electrodes were prepared by mixing 80% activated carbon, 10% poly vinylidene fluoride (PVDF) binder, and 10% carbon black (super P) in N-methylpyrrolidinone (NMP), which was coated onto Ni foam as the negative electrode and dried at 60 °C for overnight.
3. Results and discussion
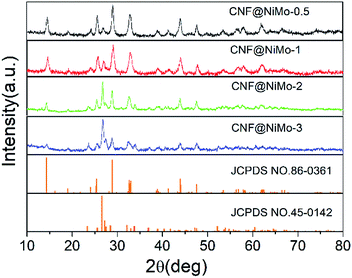
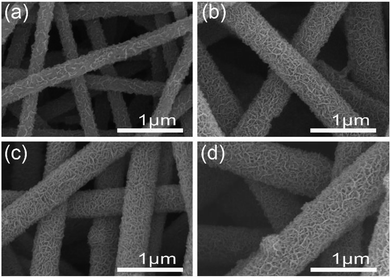
The crystalline structure of the CNF@NiMo has been characterized by XRD. Fig. 1 illustrates the XRD patterns of the different composite nanofibers. All the diffraction peaks indicate the successful formation of monoclinic structured nickel molybdenum oxide with a space group of C2/m (JCPDS card no. 86-0361 and 45-0142). The relative peaks intensities in the different samples are different. A higher concentration of Ni–Mo precursor leads to more JCPDS 45-0142 phase. This phenomenon subscribes to the previous paper, which reported the mixed phases can co-exist in the NiMoO4 nanostructures.28 The broad peaks also indicate that the size of crystalline grain of the NiMoO4 phase is small.The morphology of different CNF@NiMo samples has been analyzed by SEM and is shown in Fig. 2, and the morphology of raw CNFs (washed by HCl) can be found in Fig. S1.† From Fig. S1,† we can see that the surface of the raw CNFs is coarse, due to the etching of the Fe contained compounds.26 Such rough surface offers numerous nucleation and growth sites for NiMoO4. The diameter of the individual fiber is ∼400 nm and the length is over 30 μm. These nanofibers are integrated to form a porous structure. After the hydrothermal reaction and calcination, porous nanosheets appeared on the surface of the CNFs, which indicates the successful growth of NiMnO4 phase. Fig. 2(a) shows the sample with the lowest NiMo precursor concentration (CNF@NiMo-0.5), and it is evidently the squama like NiMoO4 textures can be found on the fiber surface. With the increasing of the NiMo precursor concentration, the NiMoO4 shell layer starts to cover the entire CNFs surface and becomes more homogeneous (Fig. 2(b–d)). By comparing the SEM images in Fig. 2, it can be founded that the surface of the composite nanofibers becomes more coarsened, and the diameter increases to ∼800 nm with the highest NiMoO4 loading. The observation above indicates that the NiMoO4 shell layer can be tuned by altering the precursor solution concentration.
TEM is further used to verify the porous nature of the composite nanofibers. Fig. 3 shows the TEM images taken from sample CNF@NiMo-2. Fig. 3(a) distinctly demonstrates the porous NiMoO4 layer has grown on a single CNF, which is constituted by numerous nanosheets. The layer thickness is approximate to the diameter of the CNFs. This result is in well agreement with the SEM observation. A closer view of the porous NiMoO4 layer in Fig. 3(b) confirms that the thickness of the nanosheets is about tens of nanometers, and the surface of nanosheets presents a great many of mesopores as shown in Fig. 3(c), which are mainly derived from the recrystallization process and the release of gas during the calcination process.4,29 In Fig. 3(d), the HRTEM image shows two kinds of lattice fringes with inter-planar distances of approximately 0.480 nm and 0.216 nm, respectively. These values are matched well with the spacing of the (−2 0 1) planes of JCPDS 86-0361 phase and the (2 2 2) planes of JCPDS 45-0142 phase. This result also accords well with the XRD analysis (Fig. 1).
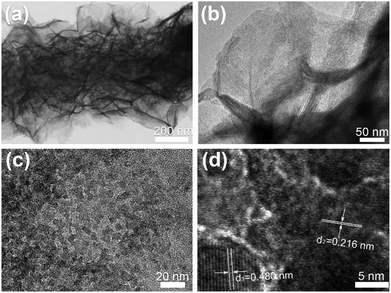 | ||
| Fig. 3 (a–c) TEM images of CNF@NiMo-2 at different magnification. (d) Corresponding HRTEM image of NiMoO4 nanosheets on CNFs. | ||
The specific surface area and the pore structure are vital for supercapacitor electrodes. The enlarged surface area will increase the surface redox reaction sites, while the mesoporous structure will facilitate the ion transfer. The corresponding N2 adsorption/desorption isothermal curves is showed in Fig. S2†. All CNF@NiMo samples have the N2 isotherms close to type IV with steep uptakes below P/P0 = 0.01 and clear hysteresis loops, which indicates the coexistence of micropores (<2 nm) and mesopores(2–50 nm) in these samples.18,30 The porous feature guarantees the high specific surface areas of 335 m2 g−1, 319 m2 g−1, 283 m2 g−1, and 279 m2 g−1 in CNF@NiMo-0.5, 1, 2, and 3 respectively. When the amount of nanosheets is more intensive, the specific surface of CNF@NiMo composite fibers becomes slightly lower, possibly due to the thicker and denser NiMoO4 shell layer. The CNF@NiMo has the highest specific surface area in comparison with other NiMoO4 materials reported in the literature (Summarized in Table S2†), hence resulting in a high specific capacitance. The average pore diameter of CNF@NiMo-2 calculated from BJH method is 3.78 nm, which corresponds to mesopores observed in TEM analysis (Fig. 3(c)).
Fig. S3† shows the N2 adsorption/desorption isothermal curves and pore size distribution of the pristine CNFs. The specific surface area of the pristine CNFs is 208.7 m2 g−1, which is lower than that of the CNF@NiMo composites. The average pore diameter of the pristine CNFs is 6.10 nm, which is larger than those in the CNF@NiMo samples. The NiMoO4 nanosheets grown on the CNFs not only enlarge the surface area of the composite, but also reduce the pore size of CNF, since the whole surface of the CNF has been covered by the nanosheets.
In order to determine the exact NiMoO4 loading on CNFs, thermogravimetric analysis (TGA) has been used. The typical TGA curves of the different samples are illustrated in Fig. S4†. A sharp weight loss is observed in the pristine CNFs sample at the temperature of 410 °C, which indicates the combustion of carbon.31 The residue of the CNFs sample is mainly due to the Fe2O3 phase transformed from the iron acetylacetonate. The additional XRD (Fig. S5†) and EDS (Fig. S6†) analysis of the TG residue have proved this point. The CNF@NiMo samples also shows gradual weight loss between 300 °C to 500 °C, which is also due to the decomposition of carbon.32 The percentage of weight remaining (named Wr) in CNF@NiMo-0.5, CNF@NiMo-1, CNF@NiMo-2, CNF@NiMo-3 and the pristine CNFs is about 34.9%, 37.4%, 40.6%, 49.0% and 13.6% after calcined at 800 °C in air. In the pristine CNFs samples, 13.6% of Fe2O3 is remained after the TG testing. For further confirming the content of Fe, ICP-AES has been adopted and shows that the Fe content is 9.71%, which is in accordance with TG analysis. Thus, the percentage of NiMoO4 mass (named Wm) ratio can be calculated by the formula below:
| Wm = (Wr − 13.6%)/(1 − 13.6%) | (1) |
In which Wr refers to the weight remaining in the CNF@NiMo composite sample. Thus, the NiMoO4 mass ratio (Wm) in CNF@NiMo-0.5, CNF@NiMo-1, CNF@NiMo-2, CNF@NiMo-3 is ∼24.6%, 27.6%, 31.3%, and 41.0%, respectively, which follows the order of the precursor concentration and is reflected in the shell thickness.
The electrochemical performance of these CNF@NiMo composite nanofibers has been examined in three-electrode configurations. The typical cyclic voltammetry (CV) curves of four CNF@NiMo electrodes at different scan rates ranging from 1 to 200 mV s−1 are showed in Fig. 4. All the samples have the similar shapes of CV curves. The distinct pairs of redox peaks are observed in CNF@NiMo composite nanofibers within the potential range from 0.15 to 0.4 V vs. Ag/AgCl. That confirms the pseudocapacitive characteristics originating from the faradaic redox reactions of NiMoO4, which is associated to the following reaction as4,33
| Ni(II) ↔ Ni(III) + e− | (2) |
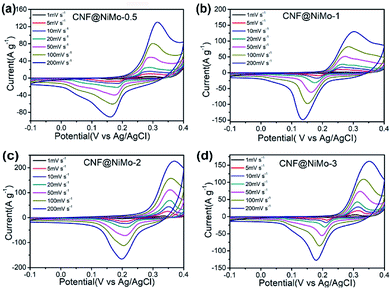 | ||
| Fig. 4 CV curves of (a) CNF@NiMo-0.5, (b) CNF@NMo-1, (c) CNF@NiMo-2, (d) CNF@NiMo-3 at various scan rates of 1–200 mV s−1. | ||
Apparently, the current intensity increases and the position of the redox peaks shifts slightly with the increased scan rates. Compared to the pristine NiMoO4 electrode (Fig. S7(a)†) or other published work,9,19,28,34 the shape of redox peaks still keeps integrity even the current intensity as high as 200 mV s−1, implying the better electrochemical reversibility. The CV curves of bare CNFs can be found in Fig. S8(a).† Clearly, the curves show the approximate rectangular shape and have a much smaller specific current density, and no distinct pairs of redox peaks are observed, which again indicates that the faradaic capacitance in the CNF@NiMo composite is mainly contributed from NiMoO4.
Fig. 5 depicts the charge/discharge voltage profiles of the different CNF@NiMo samples at current densities from 1 to 50 A g−1. The voltage window is −0.1–0.4 V vs. Ag/AgCl. The evident voltage plateaus in Fig. 5 further proves the pseudocapacitive behaviour of the electrode, which agrees well with the redox peaks observed in the CV curves. In contrast, the charge/discharge voltage profiles of the CNFs show a symmetrical triangle shape (Fig. S8(b), ESI†). No obvious pseudocapacitive behaviour can be observed in the pristine CNF electrode, which implies that the Fe content in the CNF has negligible effect on the capacitive behaviour of the composite electrode. This also states that the pseudocapacitive behaviour of CNF@NiMo electrode origins from NiMoO4 nanosheets rather than CNFs or Fe compound. The specific capacitance can be calculated by the formula:
| C = IΔt/mΔU | (3) |
| C(all) = W(CNF) × 79 F g−1 + W(NiMoO4) × C(NiMoO4) | (4) |
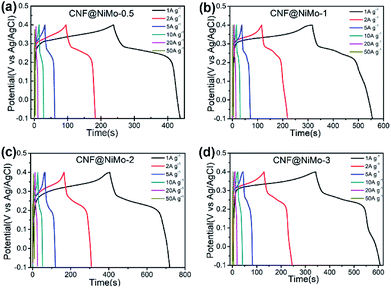 | ||
| Fig. 5 Galvanostatic charge/discharge voltage profiles of (a) CNF@NiMo-0.5, (b) CNF@NiMo-1, (c) CNF@NiMo-2, and (d) CNF@NiMo-3 electrodes in the voltage range of −0.1–0.4 V vs. Ag/AgCl. | ||
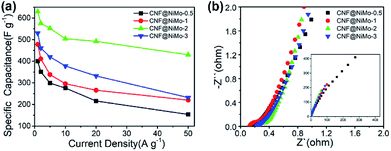 | ||
| Fig. 6 (a) The specific capacitance of different CNF@NiMo samples at various current densities, (b) electrochemical impedance spectra of different CNF@NiMo samples. | ||
It is furthermore noticeable to find that the CNF@NiMo-2 sample electrode delivers both the highest specific capacitance 1840 F g−1 at 1 A g−1 and rate capability of 78% at 20 A g−1(based on the mass of NiMoO4). However, the pristine NiMoO4 without CNFs, synthesized by the same procedure with CNF@NiMo-2, shows much lower specific capacitance of 1090 F g−1 at 1 A g−1 and rate capability of 59% at 20 A g−1(Fig. S7(b)†). It indicates that the combination of NiMoO4 and conductive CNFs does not only increase the specific capacity but also promote the rate performance. By comparison to the values from the reported NiMoO4 electrode materials (Table S2†), the CNF@NiMo-2 electrode possesses high specific capacitance and the outstanding rate capability at the same time. The impedance spectra of the electrodes support this finding and can be found in Fig. 6(b). The interception between the spectra and the Z′ axis at the high frequency range is used to obtain the equivalent series resistance. In the meantime, all the spectra show a step line at the low frequency range, which is the characteristic for capacitive electrode. The line of the CNF@NiMo-2 has the largest slope, confirming its good capacitive performance.
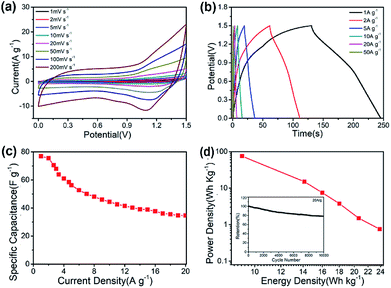
A practical asymmetric supercapacitor device is assembled with CNF@NiMo-2 and AC (the CV curves and the Galvanostatic charge/discharge voltage profiles of AC are showed in Fig. S9†) as the positive and negative electrodes, respectively. The potential window is set to be 1.5 V. Fig. 7(a) shows the CV curves of the device at different scan rates (1 mV s−1 to 200 mV s−1). From the curve, the contribution from both electric double-layer capacitance and pseudo capacitance can be clearly observed. To illustrate the electrochemical properties of the asymmetric supercapacitor, galvanostatic charge/discharge curves at various current densities have been performed in Fig. 7(b). The curve shows quasi-triangle shape with good symmetry, indicating there is no water decomposition and the Faraday efficiency of the device is high. The specific capacitance based on the mass of whole two electrodes can reach a maximum of 76.4 F g−1 at a current density of 1 A g−1 and maintain at 35.6 F g−1 when the current density increases to 20 A g−1 (Fig. 7(c)). The long-term cycling performance of the CNF@NiMo-2//AC device is also studied, showed in Fig. 7(d). The CNF@NiMo-2//AC still maintained 78.3% after 10![[thin space (1/6-em)]](https://www.rsc.org/images/entities/char_2009.gif) 000 cycles at a current density of 20 A g−1, suggesting the excellent electrochemical stability of the CNF@NiMo-2//AC device. Commonly, the energy density E and power density P are the two most important parameters for supercapacitor devices. At a power density of 0.75 kW kg−1, the CNF@NiMo-2 electrode delivers a high energy density of up to 23.9 W h kg−1, and still retains energy density of 11.2 W h kg−1 at high power density of 14.9 kW kg−1. The exceptional performance of CNF@NiMo-2//AC device could be attributed to its unique structure features. Specifically, hierarchical micro-nano structure allows for a synergistic integration of CNFs and NiMoO4. Functioned CNFs, the electrical conductivity of which is improved by Fe precursor,35,36 could provide electronic transmission channel,37,38 leading to enhanced rate performance; additionally, thin NiMoO4 sheets, with high specific surface area and much mesoporous, can deliver large specific capacity. Furthermore, macropores with much larger pore size have been constructed by the interconnected NiMoO4 nanosheets and CNFs framework, as evident from the SEM images shown in Fig. 2. This builds up a hierarchical pore structure composed of mesopores connected with macropores. In literature, it has been reported that the macropores can serve as solution buffering reservoir to minimize the diffusion distance, facilitate the mass transport, and also reduce the volume change during the charge/discharge cycling,3–43 ensuring a high cycling performance. Such hierarchical pore structure contributes to high energy density and power density of the composite electrode.
000 cycles at a current density of 20 A g−1, suggesting the excellent electrochemical stability of the CNF@NiMo-2//AC device. Commonly, the energy density E and power density P are the two most important parameters for supercapacitor devices. At a power density of 0.75 kW kg−1, the CNF@NiMo-2 electrode delivers a high energy density of up to 23.9 W h kg−1, and still retains energy density of 11.2 W h kg−1 at high power density of 14.9 kW kg−1. The exceptional performance of CNF@NiMo-2//AC device could be attributed to its unique structure features. Specifically, hierarchical micro-nano structure allows for a synergistic integration of CNFs and NiMoO4. Functioned CNFs, the electrical conductivity of which is improved by Fe precursor,35,36 could provide electronic transmission channel,37,38 leading to enhanced rate performance; additionally, thin NiMoO4 sheets, with high specific surface area and much mesoporous, can deliver large specific capacity. Furthermore, macropores with much larger pore size have been constructed by the interconnected NiMoO4 nanosheets and CNFs framework, as evident from the SEM images shown in Fig. 2. This builds up a hierarchical pore structure composed of mesopores connected with macropores. In literature, it has been reported that the macropores can serve as solution buffering reservoir to minimize the diffusion distance, facilitate the mass transport, and also reduce the volume change during the charge/discharge cycling,3–43 ensuring a high cycling performance. Such hierarchical pore structure contributes to high energy density and power density of the composite electrode.
4. Conclusions
In summary, uniform NiMoO4 nanosheets arrays have been successfully grown on functional CNFs via rapid microwave-solvothermal method followed by thermal treatment. The thickness of the NiMoO4 shell layer can be easily tuned. The prepared CNF@NiMo-2 with 27.6% oxide content manifests superior faradaic capacitance of 1840 F g−1 and maintains 78% of its capacitance at 20 A g−1. An asymmetric supercapacitor with CNF@NiMo-2 as the positive electrode can operate at 1.5 V cell voltage and deliver a high energy density of 23.9 W h kg−1 at a power density of 0.75 kW kg−1. Good cycling stability with retention of 78.3% specific capacitance after 10![[thin space (1/6-em)]](https://www.rsc.org/images/entities/char_2009.gif) 000 cycles is also achieved. The enhanced electrochemical performance of the CNF@NiMo-2 composite is mainly ascribed to the high specific surface of the uniform NiMoO4 nanosheets with mesoporous feature, as well as highly conductive CNFs. The strongly coupled composites may synergistically enhance the contact between electrolytes with active materials and shorten the ion diffusion path. Considering the desirable electrode configuration, easy fabrication process, and promising electrochemical performance, such a strategy might be readily extended for preparing other nanostructured electrode materials.
000 cycles is also achieved. The enhanced electrochemical performance of the CNF@NiMo-2 composite is mainly ascribed to the high specific surface of the uniform NiMoO4 nanosheets with mesoporous feature, as well as highly conductive CNFs. The strongly coupled composites may synergistically enhance the contact between electrolytes with active materials and shorten the ion diffusion path. Considering the desirable electrode configuration, easy fabrication process, and promising electrochemical performance, such a strategy might be readily extended for preparing other nanostructured electrode materials.
Conflicts of interest
There are no conflicts to declare.Acknowledgements
This work is supported by National key research and development program (Grant No. 2016YFB0901600) and NSCF (Grant No. 21303162 and Grant No. 11604295).References
- Y. Zhang, L. Li, H. Su, W. Huang and X. Dong, J. Mater. Chem. A, 2015, 3, 43–59 RSC.
- D. Chen, Q. Wang, R. Wang and G. Shen, J. Mater. Chem. A, 2015, 3, 10158–10173 RSC.
- B. Fang, M. Kim, S. Q. Fan, J. H. Kim, D. P. Wilkinson, J. Ko and J. S. Yu, J. Mater. Chem., 2011, 21, 8742–8748 RSC.
- S. Peng, L. Li, H. B. Wu, S. Madhavi and X. W. Lou, Adv. Energy Mater., 2015, 5, 1401172 CrossRef.
- D. Cai, D. Wang, B. Liu, Y. Wang, Y. Liu, L. Wang, H. Li, H. Huang, Q. Li and T. Wang, ACS Appl. Mater. Interfaces, 2013, 5, 12905–12910 CrossRef PubMed.
- M.-C. Liu, L. Kang, L.-B. Kong, C. Lu, X.-J. Ma, X.-M. Li and Y.-C. Luo, RSC Adv., 2013, 3, 6472 RSC.
- E. R. Ezeigwe, P. S. Khiew, C. W. Siong, I. Kong and M. T. T. Tan, Ceram. Int., 2017, 43, 13772–13780 CrossRef.
- C. Chen, D. Yan, X. Luo, W. Gao, G. Huang, Z. Han, Y. Zeng and Z. Zhu, ACS Appl. Mater. Interfaces, 2018, 10, 4662–4671 CrossRef PubMed.
- L. Huang, J. Xiang, W. Zhang, C. Chen, H. Xu and Y. Huang, J. Mater. Chem. A, 2015, 3, 22081–22087 RSC.
- M. Cao, Y. Bu, X. Lv, X. Jiang, L. Wang, S. Dai, M. Wang and Y. Shen, Appl. Surf. Sci., 2018, 435, 641–648 CrossRef.
- Y. Zhao, P. Zhang, W. Fu, X. Ma, J. Zhou, X. Zhang, J. Li, E. Xie and X. Pan, Appl. Surf. Sci., 2017, 416, 160–167 CrossRef.
- Z. Yin, Y. Chen, Y. Zhao, C. Li, C. Zhu and X. Zhang, J. Mater. Chem. A, 2015, 3, 22750–22758 RSC.
- Z. Yin, S. Zhang, Y. Chen, P. Gao, C. Zhu, P. Yang and L. Qi, J. Mater. Chem. A, 2015, 3, 739–745 RSC.
- M. Zhi, C. Xiang, J. Li, M. Li and N. Wu, Nanoscale, 2013, 5, 72–88 RSC.
- X. Tian, X. Li, T. Yang, K. Wang, H. Wang, Y. Song, Z. Liu and Q. Guo, Appl. Surf. Sci., 2018, 434, 49–56 CrossRef.
- Z. Fan, J. Yan, T. Wei, L. Zhi, G. Ning, T. Li and F. Wei, Adv. Funct. Mater., 2011, 21, 2366–2375 CrossRef.
- J. Zhou, J. Chen, S. Han, H. Zhao, J. Bai, Z. Yang, X. Mu, Y. Liu, D. Bian, G. Sun, Z. Zhang, X. Pan and E. Xie, Carbon, 2017, 111, 502–512 CrossRef.
- L. F. Chen, X. D. Zhang, H. W. Liang, M. Kong, Q. F. Guan, P. Chen, Z. Y. Wu and S. H. Yu, ACS Nano, 2012, 6, 7092–7102 CrossRef PubMed.
- T. Liu, H. Chai, D. Jia, Y. Su, T. Wang and W. Zhou, Electrochim. Acta, 2015, 180, 998–1006 CrossRef.
- B. G. S. Raj, R. N. R. Ramprasad, A. M. Asiri, J. J. Wu and S. Anandan, Electrochim. Acta, 2015, 156, 127–137 CrossRef.
- W. Zhang, B. Quan, C. Lee, S. K. Park, X. Li, E. Choi, G. Diao and Y. Piao, ACS Appl. Mater. Interfaces, 2015, 7, 2404–2414 CrossRef PubMed.
- H.-Y. Li, K. Jiao, L. Wang, C. Wei, X. Li and B. Xie, J. Mater. Chem. A, 2014, 2, 18806–18815 RSC.
- L. Zhang, A. Aboagye, A. Kelkar, C. Lai and H. Fong, J. Mater. Sci., 2013, 49, 463–480 CrossRef.
- M. Inagaki, Y. Yang and F. Kang, Adv. Mater., 2012, 24, 2547–2566 CrossRef PubMed.
- L.-F. Chen, Y. Lu, L. Yu and X. W. Lou, Energy Environ. Sci., 2017, 10, 1777–1783 RSC.
- M. Zhi, A. Manivannan, F. Meng and N. Wu, J. Power Sources, 2012, 208, 345–353 CrossRef.
- M. Zhi, S. Liu, Z. Hong and N. Wu, RSC Adv., 2014, 4, 43619–43623 RSC.
- D. Ghosh, S. Giri and C. K. Das, Nanoscale, 2013, 5, 10428–10437 RSC.
- H. B. Wu, H. Pang and X. W. Lou, Energy Environ. Sci., 2013, 6, 3619 RSC.
- Y. Tao, H. Tanaka, T. Ohkubo, H. Kanoh and K. Kaneko, Adsorpt. Sci. Technol., 2003, 21, 199–203 CrossRef.
- S. Maldonado and K. J. Stevenson, J. Phys. Chem. B, 2005, 109, 4707–4716 CrossRef PubMed.
- L. Hlekelele, P. J. Franklyn, F. Dziike and S. H. Durbach, New J. Chem., 2018, 42, 4531–4542 RSC.
- B. Senthilkumar, K. Vijaya Sankar, R. Kalai Selvan, M. Danielle and M. Manickam, RSC Adv., 2013, 3, 352–357 RSC.
- D. Cai, B. Liu, D. Wang, Y. Liu, L. Wang, H. Li, Y. Wang, C. Wang, Q. Li and T. Wang, Electrochim. Acta, 2014, 115, 358–363 CrossRef.
- B. Zhang, Z.-L. Xu, Y.-B. He, S. Abouali, M. Akbari Garakani, E. Kamali Heidari, F. Kang and J.-K. Kim, Nano Energy, 2014, 4, 88–96 CrossRef.
- B. Zhang, F. Kang, J.-M. Tarascon and J.-K. Kim, Prog. Mater. Sci., 2016, 76, 319–380 CrossRef.
- Y. Liu, J. Zhou, L. Chen, P. Zhang, W. Fu, H. Zhao, Y. Ma, X. Pan, Z. Zhang, W. Han and E. Xie, ACS Appl. Mater. Interfaces, 2015, 7, 23515–23520 CrossRef PubMed.
- Y. Chen, X. Li, X. Zhou, H. Yao, H. Huang, Y.-W. Mai and L. Zhou, Energy Environ. Sci., 2014, 7, 2689–2696 RSC.
- B. Fang, J. H. Kim, M. S. Kim and J. S. Yu, Acc. Chem. Res., 2013, 46, 1397 CrossRef PubMed.
- B. Fang, M. S. Kim, J. H. Kim, S. Lim and J. S. Yu, J. Mater. Chem., 2010, 20, 10253–10259 RSC.
- B. Fang, A. Bonakdarpour, M. S. Kim, J. H. Kim, D. P. Wilkinson and J. S. Yu, Microporous Mesoporous Mater., 2013, 182, 1–7 CrossRef.
- Y. Xing, Y. Wang, C. Zhou, S. Zhang and B. Fang, ACS Appl. Mater. Interfaces, 2014, 6, 2561–2567 CrossRef PubMed.
- P. Ramesh, M. E. Itkis, J. M. Tang and R. C. Haddon, J. Phys. Chem. C, 2008, 112, 9089–9094 CrossRef.
Footnote |
| † Electronic supplementary information (ESI) available. See DOI: 10.1039/c8ra05912h |
| This journal is © The Royal Society of Chemistry 2018 |

