 Open Access Article
Synergistic effect of adsorption coupled with catalysis based on graphene-supported MOF hybrid aerogel for promoted removal of dyes†
Yinjia Wan‡
,
Jianzhi Wang‡,
Fei Huang,
Yanan Xue,
Ning Cai,
Jie Liu,
Weimin Chen and
Faquan Yu *
*
Wuhan Institute of Technology, Xiongchu Ave 693, Wuhan 430073, Hubei, China. E-mail: fyu@wit.edu.cn; fyuwucn@gmail.com; Fax: +86-27-87194465; Tel: +86-27-87194980
First published on 8th October 2018
Abstract
A three-dimensional MIL-100(Fe)/graphene hybrid aerogel (MG-HA) was fabricated via in situ decoration of graphene oxide with MIL-100(Fe) nanoparticles. The resulting MG-HA with interconnected pore structure was applied as both adsorbent and catalyst for the removal of methylene blue (MB) from aqueous solutions. The result shows that the saturation adsorption capacity of the MG-HA was as high as 333.33 mg g−1, exceeding that of both the corresponding pristine graphene aerogel and MIL-100(Fe) nanoparticles. In the presence of hydrogen peroxide, MG-HA further exhibited catalytic degradation ability. The dual functions achieved a synergistic effect leading to the quick and complete removal of MB. The benefit was revealed in the treatment of high concentration of pollutants without leaving secondary pollution. The merit was intuitively demonstrated in the instant removal of MB through a model separation device in comparison with a series of common adsorbents. A feasible mathematic model was built based on the synergistic adsorption/catalysis process, which perfectly fitted the experimental data. A pseudo-second-order adsorption process and pseudo-first-order catalytic degradation kinetics were revealed. Additionally, the MG-HA was able to retain 93.4% of its initial removal efficiency after 5 cycles of application. The macro-material body can be easily separated and reused without a time-consuming and high-cost recycling process.
1. Introduction
In the dyestuff industry, increasing water pollution has been a very serious problem and is having an adverse impact on public health and social economy.1 Nowadays, there are several methods used to treat the polluted water, such as adsorption,2 chemical catalytic oxidation,3 biodegradation,4 solvent extraction,5 photocatalytic degradation6 and membrane separation.7 Adsorption and chemical catalytic oxidation have been promising approaches. The adsorption technique is one of the effective, economical and easily regenerated ways; however, such a technique will have to deal with the used adsorbents, which will otherwise cause secondary pollution and need an appropriate follow-up process. Chemical catalytic oxidation tends to remedy the problems facing the adsorption techniques via the degradation of pollutants. Unfortunately, this technique is not suitable for removing dyes at low concentration level, considering its relatively low oxidation rate and high cost.8 In other words, it is difficult for chemical catalytic oxidation to treat low concentrations of dyes economically. By combining adsorption with the chemical catalytic oxidation technique, in which the adsorbent itself acts as a catalyst for the degradation of dyes, a kind of adsorption/catalysis combined technique has been developed.9 The dyes are concentrated on the adsorbent and then degraded by catalytic oxidation. Under this circumstance, the catalytic degradation is accelerated in that the dye is concentrated and more importantly the concentrated dye contacts the catalyst tightly. After the chemical degradation of dyes from the adsorbent, the adsorption equilibrium is broken and more dyes would be adsorbed. The synergistic process will build up in the reciprocal interaction between adsorption and degradation, giving rise to high removal rate without any risk of releasing secondary pollution.High surface area, appropriate porous structure and high catalytic activity are usually expected to achieve high efficiency in the design of an adsorbent/catalyst.10 Metal–organic frameworks (MOFs), being composed of organic bridging ligands and metal ions to form three-dimensional (3D) extended networks with uniform pore diameter, are considered superior in both adsorption and catalysis owing to their high intake capacity, better selectivity and also the possibility of tuning the chemical properties by varying organic linkers or metal atoms.11,12 In addition, MOFs catalyzed a couple of reactions owing to the underlying building blocks and the frameworks themselves possessing sites of intrinsic catalytic potential (i.e. Lewis acidic metal sites, organocatalytic moieties, pore size and shape).13–15 However, obvious obstacles lie in the difficulty in recycling either as adsorbent or catalyst materials due to the submicron or micron size of MOF particles. Graphene is a one-atom-thick and two-dimensional (2D) layer of sp2-hybridized carbon.16 Interest in graphene has grown due to its extraordinary physicochemical properties such as high specific surface area, unique morphology, chemical structure, and electrical properties. Graphene has thus been used as an expeditious adsorbent for various pollutants due to its large, delocalized π-electron system, which can form strong interactions with pollutants.17,18 Graphene composite materials showed more advantages in terms of the irreversible agglomeration of graphene into graphite, which usually led to poor processability. 2D calcium alginate and graphene oxide (GO) composite materials revealed 114.9–181.8 mg g−1 adsorption capacity for methylene blue (MB).19 GO/chitosan/silicon dioxide composite fiber adsorbed Congo red at an adsorption capacity of up to 294.15 mg g−1.20 Composite structures of graphene with layered double hydroxides were expected to exhibit high adsorption capacity.21
On the other hand, graphene functions as a metal-free catalyst. Researchers listed the active sites, including oxygenated functional groups, carbon vacancies and holes, edge effects, the presence of dopant elements etc. Besides the discrete active sites, the catalytic activity also arises from the adsorption and activation of substrates and reagents by charge transfer.22 This implies that the adsorption and catalysis will promote each other.
Nevertheless, the above methods usually resulted in the powder state of the adsorbent or catalyst. This is not conducive to recycling, leading to a time-consuming and high-cost recycling process. Graphene aerogels (GA) inherit the properties of graphene, especially having the structure of a macro-material body, high accessible surface areas and tunable macropores, and thus have attracted great attention in adsorption.23–26
An attractive process is to make the structure of an aerogel by the combination of MOF particles with graphene. In this study, an efficient adsorption/catalysis material was fabricated and investigated as both adsorbent and catalyst to evaluate the synergetic effect on the removal of MB. The reusability and recyclability were explored as well.
2. Experimental
2.1. Materials
All chemical reagents were used as received. Iron(III) chloride hexahydrate (FeCl3·6H2O, 97%), 1,3,5-benzenetricarboxylic acid (trimesic acid, H3BTC), 1,2-diaminoethane anhydrous (EDA, 98%), graphite, sulfuric acid (H2SO4, 95–98%), nitric acid (HNO3, 65–68%), phosphoric acid (H3PO4, 85%), hydrogen peroxide aqueous solution (H2O2, 30%) and potassium permanganate (KMnO4, 99.5%) were purchased from Sinopharm Chemical Reagent. MB (70%) was purchased from Aladdin Chemical Reagent. All chemicals were of analytical grade and were used without further purification. Water used in all experiments was distilled and deionized.2.2. Synthesis of GO
GO was prepared by an improved Hummers' method as described in ref. 27. The as-prepared GO was dispersed in deionized water (2 mg mL−1) and sonicated for 30 min. The resulting brown dispersion was subjected to centrifugation for 20 min at 4000 rpm to remove un-exfoliated GO.2.3. Synthesis of MIL-100(Fe)
MIL-100(Fe) was synthesized according to a hydrothermal reaction reported by Romain.28 Typically, a mixture of FeCl3·6H2O (1 mmol, 162.2 mg) and H3BTC (0.66 mmol, 138.7 mg) dispersed in 20 mL of deionized water was heated for 72 h at 120 °C in a 50 mL Teflon-lined autoclave. After cooling, the prepared orange powder was collected by centrifugation and washed thoroughly with deionized water and ethanol three times to remove the unreacted H3BTC. Then, the orange solid was recovered by freeze-drying.2.4. Synthesis of MIL-100(Fe)/graphene hybrid aerogel (MG-HA)
MG-HA was prepared using the following procedures. Briefly, a certain amount of MIL-100(Fe) was added into 5 mL of GO dispersion (2 mg mL−1) to obtain a homogeneous mixture under ultrasonication. Then 20 μL of EDA was added dropwise to the mixture. Afterwards 5 mL of the mixture was placed in a 10 mL vial and maintained at 180 °C in a 50 mL Teflon-line autoclave for 12 h. After that, the autoclave was cooled down to room temperature. The as-formed product then was lyophilized to yield the aerogel. Variation of the quantity of MIL-100(Fe) (5, 10, 20 mg) would produce different hybrid aerogels, which reflect the mass ratio of MIL-100(Fe) to GO as 0.5, 1.0 and 2.0, respectively termed as 0.5MG-HA, 1.0MG-HA and 2.0MG-HA. Pure GA was prepared under the same conditions in the absence of MIL-100(Fe) for comparison.2.5. Characterization
The morphology of MIL-100(Fe), GA and MG-HA was characterized by scanning electron microscopy (SEM, Hitachi, TM3030, Japan) combined with energy dispersive spectroscopy (EDS) and transmission electron microscopy (TEM, JEM-2100USA). Raman spectra were collected by using a Raman spectrometer (Thermo Scientific DXR, USA) equipped with a 633 nm argon ion laser. The chemical structure of the membranes was analyzed with attenuated total reflectance FTIR (PerkinElmer, Spectrum II, USA) in the wavenumber range of 400–4000 cm−1. Samples were ground with KBr and pressed to plates for measurement. The Brunauer–Emmett–Teller (BET) surface area and pore size were determined by nitrogen adsorption (ASAP2460, Micromeritics, USA). The concentration of MB was analyzed with an ultraviolet spectrophotometer (Molecular Devices, USA).2.6. Adsorption experiments
MB was used as the target pollutant. 10 mg of MG-HA was added into 20 mL of MB aqueous solutions of different concentrations (150, 200, 250, 300 and 400 mg L−1) at 30 °C at 130 rpm in a shaking bath. After a fixed time, the adsorbent was separated. The residual solution concentration was determined by UV-visible absorbance at 664 nm. The adsorption amount was calculated according to the following equation:where Qt (mg g−1) is the adsorption amount at adsorption time t, C0 is the initial concentration of dye (mg L−1), Ct is the concentration of dye (mg L−1) at adsorption time t, m is the mass of adsorbent (g), and V is the volume of the solution (L).
2.7. Catalytic degradation
10 mg of MG-HA was added into 20 mL of MB solution (200 mg L−1) containing 100 μL of H2O2 (30%) at pH 6.0. After the pH was adjusted to 6.0, the mixture was shaken at 130 rpm at 30 °C. 40 μL samples were taken at predetermined time intervals for the analysis of residual MB concentration in the aqueous solution.To investigate the synergistic process of adsorption coupled with degradation, 10 mg 1.0MG-HA was added into 20 mL of MB solution (200 mg L−1) at pH 6.0 for adsorption. After shaking for 120 min, the desired amount of H2O2 was added to initiate oxidative degradation of MB. At predetermined time intervals, 40 μL of the mixture was taken for analysis of residual MB. After degradation, the adsorbent was collected and reused in the next cycle. All the experiments were performed in triplicate.
3. Results and discussion
3.1. Characterization
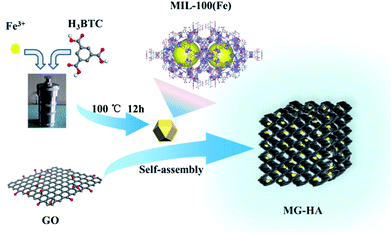
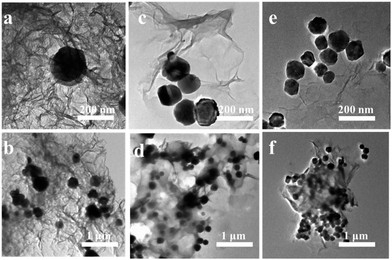
A schematic illustration for the fabrication of MG-HA is shown in Fig. 1. At first, MIL-100(Fe) was prepared by a hydrothermal process. Then MIL-100(Fe) and GO were autoclaved to obtain a 3D network of MG-HA. As shown in Fig. S1a,† MG-HA prepared with different ratios of MIL-100(Fe) to GO displayed different appearance. More MIL-100(Fe) resulted in a slacker texture. As an illustration, 1.0MG-HA can be set on dandelion flowers easefully without incurring any shape change of soft villi, indicating that the quality of this material is very light (Fig. S1b†). The hybrid aerogel can also support about 104 times its own weight, showing good mechanical strength though with ultralight density (Fig. S1c†). Importantly, different shapes can be conveniently fabricated dependent on the shape of the mold in which the aerogel was made (Fig. S1d†). A column shape was obtained, for instance, when a round-bottom vial was used (Fig. S1e and f†). That might meet the requirements in various application fields. Therefore, the macro body of MG-HA with ultralight density and good mechanical strength allows it to be applied efficiently and recovered conveniently as a pollutant adsorbent and catalyst.The morphology and structural details of the as-prepared MG-HA in different formulations were investigated by SEM (Fig. 2) and TEM (Fig. 3). From the SEM images in Fig. 2a–f, we can see that the as-prepared MG-HA showed well-defined and interconnected porous network with the pore size ranging from submicrometer to micrometers, which was constructed by thin layers of stacked graphene nanosheets. Compared with the smooth surface of pure GA (Fig. S2a†) and with the MIL-100(Fe) nanoparticles (Fig. S2b†), MG-HA exhibited a porous structure and numerous nanoparticles entrapped in a sheet-like structure. The nanoparticles were strongly believed to arise from MIL-100(Fe) and the sheet-like structure originated from graphene. The size of the nanoparticles in MG-HA was in a similar range to that of pure MIL-100(Fe) (Fig. S2b†). More nanoparticles were observed with elevated MOF ratios in the preparation process. EDS mapping analysis of 1.0MG-HA (Fig. 2g and S2c†) showed the distribution of C, Fe and O elements throughout the hybrid aerogel. Fig. 3 clearly shows that the graphene nanosheets in thickness were connected to form the network-like structure and the MG-HA were decorated with clusters of MIL-100(Fe) crystals between the graphene sheets. The interconnected graphene sheets prevented the agglomeration of MIL-100(Fe) and allowed the particles to disperse well in terms of the TEM observation.
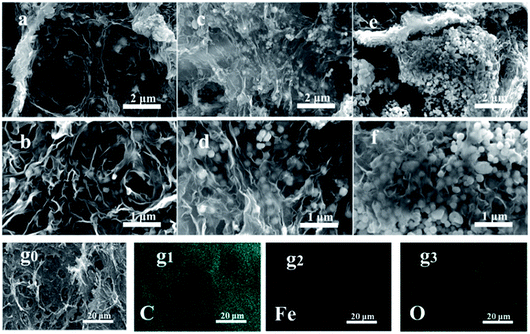 | ||
| Fig. 2 SEM images of (a and b) 0.5MG-HA, (c and d) 1.0MG-HA, (e and f) 2.0MG-HA, and (g1–g3) EDS mapping corresponding to SEM of 1.0MG-HA (g0). | ||
The formation of MG-HA was confirmed by XRD examinations, and the XRD patterns of MIL-100(Fe), GA and MG-HA are shown in Fig. 4A. In the XRD pattern of GA, the diffraction peak centered at 25.3° comes from the (001) crystal plane. The diffraction pattern of the 0.5MG-HA composite is similar to that observed for GA; no characteristic diffraction peaks of MIL-100(Fe) are observed, which indicates that the structure of GA is preserved. However, with an increase of the amount of MIL-100 added, the characteristic signals of MIL-100 crystals were also observed in the XRD pattern of 1.0MG-HA, and followed by the presence of XRD peaks of Fe3O4, implying that the MIL-100 crystals were gradually assembled in GA microenvironment, which is consistent with SEM and TEM results.
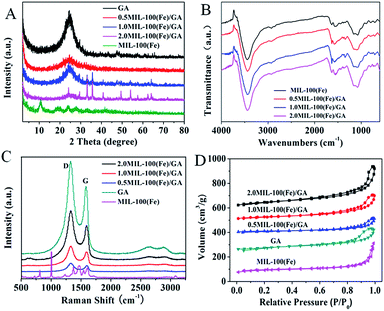 | ||
| Fig. 4 (A) XRD patterns, (B) FTIR spectra, (C) Raman spectra and (D) N2 adsorption/desorption isotherms. | ||
The FTIR spectra of MIL-100(Fe) as well as MG-HA are shown in Fig. 4B. The MG-HA spectrum exhibited the vibrations of MIL-100(Fe) at identical bands of 1443, 1383, 757, and 708 cm−1,30 which confirmed the successful incorporation of MIL-100(Fe) into GA. Raman spectroscopy is highly sensitive to electronic structure and has proven to be an essential tool for the characterization of carbon-based materials (especially for C![[double bond, length as m-dash]](https://www.rsc.org/images/entities/char_e001.gif) C bonds).31 The in situ deposition of MIL-100(Fe) particles and the self-assembly of GO sheets into the 3D interconnected aerogel structure are also driven by the combined hydrophobic and π–π stacking interaction of molecules due to the reduction of oxygenated moieties on the graphene surface. In Fig. 4C, the Raman spectra of the hybrid aerogels preserved the characteristic bands of GA as reported elsewhere.32 Two strong bands at 1350 and 1590 cm−1 of GA can be clearly seen, corresponding to the well-documented D and G bands of carbon materials, respectively.33 However, these Raman bands of the MIL-100(Fe) phase cannot be observed in the MG-HA spectra. The reason may be that the MIL-100(Fe) crystals of MG-HA were sheltered by GA, implying the good dispersion of MIL-100(Fe) nanoparticles on GA layers without local aggregation. The intensity ratio of D to G bands (ID/IG) is generally indicative of the disorder degree and healing of defects. The ID/IG intensity ratios of 0.5MG-HA, 1.0MG-HA and 2.0MG-HA were 1.41, 1.39 and 1.42, respectively, all higher than that of GA (1.37). This slight increase in ID/IG values was ascribed to the doped MIL-100(Fe) particles and wrinkles in the interconnected frameworks.32 Or, the aerogel was not just simply the physical mixture but involved a structure alteration. The defective structure may provide a large number of active sites for binding with other molecules.
C bonds).31 The in situ deposition of MIL-100(Fe) particles and the self-assembly of GO sheets into the 3D interconnected aerogel structure are also driven by the combined hydrophobic and π–π stacking interaction of molecules due to the reduction of oxygenated moieties on the graphene surface. In Fig. 4C, the Raman spectra of the hybrid aerogels preserved the characteristic bands of GA as reported elsewhere.32 Two strong bands at 1350 and 1590 cm−1 of GA can be clearly seen, corresponding to the well-documented D and G bands of carbon materials, respectively.33 However, these Raman bands of the MIL-100(Fe) phase cannot be observed in the MG-HA spectra. The reason may be that the MIL-100(Fe) crystals of MG-HA were sheltered by GA, implying the good dispersion of MIL-100(Fe) nanoparticles on GA layers without local aggregation. The intensity ratio of D to G bands (ID/IG) is generally indicative of the disorder degree and healing of defects. The ID/IG intensity ratios of 0.5MG-HA, 1.0MG-HA and 2.0MG-HA were 1.41, 1.39 and 1.42, respectively, all higher than that of GA (1.37). This slight increase in ID/IG values was ascribed to the doped MIL-100(Fe) particles and wrinkles in the interconnected frameworks.32 Or, the aerogel was not just simply the physical mixture but involved a structure alteration. The defective structure may provide a large number of active sites for binding with other molecules.
Pore structure and surface area are vital for adsorption and catalysis, so the BET specific surface area and pore structure parameters of MIL-100(Fe), GA and MG-HA were studied by N2 adsorption–desorption analysis. As can be seen in Fig. 4D, the N2 adsorption–desorption curves of MIL-100(Fe), GA and MG-HA displayed a type IV isotherm with an H3-type hysteresis loop, indicating a porous structure of all the samples.29 The values of BET surface area and total pore volume are listed in Table 1. MIL-100(Fe) exhibited much larger BET surface area than GA. After the combination, 1.0MG-HA possessed a surface area of 164.94 m2 g−1, significantly larger than that of both parent structures. This result can be attributed to the fact that the MIL-100(Fe) particles widened the distance between the GA nanosheets and enlarged the GA pores. Besides, the pores of MIL-100(Fe) were less blocked at the lower amount of MOF (1.0MG-HA). Further increasing the amount of MOF particles will fill the pores of GA. Also, MOF layers stacked on each other and thus the MOF pores were sealed to some degree. Fig. 2 verified the sealing effect. The BET surface area and the pore volume thus decreased with the amount of MOF.
| GA | MIL-100(Fe) | 0.5MG-HA | 1.0MG-HA | 2.0MG-HA | |
|---|---|---|---|---|---|
| BET surface area (m2 g−1) | 88.25 | 149.51 | 96.78 | 164.94 | 40.82 |
| Total pore volume (cm3 g−1) | 0.27 | 0.41 | 0.31 | 0.5 | 0.18 |
3.2. Adsorption kinetics and adsorption isotherms
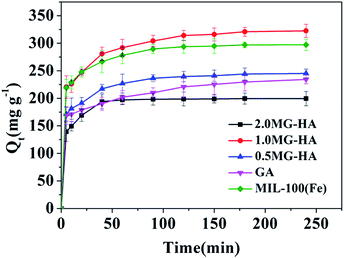
In order to highlight the superior performance of the prepared hybrid aerogels, GA and MIL-100(Fe) particles were involved for comparison. Fig. 5 shows the kinetic adsorption, where the adsorption amount reached 70–80% of saturation capacity in the initial 10 minutes for all these adsorbents. The quick adsorption ability was ascribed to the highly interconnected pore structure. Afterward, the adsorption became much slower. GA and MIL-100(Fe) displayed 263.16 and 312.50 mg g−1 adsorption capacity, respectively. 0.5MG-HA and 2.0MG-HA did not show as good an adsorption capacity as 1.0MG-HA. 1.0MG-HA showed the highest adsorption capacity (333.33 mg g−1). As discussed above, 1.0MG-HA possesses the largest pore volume and surface area with interconnected pore structure (Table 1). These structural features endowed the aerogel with high capacity as an adsorbent. The 3D interconnected network provides adequate molecular transportation channels and allows easy diffusion of dye molecules from the exterior to interior sites in the adsorbent. A large amount of negatively charged oxygen-containing functional groups (such as hydroxyl, carboxyl and carbonyl groups) available on graphene nanosheets provide additional opportunity for the adsorption of dye molecules through electrostatic attraction. Even more, the existence of π–π conjugation between MB molecules and graphene will augment the adsorption process. Fe Lewis acid sites in MIL-100(Fe) and Lewis base –N(CH3)2 in MB strengthened the adsorption as well. These structural and chemical mechanisms contributed to the elevated adsorption. But the aerogel with high proportion of MOF demonstrated lower adsorption capacity probably due to the stacking of MOF, mentioned above.To investigate the mechanism of adsorption, kinetic studies were performed at 25 °C. The pseudo-first-order and pseudo-second-order kinetic models were applied to fit the experimental data. The pseudo-first-order model can be described as follows:34
| ln(Qe − Qt) = lnQe − kat |
The pseudo-second-order kinetic expression is described in the following form:35
As can be seen from Table S1,† all the pseudo-second-order correlation coefficients (R2) were close to 0.99, much higher than those of the pseudo-first-order model. The calculated Qe values fully agreed with the experimental data in the case of pseudo-second-order kinetics. Therefore, the adsorption behavior can be perfectly described by the pseudo-second-order model, which means that chemical adsorption is the dominating step.
In order to investigate the adsorption capacity, adsorption isotherm experiments were carried out by varying the initial MB concentration from 150 to 400 mg L−1. The Langmuir and Freundlich isotherm models were applied to fit the experimental data. The Langmuir model is based on the assumption of monolayer adsorption on a homogeneous surface36 and is defined by the following formula:
The Freundlich model is an empirical expression which describes multilayer adsorption at heterogeneous surfaces36 and is expressed as follows:
The corresponding parameters of the two models are listed in Table 2. According to the two correlation coefficients (R2), the adsorption fits better the Langmuir isotherm model in contrast to the Freundlich model, reflecting that the process is monolayer adsorption on the surface of the adsorbent.
| Langmuir | Freundlich | |||||
|---|---|---|---|---|---|---|
| Qmax (mg g−1) | aL (L mg−1) | R2 | Kf (mg1−1/n L1/n g−1) | n | R2 | |
| 0.5MG-HA | 322.58 | 0.500 | 0.999 | 132.09 | 4.75 | 0.809 |
| 1.0MG-HA | 333.33 | 0.280 | 0.999 | 144.85 | 5.90 | 0.809 |
| 2.0MG-HA | 263.16 | 0.253 | 0.999 | 83.61 | 3.54 | 0.905 |
| MIL-100(Fe) | 312.50 | 0.593 | 0.999 | 150.85 | 6.31 | 0.829 |
| GA | 263.16 | 0.105 | 0.998 | 110.56 | 6.55 | 0.916 |
Fig. S4† proposes a possible adsorption mechanism of MG-HA for MB. The adsorption process was composed of surface adsorption, interparticle diffusion adsorption, and equilibrium. Surface adsorption was the rate-determining step achieved by three types of interactions: (1) electrostatic interaction; (2) hydrogen bonding; and (3) hydrophobic interaction. Electrostatic interaction occurred between deprotonated groups (i.e., –COO–) on the surface of graphene and MIL-100(Fe) particles, and positively charged quaternary ammonium groups in MB. Hydrogen bonding resulted from the interaction between –OH on the surface of graphene and amine in MB. Hydrophobic interaction was a tendency of nonpolar groups to associate in aqueous solution. Because of the aliphatic branches on its pendant groups, the grafted graphene had a hydrophobic character and could react with benzene rings in MB through hydrophobic interaction.
3.3. Catalytic degradation
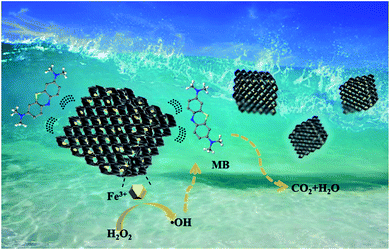
The approach of adsorption coupled with catalytic degradation was applied for the highly efficient removal of MB by using MG-HA. Fig. 6 illustrates the synergistic process of adsorption coupled with catalysis. MG-HA initially adsorbed MB from aqueous solution and then catalyzed the degradation of MB via the activation of hydrogen peroxide (H2O2).Fig. 7 demonstrates the results based on the synergistic effect of adsorption coupled with catalysis. In Fig. 7a, only 3% of MB was cleared within 80 minutes solely in the presence of H2O2. This result indicated that MB would not be oxidized by H2O2 without the involvement of catalysts. When 1.0MG-HA was applied in the absence of H2O2, obviously, only adsorption happened under these conditions. The adsorption resulted in 73.7% removal of MB within 60 minutes. Prolonged adsorption time brought a very limited increase of adsorption. The adsorption approached equilibrium. Afterward, H2O2 was added to initiate the catalytic oxidation process. The removal resumed. An accelerated degradation rate was observed. The removal percentage reached 99.3% in subsequent 20 minutes. The stepwise treatment apparently demonstrated the dual function of the obtained MG-HA. Especially, the removal rate was accelerated by the application of H2O2 though the solution concentration was pretty low at the moment that H2O2 was added. This is assumedly attributed to the fact that high MB concentration which has been already adsorbed on the surface of the adsorbent/catalyst brought about the quick oxidative degradation rate. The degradation of MB from the surface will in turn accelerate the adsorption. The synergistic mechanism finally led to the easy removal of MB. When H2O2 and 1.0MG-HA were added together, 99% of MB was removed within 60 minutes. Apparently, the synergistic effect took place under these conditions. Obviously, the benefits will be revealed fully in the treatment of high concentration of pollutants. In the case of high initial pollutant concentration, the equilibrium concentration of pollutants in solutions would still remain high with the use of only adsorption due to the restriction of the adsorption equilibrium limit. However, the synergistic effect will overcome the equilibrium and initiate the degradation process in the presence of H2O2, finally leading to the complete removal of pollutants without the requirement of more adsorbents. More interestingly, the removed pollutants were in situ degraded catalytically, avoiding secondary pollution.
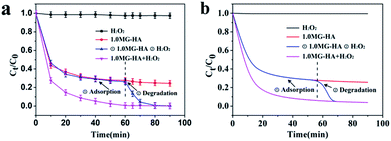 | ||
| Fig. 7 (a) Adsorption–degradation processes in the presence of H2O2, initial 1.0MG-HA and subsequent H2O2, and both 1.0MG-HA and H2O2. (b) Simulation curves of adsorption–degradation processes. | ||
The catalytic degradation is further verified in Fig. S5.† There the desorbed sample through adsorption in the absence of H2O2 kept the same spectrum as MB itself. However, the sample through the treatment of MG-HA in the presence of H2O2 displayed a different spectrum from MB itself. The experimental results indicated the occurrence of catalytic degradation. Meanwhile, the corresponding total organic carbon values were measured (Fig. S6†). The final mineralization rate of MB (200 mg L−1) after H2O2 oxidation was 85%. However, the mineralization rate should be higher than the measured value, because the carbon of the catalyst used in the degradation process led to measurement deviation.
To further elucidate the synergistic effect, an adsorption/catalysis coupled mathematic model was established based on the above pseudo-second-order adsorption and pseudo-first-order catalysis behavior. The specific derivation process is presented in the ESI.† The composite model is described as follows:
To verify the validity of the formula, four different cases (H2O2 only, 1.0MG-HA only, first 1.0MG-HA then H2O2, and 1.0 MG-HA + H2O2) were explored. The constants of pseudo-second-order kinetic plots and degradation pseudo-first-order rate are summarized in Table S2.† The simulation curves are shown in Fig. 7b. It was found that the simulation curves were in good agreement with the experimental curves in Fig. 7a, which reflected the feasibility of this composite model. Therefore, successful agreement of this model further validated the adsorption/catalysis coupled behavior.
The use of recycling is significant in industry. Though MIL-100(Fe) displays good adsorption capacity, it is very inconvenient to recycle in practical applications. In contrast, macro-size materials can overcome this drawback. This is why the hybrid aerogels were fabricated. To further assess the reusability of 1.0MG-HA for dye degradation (Fig. S7†), the MG-HA was washed with water after one catalytic run and reintroduced into a fresh dye solution containing 100 μL of H2O2 for another degradation run at 30 °C. The result showed that the removal ability in the fifth run reached 93.4% of that in the first run, indicating an expected practicability for industrial applications.
To demonstrate potential application in practice, a direct observation experiment was conducted via a syringe filter. 10 mg of sample was loaded into the filter first. 5 mL MB solution (80 mg L−1) was put in a 10 mL syringe, and injected through the adsorbent bed at a speed of 100.0 mL h−1 (Fig. S8†). Quantitative analysis indicated that 99.0% MB was removed when 1.0MG-HA was tested. The comparison study showed clearly that the hybrid aerogel gave the most obvious effect. This observation indicated potential industrial applications.
4. Conclusion
In conclusion, a type of MG-HA was fabricated giving a bimodal synergistic effect of adsorption coupled with catalysis and applied in the removal of MB from aqueous solution. The hybrid aerogel had a large specific surface area and large pore volume. The dual functions of adsorption coupled with catalysis and the synergistic effect were fully exhibited in terms of the removal curves in the presence of H2O2, initial 1.0MG-HA and subsequent H2O2, and both 1.0MG-HA and H2O2. Moreover, a feasible mathematical model was built to be used to simulate the adsorption/catalytic behavior. Finally, the reusability of the adsorbent/catalyst was studied and the results showed that MG-HA can be reused without obvious reduction in the removal capacity. The hybrid aerogel of MOF coupled with graphene provides a feasible way to achieve efficient removal of pollutants such as MB.Conflicts of interest
There are no conflicts to declare.Acknowledgements
This research was supported by the National Natural Science Foundation of China (21571147, 51808414), Hubei Provincial Natural Science Foundation (2017CFB493, 2018CFB108), China Postdoctoral Science Foundation (2017M612520), as well as by the Program of Hubei Provincial Department of Education, China (B2013214, Q20171507).References
- G. Ghanizadeh and G. Asgari, React. Kinet., Mech. Catal., 2011, 102, 127–142 CrossRef CAS.
- J. Wang, G. Zhao, Y. Li, H. Zhu, X. Peng and X. Gao, Dalton Trans., 2014, 43, 11637–11645 RSC.
- N. M. Dobrynkin, M. V. Batygina and A. S. Noskov, Chem Eng Trans., 2010, 23, 339–344 Search PubMed.
- D. Mowla and M. Ahmadi, Biochem. Eng. J., 2007, 36, 147–156 CrossRef CAS.
- A. Chaube and V. K. Gupta, Analyst, 1983, 108, 1270–1279 RSC.
- Y. Fu, T. Huang, L. Zhang, J. Zhu and X. Wang, Nanoscale, 2015, 7, 13723–13733 RSC.
- X. J. Wang, E. F. Chen and Y. Z. Ji, Appl. Mech. Mater., 2013, 361–363, 789–792 Search PubMed.
- X. Wang, Y. Qin, L. Zhu and H. Tang, Environ. Sci. Technol., 2015, 49, 6855–6864 CrossRef CAS PubMed.
- Y. N. Kim, Y. C. Lee and M. Choi, Carbon, 2013, 65, 315–323 CrossRef CAS.
- Q. Yang, Q. Xu and H.-L. Jiang, Chem. Soc. Rev., 2017, 46, 4774–4808 RSC.
- Y. Yanfeng, Q. Zhen-An, P. F. Fulvio, A. J. Binder, T. Chengcheng, C. Jihua, K. M. Nelson, Z. Xiang and D. Sheng, J. Am. Chem. Soc., 2013, 135, 9572–9575 CrossRef PubMed.
- Y. Yue, A. J. Binder, R. Song, Y. Cui, J. Chen, D. K. Hensley and S. Dai, Dalton Trans., 2014, 43, 17893–17898 RSC.
- C. J. Doonan and C. J. Sumby, CrystEngComm, 2017, 19, 4044–4048 RSC.
- M. Yabushita, P. Li, T. Islamoglu, H. Kobayashi, A. Fukuoka, O. K. Farha and A. Katz, Ind. Eng. Chem. Res., 2017, 56, 7141–7148 CrossRef CAS.
- C. Bai, A. Li, X. Yao, H. Liu and Y. Li, Green Chem., 2016, 18, 1061–1069 RSC.
- H. Furukawa and O. M. Yaghi, Science, 2013, 341, 1230444 CrossRef PubMed.
- N. Cai, H. Zeng, J. Fu, V. Chan, M. Chen, H. Li and F. Yu, J. Appl. Polym. Sci., 2018, 135, 46238 CrossRef.
- O. G. Apul, Q. Wang, Y. Zhou and T. Karanfil, Water Res., 2013, 47, 1648–1654 CrossRef CAS PubMed.
- Y. Li, Q. Du, T. Liu, J. Sun, Y. Wang, S. Wu, Z. Wang, Y. Xia and L. Xia, Carbohydr. Polym., 2013, 95, 501–507 CrossRef CAS PubMed.
- Q. Du, J. Sun, Y. Li, X. Yang, X. Wang, Z. Wang and L. Xia, Chem. Eng. J., 2014, 245, 99–106 CrossRef CAS.
- X. Yuan, Y. Wang, J. Wang, C. Zhou, Q. Tang and X. Rao, Chem. Eng. J., 2013, 221, 204–213 CrossRef CAS.
- T. Torres, Chem. Soc. Rev., 2017, 46, 4385–4386 RSC.
- X. Xu, H. Li, Q. Zhang, H. Hu, Z. Zhao, J. Li, J. Li, Y. Qiao and Y. Gogotsi, ACS Nano, 2015, 9, 3969–3977 CrossRef CAS PubMed.
- Z. S. Wu, S. Yang, Y. Sun, K. Parvez, X. Feng and K. Müllen, J. Am. Chem. Soc., 2012, 134, 9082–9085 CrossRef CAS PubMed.
- Q. Han, L. Yang, Q. Liang and M. Ding, Carbon, 2017, 122, 556–563 CrossRef CAS.
- L. Chen, Y. Li, Q. Du, Z. Wang, Y. Xia, E. Yedinak, J. Lou and L. Ci, Carbohydr. Polym., 2017, 155, 345–353 CrossRef CAS PubMed.
- X. Wang, G. Sun, P. Routh, D. H. Kim, W. Huang and P. Chen, Chem. Soc. Rev., 2014, 43, 7067–7098 RSC.
- R. Canioni, C. Roch-Marchal, F. Secheresse, P. Horcajada, C. Serre, M. Hardi-Dan, G. Ferey, J. M. Greneche, F. Lefebvre, J.-S. Chang, Y.-K. Hwang, O. Lebedev, S. Turner and G. Van Tendeloo, J. Mater. Chem., 2011, 21, 1226–1233 RSC.
- K. S. W. Sing, Pure Appl. Chem., 1985, 57, 603–619 CAS.
- R. Liang, R. Chen, F. Jing, N. Qin and L. Wu, Dalton Trans., 2015, 44, 18227–18236 RSC.
- S. Niyogi, E. Bekyarova, M. E. Itkis, H. Zhang, K. Shepperd, J. Hicks, M. Sprinkle, C. Berger, C. N. Lau, W. A. deHeer, E. H. Conrad and R. C. Haddon, Nano Lett., 2010, 10, 4061–4066 CrossRef CAS PubMed.
- S. D. Perera, R. G. Mariano, K. Vu, N. Nour, O. Seitz, Y. Chabal and K. J. B. Jr, ACS Catal., 2012, 2, 949–956 CrossRef CAS.
- T. Muraliganth, A. V. Murugan and A. Manthiram, J. Mater. Chem., 2008, 18, 5661–5668 RSC.
- Y. C. Wong, Y. S. Szeto, W. H. Cheung and G. McKay, J. Appl. Polym. Sci., 2004, 92, 1633–1645 CrossRef CAS.
- Y. S. Ho and G. McKay, Process Biochem., 1999, 34, 451–465 CrossRef CAS.
- S. Veli and B. Alyüz, J. Hazard. Mater., 2007, 149, 226–233 CrossRef CAS PubMed.
Footnotes |
| † Electronic supplementary information (ESI) available. See DOI: 10.1039/c8ra05873c |
| ‡ These authors contributed equally to this work. |
| This journal is © The Royal Society of Chemistry 2018 |


