 Open Access Article
Performance of palm fibers as stationary phase for capillary gas chromatographic separations
Tao Sun,
Hong Chen,
Xiaoguang Qiao,
Lufang Ma ,
Shaoqiang Hu
 * and
Xianming Liu*
College of Chemistry and Chemical Engineering, Henan Province Function-oriented Porous Materials Key Laboratory, Luoyang Normal University, Luoyang 471934, P. R. China. E-mail: shaoqianghu@sina.com; myclxm@163.com
First published on 4th October 2018
Abstract
Herein we report the first example of exploring bio-based materials, palm fibers (PFs), as a stationary phase for capillary gas chromatographic separations. The PFs capillary column was fabricated by the sol–gel coating method and showed a weak polar nature and high column efficiency over 4699 plates per m for n-dodecane, naphthalene and n-octanol. Importantly, the column exhibited high selectivity and resolving capability for more than a dozen mixtures covering a wide-ranging variety of analytes and isomers. In addition, it was applied for the determination of isomer impurities in real samples, proving its good potential for practical gas chromatographic analysis.
1. Introduction
Gas chromatography (GC) is one of the few versatile methods for qualitative and quantitative analysis of complex organic mixtures. The key element of this method is the chromatographic stationary phase. Selectivity of a stationary phase is closely related to its chemical composition and specific intermolecular interactions with solutes.1 To realize effective separation of complex organic mixtures, some new materials with abundant functional groups have been adopted as the GC stationary phase. The abundant functional groups of stationary phases can form rich molecular interactions with solutes, and the resulting synergetic recognition function between the stationary phase and the analyte is the key to realizing effective separation of complex organic mixtures.2–6Nature provides a nearly limitless source for the fabrication of novel bio-based materials with special structures and properties. The biomass resources are mainly from agricultural residues, wood and herbaceous energy crops, and are composed of cellulose (30 to 50%), hemicelluloses (15 to 35%), and lignin (10 to 20%).7 Cellulose and hemicelluloses are saccharides polymer consisting of D-glucose units, and they contain abundant hydroxyl functional group in their molecules.8 Lignin is an aromatic polymer consisting of phenylpropane units with net structure, and it contains abundant oxygen-containing functional groups, such as methoxy (–OCH3), hydroxyl (–OH) and carbonyl (–CO).9 During the past few years, bio-based materials have attracted great interests due to their promising applications in energy storage, catalyst supports, and adsorption.10–12 Their special structures and properties also endow them good candidates as separation materials in separation science. However, no work on the utilization of bio-based materials as stationary phases for GC separation has been reported so far.
Palm trees are widely cultivated in tropical regions of Asia, Africa, and Latin America and are of economic interest for the food industry and for ornamental use.13 PFs as a kind of natural fibers, and renewable resources, has been applied to natural sorbent and renewable energy materials and other fields owing to its abundance and easy accessibility.14–16 The biochemical composition analyses of the PFs were measured as 41.1%, 23.1%, and 34.7% for cellulose, hemicelluloses, and lignin respectively.17 Compared with other natural fibers, PFs has higher lignin content and lower cellulose content. The present study has shown that PFs possessed abundant functional groups, which includes aromatic rings and a variety of oxygen-containing functional groups.17–19
Herein, PFs was first used for GC stationary phase. In this work, the PFs capillary column was fabricated by the sol–gel coating. Then, the PFs capillary column was evaluated in terms of column efficiency, polarity, separation performance and column repeatability. Furthermore, the PFs column was also applied for the detection of isomer impurity in real samples from commercial vendors. This work shows the exploitation the bio-based materials promising for applications related to separation analysis, which may open a door for the new application of the abundant biological resources provided by nature.
2. Experimental
2.1 Materials and equipment
All the chemicals were of analytical grade. Tetraethoxysilane (TEOS), poly(methylhydrosiloxane) (PMHS) and trifluoroacetic acid (TFA, 95%) were purchased from J & K. Scientific. Ltd. (Beijing, China). Polydimethylsiloxane (HO-TOS) 2,4-dimethylpentane, 2,3-dimethylpentane, 2,3,4-trimethylpentane, 2-methylheptane, 3-methylheptane, 2,3-dimethylnaphthalene and 1,2-dimethylnaphthalene were purchased from Alfa Aesar (Heysham, UK). 2,2-dimethylbutane, 2,6-dimethylnaphthalene, 1,3-dimethylnaphthalene and 2,3-dimethylphenol were purchased from TCI (Osaka, Japan). The rest chemicals were from Sun Chemical Technology Co., Ltd (Shanghai, China). All the analytes were dissolved in dichloromethane. Untreated fused-silica capillary tubing (0.25 mm, i.d.) was purchased from Yongnian Ruifeng Chromatogram Apparatus Co., Ltd. (Hebei, China). A commercial HP-5MS capillary column (10 m × 0.25 mm, i.d., 0.25 μm film thickness, 5% phenyl polysiloxane) was purchased from Agilent Technologies.An Agilent 7890A gas chromatograph (Palo Alto, CA, USA) equipped with a split/splitless injector, a flame ionization detector (FID) and an autosampler was used for GC separations. All the separations were performed under the following GC conditions unless otherwise specified: nitrogen of high purity (99.999%) as carrier gas at a flow rate of 0.6 mL min−1, injection port at 300 °C, split injection mode at a split ratio of 60![[thin space (1/6-em)]](https://www.rsc.org/images/entities/char_2009.gif) :
:![[thin space (1/6-em)]](https://www.rsc.org/images/entities/char_2009.gif) 1 and FID as detector at 300 °C. Temperature programs for the separations are listed in the individual figure captions. IR spectra were done on a NICOLET iS 10Fourier transform infrared (FT-IR) spectrometer (Thermo Fisher, USA). Thermogravimetric analysis (TGA) was used on a DTG-60AH instrument (Shimadzu, Japan).
1 and FID as detector at 300 °C. Temperature programs for the separations are listed in the individual figure captions. IR spectra were done on a NICOLET iS 10Fourier transform infrared (FT-IR) spectrometer (Thermo Fisher, USA). Thermogravimetric analysis (TGA) was used on a DTG-60AH instrument (Shimadzu, Japan).
2.2 Synthesis of PFs stationary phase
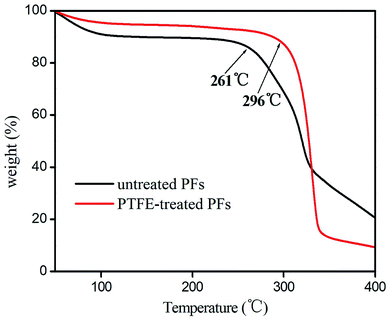
The PFs were stripped from the palm trees, and purged with deionized water several times to remove the dirt, then dried at 80 °C for 12 h. 50 g of the clean PFs were cut into 1–5 cm and placed into NaOH solution (5 mol L−1, 350 mL) in 500 mL of polytetrafluoroethylene (PTFE) stainless steel reaction kettle. The reaction was kept at 150 °C for 16 h and then cooled to room temperature, then the mixture was ultrasonicated at 50 kW of ultrasonic power for 4 h. The PFs was obtained after centrifuged several times by using deionized water until pH was about 7. The obtainment of PFs was confirmed by FT-IR, which was in good agreement with the data in the references.18–20 FTIR (KBr, v/cm−1): 3340 [v(O–H)]; 2970 [v(C–H)]; 1720 [v(C![[double bond, length as m-dash]](https://www.rsc.org/images/entities/char_e001.gif) O)]; 1052 [v(C–O)]. Additionally, the thermal stability of the untreated and PTFE-treated PFs were examined by their TGA curve. As shown in Fig. 1, PTFE-treated PFs exhibit higher thermal stability than untreated PFs, because PFs after activation to remove some of the colloid and impurities. PTFE-treated PFs is thermally stable up to 296 °C, suggesting its good thermal stability as GC stationary phase.
O)]; 1052 [v(C–O)]. Additionally, the thermal stability of the untreated and PTFE-treated PFs were examined by their TGA curve. As shown in Fig. 1, PTFE-treated PFs exhibit higher thermal stability than untreated PFs, because PFs after activation to remove some of the colloid and impurities. PTFE-treated PFs is thermally stable up to 296 °C, suggesting its good thermal stability as GC stationary phase.
2.3 Fabrication of the PFs column
The PFs column was prepared by sol–gel coating method.20–22 Prior to coating, a capillary column (10 m × 0.25 mm, i.d.) was successively pretreated with 1 mol L−1 NaOH and 0.1 mol L−1 HCl, rinsed with ultrapure water and dried overnight at 200 °C under nitrogen. After this, a mixture containing 3 mg PFs and 200 μL TFA were dissolved in 500 μL CH2Cl2 and sonicated for 3 min. Then, a mixture containing 100 μL TEOS, 200 μL HO-TOS and 20 μL PMHS in 500 μL CH2Cl2 was added and sonicated for 5 min. Next, the resulting sol solution was injected into the pretreated capillary column and stayed for 30 min at room temperature. After the excess sol solution was expelled from the column, the column was conditioned from 40 °C held for 30 min to 190 °C at 1 °C min−1 and held at the high-end temperature for 6 h under nitrogen. Afterwards, the as-prepared column was used for the following work. By the same procedure, the blank sol–gel column without PFs was also obtained.3. Results and discussion
3.1 Characterization of the PFs column
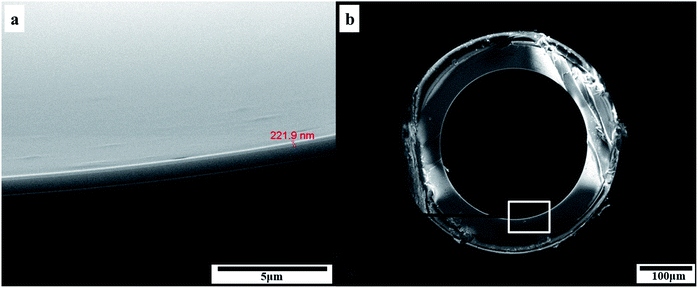
Fig. 2 showed the SEM images of the inner coating of the PFs capillary column. As a result, the surface of the sol–gel coating layer was very well-distributed, and the coating thickness was about 0.2 μm. Additionally, the coating layer with a roughened and wrinkled surface was observed, which could provide enhanced surface area for the solute/stationary phase interactions during GC separations. It can be confirmed the successful formation of sol–gel coating for PFs column. Fig. 3 presented Golay curve of the PFs column determined by n-dodecane, naphthalene and n-octanol at 120 °C, respectively. Notably, the minimum HETP of 0.21 mm at 0.45 mL min−1 (n-dodecane, k = 2.41), 0.20 mm at 0.35 mL min−1 (naphthalene, k = 1.33) and 0.18 mm at 0.50 mL min−1 (1-octanol, k = 1.29) were attained, with the corresponding column efficiency of 4699 plates per m, 5067 plates per m and 5585 plates per m, respectively. The results showed that the PFs column had excellent column efficiency for diverse types of analytes. McReynolds constants were used to characterize the polarity of the PFs stationary phase by using the five probes of benzene (X′), 1-butanol (Y′), 2-pentanone (Z′), 1-nitropropane (U′) and pyridine (S′) at 120 °C.23 As listed in Table 1, the average of the McReynolds constants was 94, suggesting the weak polarity of the PFs stationary phase.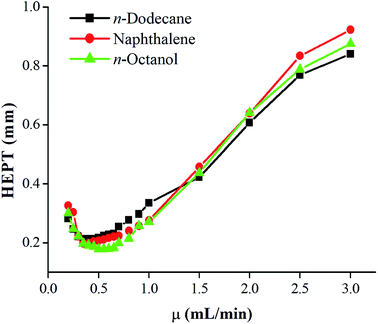 | ||
| Fig. 3 Golay curve of PFs capillary column determined by n-dodecane, naphthalene and n-octanol at 120 °C. | ||
| Stationary phases | X′ | Y′ | Z′ | U′ | S′ | Sum of ΔI | Average polarity |
|---|---|---|---|---|---|---|---|
| a X′, benzene; Y′, 1-butanol; Z′, 2-pentanone; U′, 1-nitropropane; S′, pyridine. Temperature: 120 °C. | |||||||
| I for PFs | 679 | 674 | 795 | 743 | 800 | ||
| I for squalane | 653 | 590 | 627 | 652 | 699 | ||
| ΔI for PFs | 26 | 84 | 168 | 91 | 101 | 471 | 94 |
3.2 Separation capability and retention behaviours
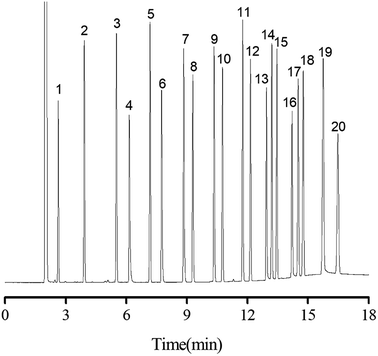
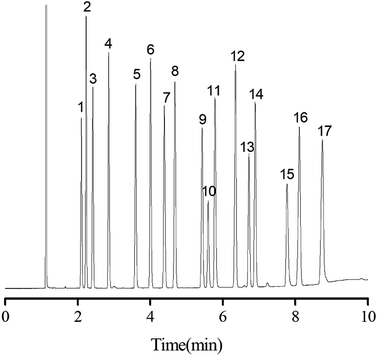
Separation performance of PFs column was evaluated by a mixture of 20 analytes from apolar to polar, a complex mixture of 17 different aromatic aldehydes, one more complex mixture containing 35 analytes of wide variety, the Grob mixture and 12 groups of structural and positional isomers. As shown in Fig. 4, a mixture of 20 analytes from apolar to polar including alkanes, esters, ketones, aldehydes, and alcohols was baseline separated with nice peak shapes (R > 1.5). Peak pairs, such as octane (peak 3; b.p., 125.6 °C)/methyl pentanoate (peak 4; b.p., 126.5 °C), nonane (peak 5; b.p., 151 °C)/methyl caproate (peak 6; b.p., 151 °C) and undecanol (peak 16; b.p., 241 °C)/dodecyl aldehyde (peak 17; b.p., 242 °C) were baseline resolved on the column despite of minor differences between their boiling points. The above results demonstrated the high resolving capability of the PFs column for analytes of broad polarity range. Its advantageous separation performance may be endowed by its diversified molecular interactions involving van der Waals interactions, hydrogen bonding, dipole–dipole interaction and π–π interactions between PFs stationary phase and analytes, which relied on the rich aromatic rings and a wide range of oxygen functional groups in the bio-based fiber, including hydroxyl, epoxy, and carboxyl groups.The aromatic structure of PFs is expected to conducive for enhancing π–π interactions between π-system of the analytes and stationary phase. Consequently, aromatic aldehydes were adopted to characterize the π–π interactions of PFs column. As shown in Fig. 5, a complex mixture of 17 different aromatic aldehydes was effectively separated (R > 1.5), and sharp symmetrical peaks were obtained on the PFs column. The results indicated that the PFs column is suitable for separating aromatic compounds with high boiling point and similar chemical structures. It is attributed to the large delocalized π-electron system and oxygen functional groups of PFs, which provided π–π interaction, hydrogen bonding, and π–π EDA interaction with the analytes.
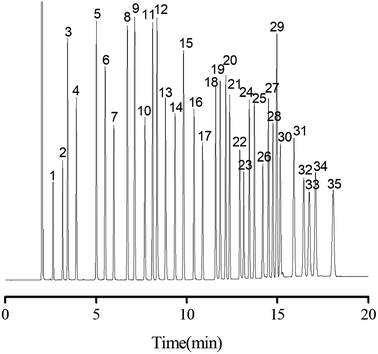
On the basis of the above results, a more complex mixture containing 35 analytes of diverse types, including alkanes, halogenated alkanes, ketone, aldehydes, esters, alcohols, phenols, benzene derivatives and PAHs, was examined in order to fully evaluate the separation performance of the PFs stationary phase. As shown in Fig. 6, all the analytes were baseline resolved (R > 1.5) with good peak shapes within 18 on the column. In addition, most of the analytes in the mixture were eluted in agreement with their increasing boiling points on the column. Noteworthy, benzene (peak 3; b.p., 80 °C) was eluted later due to its stronger π–π interaction with stationary phase than the 1,2-dichloroethane (peak 2; b.p., 83.5 °C), stemming from higher electron cloud density on the carbon ring of benzene. This trend was further evidenced by the later elution of thymol (peak 23; b.p., 232 °C) than that of n-decanol (peak 22; b.p., 232.9 °C), which was against their order of boiling points. Moreover, both n-nonanol (peak 18; b.p., 215 °C; 1.94D) and n-decanal (peak 19; b.p., 209 °C; 3.25D) are linear molecules, but the PFs stationary phase reversed their elution order (the dipole magnitude of n-nonanol and n-decanal was from density functional theory calculations, which were carried out on a Dmol3 program package of Materials Studio 7.0). The strong retention of PFs stationary phase for n-decanal may be ascribed to its strong H-bonding and dipole–dipole interaction with the oxygen groups of PFs. Overall, the above results demonstrated the high-resolution performance of PFs stationary phase for a wide range of analytes. As expected, multiple interactions involving van der Waals interactions, H-bonding, dipole–dipole and π–π interaction existed between PFs and analytes.
The Grob mixture is a well-recognized diagnostic one for the evaluation of the overall chromatographic performance and column activity of a GC column. Some of the analytes are quite tough to be resolved from their adjacent analytes.24 Fig. 7 shows the GC separation of the Grob mixture on the PFs (a), the blank sol–gel (b), and commercial HP-5MS capillary columns (c). Notably, in contrast to the blank sol–gel column, the PFs column exhibited reversal elution for the analyte pairs of 1-octanol/n-undecane (peaks 3/4) and 2-ethylhexanoic acid/2,6-dimethylphenol (peaks 7/8), suggesting the comparatively weaker H-bonding ability of the PFs stationary phase for the alcohol and acid. This may result from the H-bonding interactions of the blank sol–gel column with H-bonding donors due to its residual silanol groups. Additionally, the PFs column achieved good resolution for the Grob mixture whereas the blank sol–gel column coeluted the analytes of 2,3-butanediol/n-decane (peak1/2) and 2,6-dimethylaniline/2,6-dimethylphenol/2-ethylhexanoic acid (peak 6/8/7). Its outstanding resolving capability may derive from its comprehensive molecular interactions, and shows distinct advantages over the blank sol–gel column. In Grob mixture, dicyclohexylamine and 2-ethylhexanoic acid are tough to be well resolved from their adjacent analytes due to their high sensitivity to possible active sites on the column. As can be seen, the PFs column achieved better resolution for the analytes in the mixture than the HP-5MS column that largely overlapped two pairs of them, namely 2-ethylhexanoic acid/2,6-dimethylaniline (peaks 7/6) and dicyclohexylamine/methyl undecanoate (peaks 11/10). In addition, PFs column reversed the elution order of 2,6-dimethyl aniline (peak 7) and 2,6-dimethylphenol (peak 8) in comparison to the HP-5MS column, thereby indicating that the PFs column more strongly retained acidic analytes than alkaline ones. The results obtained above demonstrate the high-resolution performance and unique retention behaviours of the PFs stationary phase for analytes of great variety.
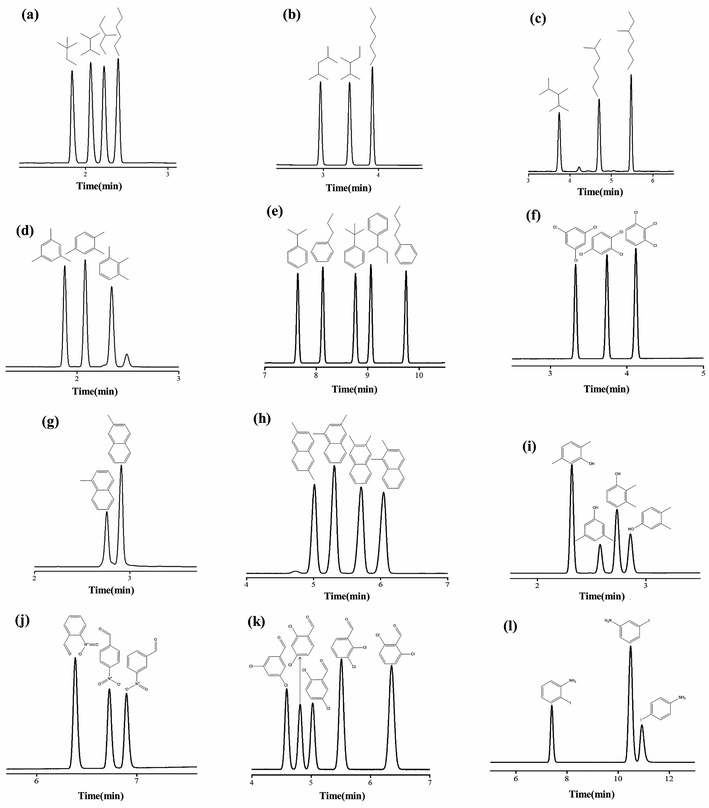
It is challenging to separate compounds with close boiling points and molecular masses, especially positional and structural isomers. In this work, 12 groups of test isomer mixtures consisting of alkanes, alkyl benzenes, halogenated benzenes, phenol, naphthalene and aniline were employed to further evaluate the separation performance of PFs column. As shown in Fig. 8a–l, the PFs stationary phase achieved baseline resolution (R > 1.5) of these isomer mixtures ranging from nonpolar to polar nature with sharp peaks. Fig. 8a–c show the rapid separations of the isomers of C6–C8 alkane. van der Waals interactions may be the major driving force for the separation of alkane isomers on PFs column. Fig. 8d and e exhibit the separations of alkylated benzene isomers, such as trimethylbenzenes and propyl/butylbenzene. The high resolution for these nonpolar isomers demonstrated the extraordinary distinguishing capability of the PFs stationary phase through its van der Waals interactions and π–π stacking with the isomers. Also, the PFs column well resolved the trichlorobenzenes isomers in Fig. 8f mainly due to its integrated effect of halogen-bonding and π–π EDA interactions. As shown in Fig. 8g and h, the PFs column achieved good resolution of methylnaphthalenes and dimethylnaphthalenes. H-bonding and C–H⋯π interactions between the stationary phase and solutes played significant roles and made the stationary phase high sensitive to the compounds of similar structures. Afterwards, its separation capability for the isomers of H-bonding type (phenols, aldehydes and anilines) was explored. The separation results for xylenols, nitrobenzaldehydes, dichlorobenzaldehydes, iodoanilines are presented in Fig. 8g–i, respectively. Noteworthy, the PFs column achieved complete separation of the above isomers that are liable to severe peak-tailing and difficult to be well resolved, and sharp symmetrical peaks were obtained. These results indicated that H-bonding and dipole–dipole interactions between the PFs stationary phase and polar solutes were moderate. In a word, the high resolution originated from the cooperative effect of H-bonding (O–H⋯π, N–H⋯π), dipole–dipole interactions, halogen-bonding (X⋯B, B = O and aromatic π system) and π–π electron-donor/acceptor (EDA) interactions between PFs and isomers with amino, hydroxyl and/or halogen groups and benzene rings.
3.3 Determination of isomer impurities in real samples
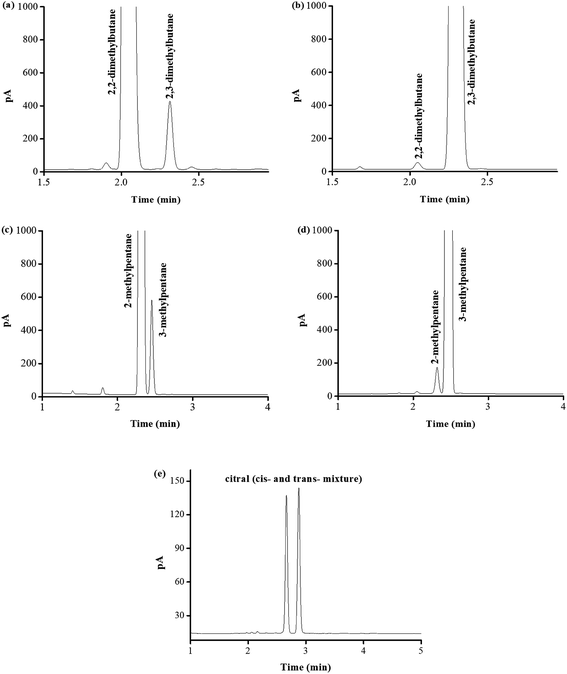
Due to its excellent separation performance for both nonpolar and polar isomers, PFs column was applied to determine the possibly present isomer impurities in the real samples of 2,2-dimethylbutane, 2,3-dimethylbutane, 2-methylpentane, 3-methylpentane, and citral (cis- and trans-mixture) commercially available, as shown in Fig. 9. Table 2 lists their content results by peak area normalization method. The measured purities of the real samples were in good agreement with their label purities. These results demonstrated the good potential of the PFs column for practical applications in GC analysis.| Samples | Labeled purity | Measured purity | Isomer impurity | Content |
|---|---|---|---|---|
| 2,2-Dimethylbutane | >97% | 98.42% | 2,3-Dimethylbutane | 1.23% |
| 2,3-Dimethylbutane | >98% | 99.53% | 2,2-Dimethylbutane | 0.14% |
| 2-Methylpentane | >98% | 98.16% | 3-Methylpentane | 1.70% |
| 3-Methylpentane | >99% | 99.46% | 2-Methylpentane | 0.49% |
| Citral (cis- or trans-) | Unlabeled | 46.42% | Enantiomer | 52.69% |
3.4 Column repeatability
Repeatability and reproducibility of PFs column were investigated by respective separations of the isomer mixtures of methylnaphthalenes, dimethylnaphthalenes and naphthols, and evaluated by relative standard deviation (RSD) on their retention times. The obtained results are summarized in Table 3, showing the RSD values of 0.02–0.03% for run-to-run, 0.05–0.09% for day-to-day and 2.17–3.68% for column-to-column, respectively. These results demonstrate its good column repeatability and reproducibility.| Analytes | Run-to-run (n = 5) | Day-to-day (n = 5) | Column-to-column (n = 3) | |||
|---|---|---|---|---|---|---|
| tR (min) | RSD (%) | tR (min) | RSD (%) | tR (min) | RSD (%) | |
| 2,5-Dimethylphenol | 2.317 | 0.02 | 2.317 | 0.05 | 2.359 | 2.48 |
| 3,5-Dimethylphenol | 2.578 | 0.03 | 2.578 | 0.07 | 2.616 | 2.58 |
| 2,3-Dimethylphenol | 2.735 | 0.03 | 2.737 | 0.07 | 2.795 | 3.09 |
| 3,4-Dimethylphenol | 2.858 | 0.02 | 2.856 | 0.09 | 2.915 | 2.26 |
| Citral (cis- or trans-) | 2.654 | 0.03 | 2.652 | 0.09 | 2.652 | 2.17 |
| Citral (cis- or trans-) | 2.867 | 0.02 | 2.865 | 0.09 | 2.865 | 2.31 |
| 2,6-Dimethylnaphthalene | 5.013 | 0.02 | 5.014 | 0.05 | 5.083 | 2.60 |
| 1,3-Dimethylnaphthalene | 5.308 | 0.02 | 5.310 | 0.06 | 5.411 | 2.81 |
| 2,3-Dimethylnaphthalene | 5.708 | 0.03 | 5.715 | 0.08 | 5.820 | 2.68 |
| 1,2-Dimethylnaphthalene | 6.044 | 0.03 | 6.050 | 0.08 | 6.192 | 3.68 |
4. Conclusion
In this work, we present the first example of bio-based material as stationary phases for capillary GC separations. The PFs column exhibits high column efficiency and excellent resolving capability for a wide range of analytes with sharp symmetrical peaks. In addition, it achieves impressive resolving ability for the polar/nonpolar isomers with aliphatic and aromatic structures. The high resolving capability of the PFs column may be derived from the cooperative effect of van der Waals interactions, H-bonding, dipole–dipole, halogen-bonding and π–π interactions between PFs and analytes. It also has good column repeatability and shows promise for practical applications. This work demonstrates the potential of bio-based materials as new separation materials in separation science.Conflicts of interest
There are no conflicts to declare.Acknowledgements
The authors are grateful for the financial support by National Natural Science Foundation of China (No. 21705072), Henan Province Science and Technology Attack Plan Foundation (No. 172102310477), and Colleges and Universities in Henan Province Key Science and Research Project (No. 17A150039 and 17A150015).References
- C. F. Poole and S. K. Poole, J. Chromatogr. A, 2008, 1184, 254–280 CrossRef CAS PubMed.
- Y. H. Yang, Z. F. Chang, X. H. Yang, M. L. Qi and J. L. Wang, Anal. Chim. Acta, 2018, 1016, 69–77 CrossRef CAS PubMed.
- X. J. Liang, X. D. Hou, J. H. M. Chan, Y. Guo and E. F. Hilder, TrAC, Trends Anal. Chem., 2018, 98, 149–160 CrossRef CAS.
- X. Han, H. Wang, X. X. He, B. Wang and B. Wu, J. Chromatogr. A, 2016, 1468, 192–199 CrossRef CAS PubMed.
- D. Merli, A. Speltini, D. Ravelli, E. Quartarone, L. Costa and A. Profumoa, J. Chromatogr. A, 2010, 1217, 7275–7281 CrossRef CAS PubMed.
- Y. Zhang, M. L. Qi and R. N. Fu, RSC Adv., 2016, 6, 36163–36170 RSC.
- J. M. Cai, Y. F. He, X. Yu, S. W. Bank, Y. Yang, X. G. Zhang, Y. Yu, R. H. Liu and A. V. Bridgwater, Renewable Sustainable Energy Rev., 2017, 76, 309–322 CrossRef CAS.
- D. S. Naidu, S. P. Hlangothi and M. J. John, Carbohydr. Polym., 2018, 179, 28–341 CrossRef CAS PubMed.
- F. H. Isikgor and C. R. Becer, Polym. Chem., 2015, 6, 4497–4559 RSC.
- J. Deng, M. M. Li and Y. Wang, Green Chem., 2016, 18, 4824–4854 RSC.
- P. Chen, L. K. Wang, G. Wang, M. R. Gao, J. Ge, W. J. Yuan, Y. H. Shen, A. J. Xie and S. H. Yu, Energy Environ. Sci., 2014, 7, 4095–4103 RSC.
- S. Ummartyotin and C. Pechyen, Renewable Sustainable Energy Rev., 2016, 62, 654–664 CrossRef CAS.
- S. H. Kong, S. K. Loh, R. T. Bachmann, S. A. Rahim and J. Salimon, Renewable Sustainable Energy Rev., 2014, 39, 729–739 CrossRef CAS.
- O. Abdelwahab, S. M. Nasr and W. M. Thabet, Alexandria Eng. J., 2017, 56, 749–755 CrossRef.
- P. Jairurob, C. Phalakornkule, A. Na-udom and A. Petiraksakul, Fuel, 2013, 107, 282–289 CrossRef CAS.
- C. J. Chen, W. W. Yin, G. C. Chen, G. X. Sun and G. H. Wang, Materials, 2017, 10, 514 CrossRef PubMed.
- C. Li, J. Lin, G. J. Zhao and J. H. Zhang, BioResources, 2016, 11, 1596–1608 CAS.
- M. N. K. Chowdhury, M. D. H. Beg, M. R. Khan and M. F. Mina, Cellulose, 2013, 20, 1477–1490 CrossRef CAS.
- C. J. Chen, G. C. Chen, X. Li, H. Y. Guo and G. H. Wang, Cellulose, 2017, 24, 1611–1620 CrossRef CAS.
- D. X. Wang, S. L. Chong and A. Malik, Anal. Chem., 1997, 69, 4566–4576 CrossRef CAS.
- X. G. Wang, M. L. Qi and R. N. Fu, J. Chromatogr. A, 2014, 1371, 237–243 CrossRef CAS PubMed.
- Y. Zhang, Q. Lv, M. L. Qi and Z. Q. Cai, J. Chromatogr. A, 2017, 1496, 115–121 CrossRef CAS PubMed.
- W. O. McReynolds, J. Chromatogr. Sci., 1970, 8, 685–691 CrossRef CAS.
- Y. F Zhang, M. L. Qi and R. N. Fu, Chin. Chem. Lett., 2016, 27, 88–90 CrossRef.
| This journal is © The Royal Society of Chemistry 2018 |

