 Open Access Article
Study of oxygen tension variation within live tumor spheroids using microfluidic devices and multi-photon laser scanning microscopy†
Sreerupa Sarkarabc,
Chien-Chung Pengb,
Chiung Wen Kuob,
Di-Yen Chuehb,
Hsiao-Mei Wub,
Yuan-Hsuan Liub,
Peilin Chenb and
Yi-Chung Tung *bcd
*bcd
aDepartment of Engineering and System Science, National Tsing Hua University, Hsinchu 30013, Taiwan
bResearch Center for Applied Sciences, Academia Sinica, Taipei 11529, Taiwan. E-mail: tungy@gate.sinica.edu.tw
cTaiwan International Graduate Program (TIGP), Nano Science and Technology Program, Taiwan
dCollege of Engineering, Chang Gung University, Taoyuan 33302, Taiwan
First published on 28th August 2018
Abstract
Three-dimensional cell spheroid culture using microfluidic devices provides a convenient in vitro model for studying tumour spheroid structures and internal microenvironments. Recent studies suggest that oxygen deprived zones inside solid tumors are responsible for stimulating local cytokines and endothelial vasculature proliferation during angiogenesis. In this work, we develop an integrated approach combining microfluidic devices and multi-photon laser scanning microscopy (MPLSM) to study variations in oxygen tension within live spheroids of human osteosarcoma cells. Uniform shaped, size-controlled spheroids are grown and then harvested using a polydimethylsiloxane (PDMS) based microfluidic device. Fluorescence live imaging of the harvested spheroids is performed using MPLSM and a commercially available oxygen sensitive dye, Image-iT Red, to observe the oxygen tension variation within the spheroids and those co-cultured with monolayers of human umbilical vein endothelial cells (HUVECs). Oxygen tension variations are observed within the spheroids with diameters ranging from 90 ± 10 μm to 140 ± 10 μm. The fluorescence images show that the low-oxygenated cores diminish when spheroids are co-cultured with HUVEC monolayers for 6 hours to 8 hours. In the experiments, spheroids subjected to HUVEC conditioned medium treatment and with a cell adherent substrate are also measured and analyzed to study their significance on oxygen tension within the spheroids. The results show that the oxygenation within the spheroids is improved when the spheroids are cultured under those conditions. Our work presents an efficient method to study oxygen tension variation within live tumor spheroids under the influence of endothelial cells and conditioned medium. The method can be exploited for further investigation of tumor oxygen microenvironments during angiogenesis.
Introduction
Three-dimensional (3-D) cell cultures are valuable in studying various aspects of tumor cell biology. Among various 3-D cell culture techniques, cell spheroid culture has received increasing attention. Such culture can be more analogous to live solid tumors, mimicking cell–cell and cell–extracellular matrix (ECM) signalling, proliferation patterns, exposure to nutrition, gases and the surrounding medium. More importantly, it can provide a physiologically meaningful low oxygen tension microenvironment compared to conventional monolayer cultures.1,2 It has been shown that oxygen tension lower than the normal physiological values can trigger oxidative stress and various responding signals within cells.3–6In tumor biology, the oxidative stress induced dynamic responses and early angiogenetic behaviors can be activated when cells have an oxygen tension lower than the physiological ones.7–9 Studies show that early stage tumor growth and angiogenesis are greatly associated with hypoxia-inducible factor (HIF) expression.10,11 In addition, several in vivo studies have investigated hypoxia zones within solid tumors and their relation to angiogenesis.12,13 Furthermore, endothelial cells play a critical role during angiogenesis of tumors in physiological microenvironments.10,14–20 Consequently, study of oxygen tension within the spheroids and the roles of endothelial cells is essential for biologists to better understand the early phase angiogenetic behavior of solid tumors.
Various techniques have been developed for formation and culture of the cell spheroids. For example, hanging drop plates have been shown to be effective in high throughput spheroid culture and analysis.21 Recently, microfluidic devices provide more convenient and powerful platforms for spheroid formation and culture under controlled microenvironments than conventional methods.21–30 Taking advantage of the microfluidic devices, spheroid models relating cellular oxygenation to transcription factors like HIF-1,31 anti-carcinogenic molecules,19,32,33 growth factors20 and associated ligands19,34,35 have been studied in recent years. However, the existing devices have drawbacks, such as limited sample populations and difficulty for collecting samples from the devices, which retard their practical usage for further oxygen tension observation and analysis.
Oxygen plays an important role in various biological activities; however, oxygen tension observation in live 3-D spheroids is challenging due to susceptibility of such systems to physical damage, loss of structural integrity during measurements, and exposure to atmospheric oxygen. Despite recent development of micro-computed tomography,36 electron parametric resonance oximetry,37 immuno-histochemical staining,38 microelectrode-based probes,39,40 and other clinical methods,41 they are invasive and pose concerns of cytotoxicity and cell damage during the observation. In comparison, non-invasive optical methods for oxygen sensing using fluorescence labelling and microscopy techniques are more suitable for studying 3-D spheroid samples.42,43 Nevertheless, these imaging procedures involve fixing the cell spheroids which poses an inconvenience to study 3-D/monolayer mixed co-culture systems,44,45 where cell-substrate adhesion plays a key role in changing cellular activities. For live cell imaging, multiphoton laser scanning microscopy (MPLSM) provides a promising solution for thick samples, like spheroids, with desired resolution and high penetration depth.
In order to better observe oxygen tension within live tumor spheroids under various physiological conditions, we develop an approach by integrating microfluidic devices and MPLSM in this paper. Polydimethylsiloxane (PDMS) devices have been shown to be oxygen permeable, render higher cell proliferation, and decrease core hypoxia and probable necrosis in liver tumor cell spheroids.46 The PDMS oxygen permeability can prevent insufficient oxygenation of the cells that may cause artefacts for the oxygen tension variation observation. In addition, the PDMS microfluidic devices are capable of providing convenient platforms for formation and culture of uniform sized spheroids for various biomedical applications.47–49 In this paper, we take advantage of a previously developed PDMS microfluidic device capable of maintaining equal culture conditions, incubation time, cell seeding concentrations and staining procedures for a large number of uniform sized spheroids.48
In our experiments, uniform sized spheroids of human osteosarcoma cell line (MG-63) are cultured using the microfluidic devices. The spheroids are labelled with an oxygen sensitive fluorescence dye, then harvested and observed using MPLSM, which is non-invasive with less photo-toxicity as desired for live imaging.50 To further demonstrate the capability of the developed approach, the effects of endothelial cells on tumor spheroid oxygen tension variation mimicking their physiological arrangements are also studied. The oxygen tension imaging of the tumor spheroids directly co-cultured with monolayers of endothelial cells is then performed. In addition, the spheroids treated with endothelial cell conditioned medium and spheroids cultured on adherent dishes are also analyzed for investigating their individual effects. The experimental results confirm the capability of the integrated approach for observing variation of oxygen tension within live tumor spheroids, in mono-culture and 3-D/monolayer co-culture systems.
Materials and methods
Fabrication of PDMS spheroid culture chip
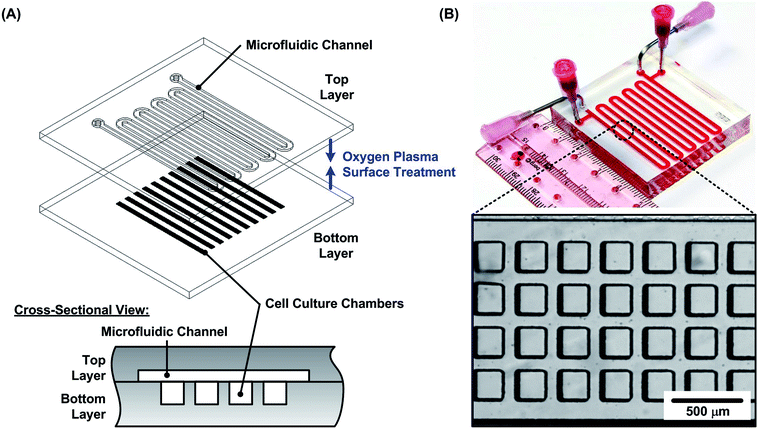
In the experiments, PDMS microfluidic devices are exploited to form and grow the cell spheroids. The device consists of two PDMS layers: a bottom layer with multiple cell culture chambers with dimensions of approximately 200 × 200 × 200 μm3 in width × length × height; and a top layer with one serpentine channel of 240 μm height covering the culture chambers. Two sets of inlets and outlets are made on the top layer. They are connected to blunt needles that can be used to introduce/withdraw cell suspensions, growth medium and other reagents as shown in Fig. 1(A). The device is designed for the formation and culture of 4000 uniform sized spheroids according to the reported protocol.48 Alternative pairs of inlets and outlets are used to seed cells and exchange growth medium to minimize flow disturbances within the culture chambers (one set of inlet and outlet is used at a time while another set is plugged).The microfluidic device is fabricated using soft lithography replica molding process.49 The master molds are first fabricated using negative tone photoresist SU-8 2050 (Micro Chem Co., Newton, MA) patterned on top of silicon wafers by conventional photolithography. The fabricated molds are then silanized with 1H,1H,2H,2H-perfluorooctyltrichlorosilane (78560-45-11, AlfaAesar, Ward Hill, MA) in a desiccator for more than 30 min at room temperature to prevent undesired bonding between the molds and PDMS. PDMS prepolymer (Sylgard 184, Dow Corning Co., Midland, MI) with a 1![[thin space (1/6-em)]](https://www.rsc.org/images/entities/char_2009.gif) :
:![[thin space (1/6-em)]](https://www.rsc.org/images/entities/char_2009.gif) 10 curing agent to base ratio (by weight) is poured on the molds and cured at 60 °C for more than 4 hours in a convection oven. After curing, the inlet and outlet holes are made using a biopsy punch with a diameter of 1.5 mm at the top layer. The bottom layer is aligned and irreversibly bonded to the top layer using oxygen plasma surface treatment at 110 W for 40 s. The PDMS device is then placed in a 60 °C oven overnight for optimized bonding strength and complete curing of the PDMS for better cell compatibility. The photos of the fabricated device are shown in Fig. 1(B).
10 curing agent to base ratio (by weight) is poured on the molds and cured at 60 °C for more than 4 hours in a convection oven. After curing, the inlet and outlet holes are made using a biopsy punch with a diameter of 1.5 mm at the top layer. The bottom layer is aligned and irreversibly bonded to the top layer using oxygen plasma surface treatment at 110 W for 40 s. The PDMS device is then placed in a 60 °C oven overnight for optimized bonding strength and complete curing of the PDMS for better cell compatibility. The photos of the fabricated device are shown in Fig. 1(B).
Cell culture
In the cell experiments, human osteosarcoma cells (MG-63) obtained from Bioresource Collection and Research Center (BCRC), Taiwan are employed for the spheroid formation to mimic solid tumor in vitro. The physioxia state [O2] of osteosarcoma is expected to closely resemble values reported for bone marrow, which is 6.4 ± 0.6%.3,7 In addition, the MG-63 cells are known to form 3-D spheroids within a relative short period and exhibit hypoxia-inducible factor (HIF-1α) expression at relatively small sizes.50,51 The cell culture medium is composed of Minimum Essential Medium (MEM) (Gibco 41090, Invitrogen Co., Carlsbad, CA) with 10% (v/v) fetal bovine serum (FBS) (Heat Inactivated FBS, Gibco 10082, Invitrogen), 1% (v/v) antibiotic-antimitotic (Gibco 15240, Invitrogen), 1% (v/v) sodium pyruvate (Gibco 11360, Invitrogen) and 1% (v/v) non-essential amino acids (Gibco 11140, Invitrogen). For the endothelial cell co-culture experiments, human umbilical vein endothelial cells (HUVEC, C2519A, Lonza, Basel, Switzerland) are used with culture medium consisting of EGM-2 BulletKit Medium (CC-3162, Lonza). The stocks are maintained in T25 cell culture flasks (Nunc 156367, Thermo Scientific Inc., Rochester, NY) in a 37 °C humidified incubator with 5% CO2. 0.25% trypsin–EDTA (Gibco 25200, Invitrogen) and TrypLE Express Enzyme (1X) (Gibco 12604, Invitrogen) are used to dissociate and subculture MG-63 cells and HUVECs, respectively. For consistent experimental results, the HUVECs with passage 4 to 10 are used in all the experiments.Spheroid formation and harvesting
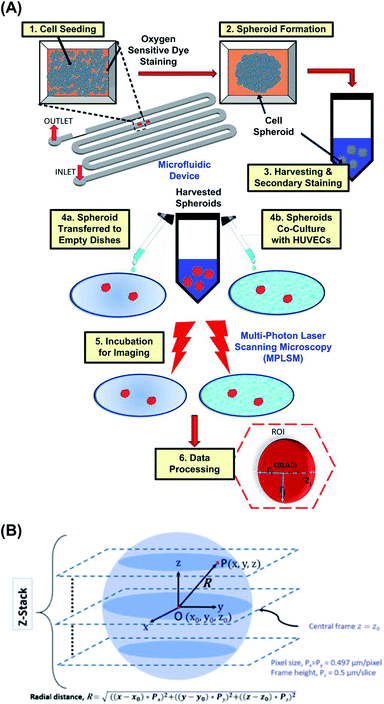
Before the cell culture experiments, the microfluidic channel walls of the PDMS device are made hydrophilic by oxygen plasma treatment at 110 W for 300 s. The channel is then treated with 1% (v/v) Synperonic F-108 (075711, Fluka, Sigma Aldrich, Co., St. Louis, MO, USA) and incubated overnight to make the channel walls resistant to cell adhesion. Prior to cell seeding, the device is sterilized under ultraviolet light (wavelength of 360 nm) for 1 hour and the excess F-108 was washed out of the channels with the MG-63 cell growth medium.Fig. 2(A) shows a schematic flowchart of the experimental procedure. Cell suspensions, with volume of 300 μL and cell density of approximately 2 × 10⁷ cells per mL are introduced into the devices by pipetting cell suspension through the blunt needles for formation of the spheroids with diameters of 120 ± 10 μm. Spheroids with diameters of 90 ± 10 μm and 140 ± 10 μm are formed using the cell suspensions with concentrations of 0.5× and 2× of the aforementioned cell density, respectively. After the cell seeding, the devices are kept in the humidified cell incubator with 5% CO2 at 37 °C. The seeded cells settle down in the culture chambers due to gravity and form 3-D spheroids within 24 hours, in absence of an adherent anchoring substrate. The medium is refreshed every 12 hours using the gravity-driven flow, according to the reported protocol.47 Spheroids are cultured for 56 to 72 hours, before harvesting out of the device. For harvesting, Dulbecco's Phosphate Buffer Saline (DPBS, 14040-133, Gibco, Invitrogen) is flowed through the device and spheroids are collected in 15 mL centrifuge tubes (Falcon™ 14-959-53, Fisher Scientific).48 Spheroids are then dispersed onto non-adherent Petri plates (Anumbra, 632.492.003.060) with growth medium and observed under a microscope to confirm their integrity after harvesting.
Viability assay
To confirm the cell viability of the spheroids, fluorescence based live/dead cytotoxicity assay (LIVE/DEAD Viability/Cytotoxicity kit, L3224, Thermo Scientific Inc., Rochester, NY) is used to stain the formed MG-63 spheroids, obtained after culturing in the device. The live/dead stain solution containing calcein AM (2 μM) and ethidium homodimer-1 (EthD-1) (2 μM) is introduced into the device, and the spheroids are allowed to stain for 45 minutes at room temperature, protected from light. The spheroids are observed using an inverted fluorescence microscope (DMI6000B, Leica Microsystems, Wetzlar, Germany). The viability assay is also performed for the harvested spheroids by using the same dye concentrations and incubation period.To further investigate if the cells within the spheroids are necrotic or apoptotic, a flow cytometry based apoptosis/necrosis assay is performed on the spheroids with diameters of 140 ± 10 μm. After 48 hours culture, the spheroids are harvested, trypsinized with TrypLE Express Enzyme (1X), and then resuspended in DPBS. The staining process of the apoptosis/necrosis assay is conducted according to the reported protocol,47 and the analysis is performed using a commercially available Flow cytometer (BD FACSVerse™, BD Biosciences, NJ).
Estimation of response of reagent to oxygen tensions
In order to investigate the oxygen tension within the spheroids, a commercially available oxygen sensitive fluorescence dye, Image-iT Red oxygen sensitive reagent (H10498, Thermo Scientific Inc., Rochester, NY), is utilized for the experiments. Image-iT Red is a live cell-permeable fluorophore with red fluorescence emission ranging from 515 nm to 645 nm when excited at 450 nm to 500 nm (single photon excitation) in environments with low oxygen tension. Image-iT Red begins to fluoresce when [O2] is less than 5%, and its fluorescence has been shown to be associated with HIF-1α expressions in several cell types.52In order to estimate the fluorescence response of Image-iT Red within the MG-63 cells under different oxygen tensions, the reagent is first tested on monolayer culture of MG-63 cells in a flask. The reagent and Cell Tracker Blue (C2110, Thermo Scientific Inc., Rochester, NY) is prepared with 10 μM final concentration in the medium and the cells are incubated in the staining solution overnight. The culture flask is then rinsed with DPBS three times to remove excess stain, replenished with fresh growth medium and kept in an oxygen-controlled cell incubator set at different oxygen tensions for 1 hour, before the fluorescence imaging.28,29 In the incubator, different [O2] between 1 to 20%, is generated by perfusing nitrogen gas into the incubator. The cells are then observed using the fluorescence microscope and their fluorescent intensities are calculated from the images.
Imaging oxygen tension within spheroids
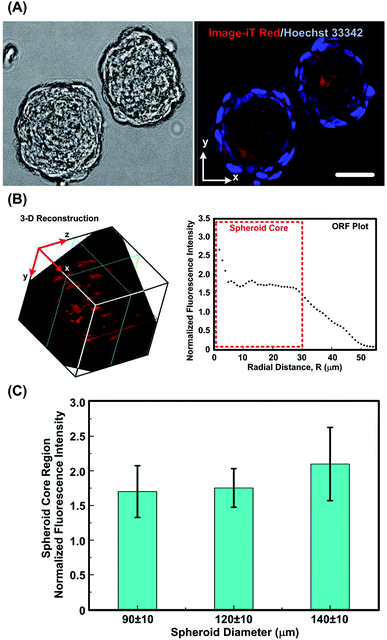
For observing oxygen tension within the cell spheroids, the Image-iT Red oxygen sensitive reagent (10 μM final concentration) is mixed with the cell suspension during seeding of MG-63 cells into the PDMS device. The same dye concentration is maintained within the culture chambers during the growth period by replenishing the dye in the growth medium. This allows all the cells of growing spheroid to have continuous and uniform reagent uptake. Fluorescence from the reagent is then detected by live imaging of spheroids after harvesting from the device using Olympus Fluoview-FVMOE-RS MPLSM. Time dependent imaging and Z-directional scanning is performed to measure the oxygen-responsive fluorescence (ORF) inside the spheroids using 25× (XLPLN25XWMP2, Olympus) water lens of 2.0 mm working distance, sampling speed of 2 μs per pixel and laser excitation at wavelength of 1100 nm for all the experiments.Using the integrated approach, co-culture of the three-dimensional MG-63 cell spheroids and HUVEC monolayer is further performed to study effects of spheroid-endothelial cell interaction on oxygen tension variation. HUVECs are first grown as a monolayer over 3 days in a 60 mm-diameter Petri-dish (Nunc 150288, Thermo Scientific) and stained with the Cell Tracker Blue. One set of harvested spheroids are co-cultured with the confluent HUVEC monolayers for at least 6 hours using 40% MG-63 medium and 60% HUVEC medium. When imaging mono-cultured spheroids, initially a reference dye Hoechst 33342 nucleic acid stain (62249, Thermo Scientific Inc., Rochester, NY) is added, as in Fig. 5(B) to track spatial displacement of the spheroids during imaging. For the MG-63/HUVEC co-culture experiments, no secondary stain is added to spheroids to avoid fluorescence overlap during imaging.
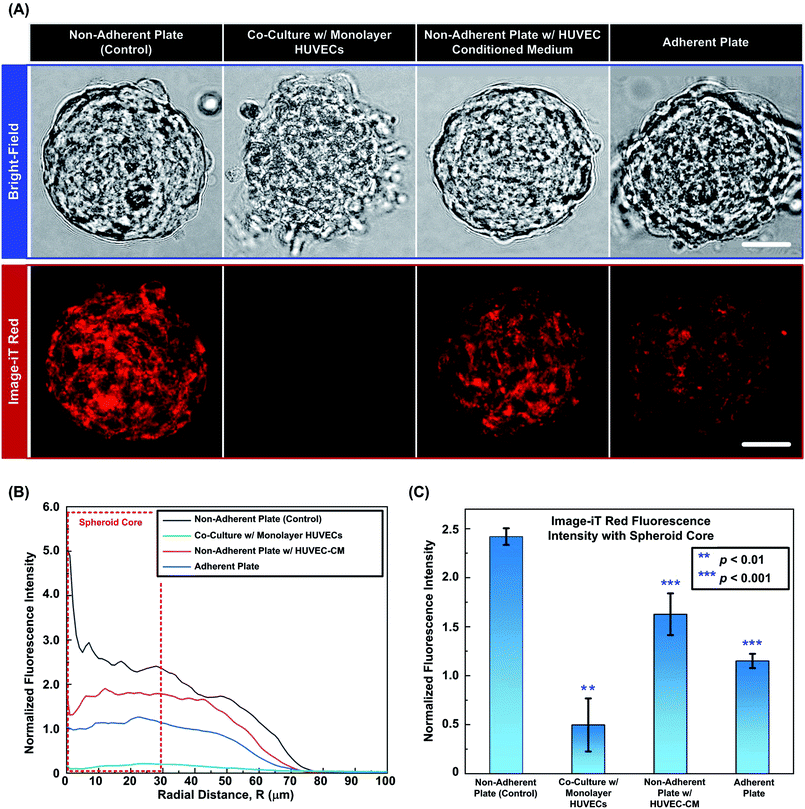
The effects of HUVECs on the spheroids might be from two aspects: (1) effects of cytokines secreted from the HUVECs resulting from endothelial–carcinoma interactions and/or (2) cell–cell/cell–surface adhesion. Therefore, further experiments are performed to evaluate the roles of the aforementioned culture conditions. In the experiments, 4 different conditions are tested and characterized: first (control) and second conditions are mono-cultured spheroids in non-adherent plates (blocking cell-substrate adhesion) and monolayer HUVECs/MG-63 spheroid co-culture, respectively for investigating the direct effects of the endothelial cells on the oxygen tension variation within the spheroids. In the third condition, the spheroids plated on non-adherent plate are treated with conditioned medium from HUVEC cells cultured for one day (HUVEC-CM) mixed with the MG-63 cell growth medium in 3![[thin space (1/6-em)]](https://www.rsc.org/images/entities/char_2009.gif) :
:![[thin space (1/6-em)]](https://www.rsc.org/images/entities/char_2009.gif) 2 (v/v) ratio to study the effects of the cytokines secreted from the endothelial cells. In the fourth condition, the mono-cultured spheroids are plated in adherent Nunc™ Cell Culture/Petri dishes (NUNC, 150288) to test the effects of cell adherence. Results from all four conditions are analyzed by measuring ORF intensities of Image-iT Red reagent within the spheroids obtained from MPLSM imaging.
2 (v/v) ratio to study the effects of the cytokines secreted from the endothelial cells. In the fourth condition, the mono-cultured spheroids are plated in adherent Nunc™ Cell Culture/Petri dishes (NUNC, 150288) to test the effects of cell adherence. Results from all four conditions are analyzed by measuring ORF intensities of Image-iT Red reagent within the spheroids obtained from MPLSM imaging.
Image analysis
To obtain the radial distribution of ORF intensity within a spheroid, an image analysis script is written in MATLAB (R2017b, Ver. 9.3, The MathWorks, Inc.), using 2-D image slices at various z-depth, as illustrated in Fig. 2(B). The center point of the spheroid is denoted as O(x0, y0, z0) at the center frame. At any point P on a single image frame is denoted as P(x, y, z), where x, and y are pixel numbers in x and y directions, respectively; z is the z-directional frame number of the image stacks. The radial distance of regions within spheroid from its approximate center is denoted as R and is calculated by eqn (1).
 | (1) |
Results and discussion
Characterization of oxygen sensitive reagent
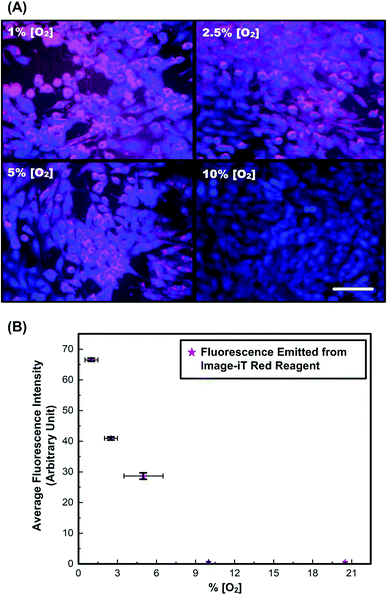
The fluorescence images and ORF intensities measured in monolayers of MG-63 cells under different known [O2] is shown in Fig. 3. The overlaid fluorescence images in Fig. 3(A) of cells stained with Cell Tracker Blue (blue) and Image-iT Red (red) demonstrate visible fluorescence response of the later for oxygen tension lower than 5%. Corresponding plot from Fig. 3(B) shows monotonic increase in fluorescence, by nearly two times when oxygen tension is reduced from 2.5 to 1%. The values obtained are comparable with the reported results in literature.52 The results confirm that the reagent can be exploited for identification of low oxygen tension conditions and detect slight changes in oxygen tension from 5% and below.3,7 Since the solid tumors are typically known to initiate hypoxia-related responses of similar range,31,53 further analysis of oxygen tension variation in 3-D spheroids models are performed using this reagent.Cell spheroid culture and imaging
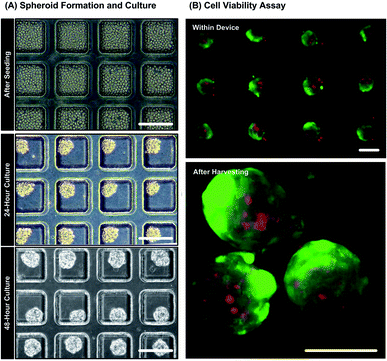
Fig. 4(A) shows bright field microscopic images during spheroid formation of MG-63 cells seeded in the culture chambers of the microfluidic device. Uniform spheroids are formed within 48 hours due to spontaneous cell–cell adhesion promoted by non-adherent channel surfaces. The diameters of the spheroids shown in the Fig. 4(A) are approximately 120 ± 10 μm corresponding to cell seeding concentration of 2 × 10⁷ cells per mL. The results of live/dead cytotoxicity assay on spheroids in the device and after harvest are shown in Fig. 4(B). The fluorescence images show that more than 90% cells are alive with intact cell membrane while growing inside the microfluidic device. The cells possess good viability after harvesting from the devices as well (live cells > 90%). The results confirm that the device is biocompatible and the process of spheroid formation, growth and harvesting cause minimal damage to the MG-63 cells. Moreover, the flow cytometry analysis obtained from the largest spheroids (140 ± 10 μm) show negligibly small necrotic or apoptotic cell population (Fig. S1 in the ESI†). The result suggests the absence of necrotic core within the formed MG-63 spheroids. Since the tendency to form necrotic cores decreases with the decreasing spheroid diameter,39,50 the possibility of necrosis in the smaller spheroids can be negated.Analysis of oxygen tension within monoculture spheroids
Fig. 5(A) shows typical field and fluorescence images of monoculture MG-63 spheroids with diameters of 90 ± 10 μm captured using the MPLSM, followed by the reconstructed 3-D image and the corresponding ORF plot. The spheroids stained with Image-iT (red) and counter stained with Hoechst 33342 (blue) show presence of cells in relative low oxygen tension (<5% [O2]) (corresponding to visible red fluorescence emission around 645 nm). 3-D image reconstructions using an image process analysis software, ImageJ (Ver. 1.51j8, National Institutes of Health, USA) with a volume viewer tool, indicating a dense zone with relative low oxygen tension near the centre of the spheroid. The corresponding calculated intensity along the spherical radius, as found from the ORF plot also emphasizes the presence of oxygen gradient (Fig. 5B). The plot shows a trend of relatively higher fluorescence intensity towards the center of the spheroid, indicating the cells deep inside the spheroid are low on oxygenation.50 The region where maximum fluorescence intensity variations is observed lies within 30 μm radius approximately, for all the spheroids imaged in our study and is attributed to be the core region. The fluorescence intensity falls sharply for peripheral cells, which are in contact with medium at atmospheric oxygen concentration (Fig. 5B).For the spheroids with different sizes, the average ORF intensity within the spheroid region increases with the increase of the spheroid diameter as shown Fig. 5(C). Previous studies have reported that the gaseous microenvironment within a spheroid is largely dependent on its size as diffusion length of oxygen and nutrients increases with increasing spheroid diameter.54,55 The analysis results also show bigger spheroids to be less oxygenated at the core region, although no statistical difference is noted among the results.
Some studies have shown that core hypoxia is typical for large spheroid culture (in vitro growth) with diameters of 160 μm and more.31,39,56 However, MG-63 spheroids (in vitro growth) have been shown to actively express HIF-1α gene even for smaller spheroids sizes.50 Therefore, the smaller spheroid size range investigated in this paper can greatly help investigating dynamic variations in oxygen tension within spheroids under different culture conditions at the initial stages of tumor growth. Moreover, the use of microfluidic device to grow the uniform MG-63 spheroids successfully brings out the intricate variations in oxygen tension even for small differences in size. The smaller size range of MG-63 spheroid (in vitro growth) can be equated with early avascular growth phase of solid tumour (in vivo); where tumors during this early phase remain in diffusion limited microenvironment.10
Co-culture of spheroids and mono-layer endothelial cells
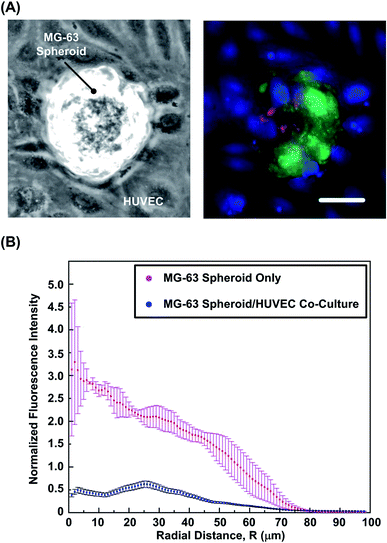
In order to study the effects of endothelium on oxygen tension variation within the spheroids, co-culture of the formed MG-63 spheroids and mono-layer HUVECs is performed in the experiments. First, the viability of MG-63 cells is estimated using the live/dead cytotoxicity assay. Fig. 6(A) shows the bright field and fluorescence images of the spheroids and HUVECs co-culture. The images show similar cell viability (>90%) of the MG-63 cells in the co-culture compared to that of the mono-culture spheroids. The results suggest that the presence of the endothelium has minimum effects on the cell viability within the spheroids. Fig. 6(B) shows the typical ORF intensity profiles within the mono-culture and co-culture spheroids. The analyzed results show approximate six-fold reduction in ORF intensity within the core region in co-culture samples, which indicated the improved oxygenation comparing to the mono-culture spheroids. In previous studies, low oxygen tension within spheroids is shown to play a key role in tumor progression and promotion of angiogenetic cytokines like stromal cell derived factor (SDF), IL-1β, TNF-α and vascular endothelial growth factor (VEGF).57–60 In addition, the oxygenation is also found to be improved by influence of endothelial cells,61 which agrees with the observation in the experiments.Effects of surface interactions and endothelial conditioned medium
To further investigate the possible reasons for the improved oxygenation within the spheroid core regions with the presence of endothelial cells, two sets of experiments are conducted to study the effects of cell adherent and cytokines secreted from endothelial cells. Fig. 7(A) shows the typical bright field and fluorescence images of the representative spheroids with similar sizes (120 ± 10 μm) from four different experimental conditions: (1) spheroids in a non-adherent plate (control); (2) spheroids co-cultured with monolayer HUVECs; (3) spheroids in a non-adherent plate treated with HUVEC-CM and (4) spheroids in an adherent plate. The images show that the spheroid in the control experiment maintains its integrity and shows bright red fluorescence from the Image-iT Red, indicating the relatively low [O2] within the spheroid. In contrast, the spheroid directly co-cultured with the HUVEC monolayer loses its integrity and the cells tend to adhere onto the substrate. For the spheroid treated with HUVEC-CM, the spheroid maintains its integrity similar to that of the spheroid in the control experiments. However, the ORF intensity is slightly lowered than that in the control experiments, showing the increasing of the oxygen tension in core region. For the samples cultured on adherent plate, the peripheral cells show dissociation from the spheroid as those in the co-culture experiment, but the ORF intensity within the spheroid is higher than that of the co-cultured spheroid.For the quantitative analysis, Fig. 7(B) plots the corresponding normalized ORF intensity profiles along radius distances calculated from the fluorescence images of the spheroids shown in Fig. 7(A). Comparing to the control experiments, the ORF intensity of spheroids in direct co-culture with HUVECs is greatly reduced, especially in the core region. In the spheroid treated with HUVEC-CM, the low-oxygenated core region is still observed; however, the overall ORF intensity is higher than that of direct co-culture experiment. In case of spheroids cultured on adherent plates, the cell-substrate adhesion loosens up the 3-D structures allowing diffusion of oxygen from outside to enhance the oxygenation within the core region. Therefore, the ORF intensity values are relatively low compared to those obtained in the control and HUVEC-CM experiments. The results indicate that under the control experimental conditions, the dynamic [O2] profile within the MG-63 spheroids can be imaged in intact 3-D clusters using the developed approach. The oxygen tensions are affected by cytokines and other soluble factors secreted from the HUVECs and the cell adhesion to the substrates. In both conditions, the spheroid oxygenation is increased resulting in the ORF intensity reduction. In direct co-culture, the combined effect of cell adhesion and endothelial cytokines is most prominent resulting in minimal signal from the oxygen sensitive reagent. The results suggest that under the direct co-culture condition, the oxygen tensions within the spheroids are higher than 5%. Fig. 7(C) statistically summarises the average ORF intensities within the spheroid core regions (radius < 30 μm) under the four experimental conditions obtained from different devices. For statistical analysis, two tailed, unpaired Student's T tests are performed. The analysis results suggest that the ORF intensities within the spheroid core regions for the direct co-culture, HUVEC-CM, and the adhesion plate experiments are significantly lower than that in the control experiments.
Conclusion
In this paper, we report an integrated approach to study oxygen tension variation within live tumor spheroids. The approach combines the advantages of microfluidic devices for formation and culture of uniform-sized cell spheroids, along with MPLSM, for three-dimensional imaging of the spheroids harvested from the device with the oxygen sensitive fluorescence dye to investigate the low [O2] conditions within the spheroids. To demonstrate the capability of the approach, the oxygen tension variation observation of the osteosarcoma spheroids formed using MG-63 cells is performed in this paper. In the experiments, the spheroids with different sizes are formed and cultured using the microfluidic devices. The spheroids are then harvested from the devices for the following MPLSM imaging. The results confirm the presence of the low-oxygenated cores within the spheroids with diameters larger than 80 μm and the impeded oxygenation in the spheroids with larger diameters. Furthermore, the spheroids are co-cultured with monolayers of endothelial cells (HUVECs) to study the effects of endothelium on the oxygen tension variation within the spheroids. The results suggest the presence of the endothelial cells greatly improve the oxygenation within the spheroids. In addition, the spheroids treated with HUVEC-CM and plated on an adherent plate are also imaged to investigate their effects. From the images and the analysis, both culture conditions are shown to contribute to the improved oxygenation within the spheroids in degree less than the direct co-culture. The experimental results confirm the capability of the reported approach for observing low oxygen conditions in the live tumor spheroids and also show the possible biomedical applications to study the spheroids cultured under different physiological conditions. The presence of the low oxygen tension zones in the small spheroids of MG-63, and their response to endothelial cells under the studied conditions can shed light on the early onset behaviors of hypoxia related biological responses of solid tumors. Consequently, the approach provides a powerful tool to observe oxygen tension variation within the spheroids that may alter several important biological activities during tumor progression.Conflicts of interest
There are no conflicts to declare.Acknowledgements
This paper is based on work supported by the National Health Research Institutes (NHRI) in Taiwan under Innovative Research Grant (IRG) (EX107-10523EI), the Taiwan Ministry of Science and Technology (MOST 104-2221-E-001-015-MY3, 105-2221-E-001-002-MY2) and the Academia Sinica Career Development Award.References
- S. Breslin and L. O'Driscoll, Drug Discovery Today, 2013, 18, 240–249 CrossRef PubMed.
- W. Espulgar, Y. Yamaguchi, W. Aoki, D. Mita, M. Saito, J.-K. Lee and E. Tamiya, Sens. Actuators, B, 2015, 207, 43–50 CrossRef.
- A. Carreau, B. El Hafny-Rahbi, A. Matejuk, C. Grillon and C. Kieda, J. Cell. Mol. Med., 2011, 15, 1239–1253 CrossRef PubMed.
- S. Joshi, S. Kumar, M. P. Ponnusamy and S. K. Batra, Oncogene, 2016, 35, 5882–5892 CrossRef PubMed.
- F. Mpekris, S. Angeli, A. P. Pirentis and T. Stylianopoulos, Biomech. Model. Mechanobiol., 2015, 14, 1391–1402 CrossRef PubMed.
- L. Ostergaard, A. Tietze, T. Nielsen, K. R. Drasbek, K. Mouridsen, S. N. Jespersen and M. R. Horsman, Cancer Res., 2013, 73, 5618–5624 CrossRef PubMed.
- M. Marenzana and T. R. Arnett, Bone Res., 2013, 1, 203–215 CrossRef PubMed.
- L. Holmquist-Mengelbier, E. Fredlund, T. Löfstedt, R. Noguera, S. Navarro, H. Nilsson, A. Pietras, J. Vallon-Christersson, Å. Borg, K. Gradin, L. Poellinger and S. Påhlman, Cancer Cell, 2006, 10, 413–423 CrossRef PubMed.
- G. Sun and H. Peng, Biosci., Biotechnol., Biochem., 2015, 79, 1232–1239 CrossRef PubMed.
- M. A. J. Chaplain, Math. Comput. Model., 1996, 23, 47–87 CrossRef.
- M. Hockel and P. Vaupel, JNCI, J. Natl. Cancer Inst., 2001, 93, 266–276 CrossRef PubMed.
- G. N. Song, D. B. Darr, C. M. Santos, M. Ross, A. Valdivia, J. L. Jordan, B. R. Midkiff, S. Cohen, N. Nikolaishvili-Feinberg, C. R. Miller, T. K. Tarrant, A. B. Rogers, A. C. Dudley, C. M. Perou and W. C. Zamboni, Clin. Cancer Res., 2014, 20, 6083–6095 CrossRef PubMed.
- C. L. Li, T. Tian, K. J. Nan, N. Zhao, Y. H. Guo, J. Cui, J. Wang and W. G. Zhang, Oncol. Rep., 2008, 20, 1465–1471 Search PubMed.
- G. E. Gortz, M. Horstmann, B. Aniol, B. Delos Reyes, J. Fandrey, A. Eckstein and U. Berchner-Pfannschmidt, J. Clin. Endocrinol. Metab., 2016, 101, 4834–4842 CrossRef PubMed.
- J. S. Lewis, R. J. Landers, J. C. E. Underwood, A. L. Harris and C. E. Lewis, J. Pathol., 2000, 192, 150–158 CrossRef PubMed.
- H. Zhou, Y. H. Yang, N. O. Binmadi, P. Proia and J. R. Basile, Exp. Cell Res., 2012, 318, 1685–1698 CrossRef PubMed.
- S. Kliche and J. Waltenberger, IUBMB Life, 2001, 52, 61–66 CrossRef PubMed.
- C. Regina, E. Panatta, E. Candi, G. Melino, I. Amelio, C. R. Balistreri, M. Annicchiarico-Petruzzelli, N. Di Daniele and G. Ruvolo, Mech. Ageing Dev., 2016, 159, 14–21 CrossRef PubMed.
- M. Topalovski, M. Hagopian, M. Wang and R. A. Brekken, J. Biol. Chem., 2016, 291, 22244–22252 CrossRef PubMed.
- M. Wartenberg, P. Budde, M. de Marees, F. Grunheck, S. Y. Tsang, Y. Huang, Z. Y. Chen, J. Hescheler and H. Sauer, Lab. Invest., 2003, 83, 87–98 CrossRef PubMed.
- Y.-C. Tung, A. Y. Hsiao, S. G. Allen, Y.-s. Torisawa, M. Ho and S. Takayama, Analyst, 2011, 136, 473–478 RSC.
- X. Cui, Y. Hartanto and H. Zhang, J. R. Soc., Interface, 2017, 14, 20160877 CrossRef PubMed.
- D. Wlodkowic and J. M. Cooper, Curr. Opin. Chem. Biol., 2010, 14, 556–567 CrossRef PubMed.
- T. Liu, B. Lin and J. Qin, Lab Chip, 2010, 10, 1671–1677 RSC.
- V. N. Goral, Y.-C. Hsieh, O. N. Petzold, J. S. Clark, P. K. Yuen and R. A. Faris, Lab Chip, 2010, 10, 3380–3386 RSC.
- A. Albanese, A. K. Lam, E. A. Sykes, J. V. Rocheleau and W. C. W. Chan, Nat. Commun., 2013, 4, 2718 CrossRef PubMed.
- P. K. Chaudhuri, M. Ebrahimi Warkiani, T. Jing, Kenry and C. T. Lim, Analyst, 2016, 141, 504–524 RSC.
- G. Khanal, S. Hiemstra and D. Pappas, Analyst, 2014, 139, 3274–3280 RSC.
- Y. Wang and J. Wang, Analyst, 2014, 139, 2449–2458 RSC.
- M. H. Wu, J. P. G. Urban, Z. Cui and Z. F. Cui, Biomed. Microdevices, 2006, 8, 331–340 CrossRef PubMed.
- J. P. Piret, C. Lecocq, S. Toffoli, N. Ninane, M. Raes and C. Michiels, Exp. Cell Res., 2004, 295, 340–349 CrossRef PubMed.
- Q. Z. Zhang, A. L. Nguyen, S. H. Shi, C. Hill, P. Wilder-Smith, T. B. Krasieva and A. D. Le, Stem Cells Dev., 2012, 21, 937–947 CrossRef PubMed.
- A. K. Abdel-Aziz, S. Shouman, E. El-Demerdash, M. Elgendy and A. B. Abdel-Naim, Chem.-Biol. Interact., 2014, 217, 28–40 CrossRef PubMed.
- M. Zhang and L. Jiang, Exp. Ther. Med., 2016, 12, 3742–3748 CrossRef PubMed.
- B. Borjan, N. Steiner, S. Karbon, J. Kern, A. Francesch, M. Hermann, W. Willenbacher, E. Gunsilius and G. Untergasser, BMC Cancer, 2015, 15, 15 CrossRef PubMed.
- T. Y. Lee, T. G. Purdie and E. Stewart, Q. J. Nucl. Med. Mol. Imaging, 2003, 47, 171–187 Search PubMed.
- L. M. Langan, N. J. Dodd, S. F. Owen, W. M. Purcell, S. K. Jackson and A. N. Jha, PLoS One, 2016, 11, e0149492 CrossRef PubMed.
- B. M. Fenton, S. F. Paoni, J. Lee, C. J. Koch and E. M. Lord, Br. J. Cancer, 1999, 79, 464 CrossRef PubMed.
- A. V. Aleksandrova, N. P. Pulkova, T. N. Gerasimenko, N. Y. Anisimov, S. A. Tonevitskaya and D. A. Sakharov, Bull. Exp. Biol. Med., 2016, 160, 857–860 CrossRef PubMed.
- W. Muellerklieser, Biophys. J., 1984, 46, 343–348 CrossRef.
- D. R. Grimes, D. R. Warren and S. Warren, Br. J. Radiol., 2017, 90, 20160939 CrossRef PubMed.
- R. I. Dmitriev and D. B. Papkovsky, Methods Appl. Fluoresc., 2015, 3, 034001 CrossRef PubMed.
- R. I. Dmitriev, A. V. Zhdanov, G. Jasionek and D. B. Papkovsky, Anal. Chem., 2012, 84, 2930–2938 CrossRef PubMed.
- R. Leek, D. R. Grimes, A. L. Harris and A. McIntyre, in Tumor Microenvironment: Study Protocols, ed. C. Koumenis, L. M. Coussens, A. Giaccia and E. Hammond, 2016, vol. 899, pp. 167–196 Search PubMed.
- F. Hirschhaeuser, H. Menne, C. Dittfeld, J. West, W. Mueller-Klieser and L. A. Kunz-Schughart, J. Biotechnol., 2010, 148, 3–15 CrossRef PubMed.
- T. Anada, J. Fukuda, Y. Sai and O. Suzuki, Biomaterials, 2012, 33, 8430–8441 CrossRef PubMed.
- B. Patra, C. C. Peng, W. H. Liao, C. H. Lee and Y. C. Tung, Sci. Rep., 2016, 6, 21061 CrossRef PubMed.
- B. Patra, Y. S. Peng, C. C. Peng, W. H. Liao, Y. A. Chen, K. H. Lin, Y. C. Tung and C. H. Lee, Biomicrofluidics, 2014, 8, 052109 CrossRef PubMed.
- C. C. Peng, W. H. Liao, Y. H. Chen, C. Y. Wu and Y. C. Tung, Lab Chip, 2013, 13, 3239–3245 RSC.
- P. Indovina, M. Collini, G. Chirico and M. T. Santini, FEBS Lett., 2007, 581, 719–726 CrossRef PubMed.
- P. Indovina, G. Rainaldi and M. T. Santini, Anticancer Res., 2008, 28, 1013–1022 Search PubMed.
- S. J. Zhang, M. Hosaka, T. Yoshihara, K. Negishi, Y. Iida, S. Tobita and T. Takeuchi, Cancer Res., 2010, 70, 4490–4498 CrossRef PubMed.
- T. Das, T. K. Maitia and S. Chakraborty, Integr. Biol., 2011, 3, 684–695 RSC.
- K. C. Murphy, B. Hung, S. Browne-Bourne, D. J. Zhou, J. Yeung, D. C. Genetos and J. K. Leach, J. R. Soc., Interface, 2017, 14, 10 CrossRef PubMed.
- J. H. Lee, Y. S. Han and S. H. Lee, Biomol. Ther., 2016, 24, 260–267 CrossRef PubMed.
- J. H. Sung and M. L. Shuler, Lab Chip, 2009, 9, 1385–1394 RSC.
- K. Iwai, H. Ishikura, M. Kaji, H. Sugiura, A. Ishizu, C. Takahashi, H. Kato, T. Tanabe and T. Yoshiki, Int. J. Cancer, 1993, 54, 972–977 CrossRef PubMed.
- D. Lauri, L. Needham, I. Martinpadura and E. Dejana, J. Natl. Cancer Inst., 1991, 83, 1321–1324 CrossRef PubMed.
- R. Giavazzi, M. Foppolo, R. Dossi and A. Remuzzi, J. Clin. Invest., 1993, 92, 3038–3044 CrossRef PubMed.
- M. ten Kate, L. J. Hofland, W. M. van Grevenstein, P. V. van Koetsveld, J. Jeekel and C. H. van Eijck, Int. J. Cancer, 2004, 112, 943–950 CrossRef PubMed.
- S. H. Kim, H. Kim, H. J. Ku, J. H. Park, H. Cha, S. Lee, J. H. Lee and J. W. Park, Redox Biol., 2016, 10, 211–220 CrossRef PubMed.
Footnote |
| † Electronic supplementary information (ESI) available. See DOI: 10.1039/c8ra05505j |
| This journal is © The Royal Society of Chemistry 2018 |

