 Open Access Article
A cross-linking strategy with moderated pre-polymerization of resin for stereolithography
Rongping Ni a,
Bin Qian*a,
Chang Liub,
Xiaofeng Liub and
Jianrong Qiu
 *a
*a
aState Key Laboratory of Modern Optical Instrumentation, School of Optical Science and Engineering, Zhejiang University, Hangzhou, Zhejiang, China. E-mail: qjr@zju.edu.cn
bSchool of Materials Science and Engineering, Zhejiang University, Hangzhou, Zhejiang, China
First published on 21st August 2018
Abstract
Compared with parts fabricated via traditional methods, such as injection or compression molding, polymeric parts produced by 3D stereolithography (SLA) have poorer mechanical properties. Here, we demonstrate a cross-linking strategy used in the coating field to attain long chains for resin pre-polymerization to obtain final resin parts which can expand the application of SLA. Isophorone diisocyanate (IPDI), 2-hydroxyethyl methacrylate (HEMA) and polyethylene glycol (PEG)-based prepolymer have long chains, making it easier for them to form dense structures. However, the prepolymer has high viscosity and can solidify in the absence of a laser. Thus, three kinds of adjuvants were added to dilute the prepolymer to make the slurry suitable for 3D-printing. Slurries were cured with different laser powers and scanning speeds. Diluents are found to affect the curing properties differently. With the diluent 2-hydroxyethyl acrylate added into the prepolymer, shrinkage of printed parts is lower than 1.3%. With the diluent ethylene glycol monophenyl ether, the density range of printed parts is between 1.187 g cm−3 and 1.195 g cm−3, which is higher than that of commercial PVC and PET. The three resins vary in density and hardness within a small range when the scanning speeds change. A relatively flat surface, high density and hardness can be obtained when the laser power is at 195.5–350 mW. Resin with this cross-linking strategy can expand the underutilized stereolithography's application from prototyping to actual parts by producing more functional components with excellent performance.
Introduction
In contrast to traditional subtractive manufacturing (the process of removing materials from a bulk monolith to form a part), additive manufacturing (AM) can create more complex geometries i.e. inner holes, porous structures and micro-structures.1–10 Due to the growing popularity of AM and the gradual expanding of its application scope, stereolithography (SLA) as the most versatile method with high accuracy and precision has attracted increasing attention. SLA is based on a liquid resin photocuring process wherein liquid resin (a blend for polymerization or cross-linking) is placed in a reservoir. A positionally programmed laser scans over the resin surface to initiate photo-polymerization, and this cures the resin and converts it from liquid to solid often via a chemical crosslinking process.11 The laser intensity required to initiate such a photo-polymerization process is rather low, typically between 10 mW to 1 W, which is economically attractive. SLA is now often used in industrial and medical sectors,1,3,4,6,12,13 which is still underutilized as an industrial process. It can only manufacture limited functional parts, which limits its application from prototyping to the actual parts, and only a very small group utilize SLA for the production of final parts. Thus, there is a need to continuously improve existing processes and materials. The industry and academia have been extensively pressed to design and produce resin with different mechanical properties.7,9,10,13–17 Here, we employ a modified a cross-linking strategy which has been widely used in coating technology18,19 to produce functional parts for 3D printing industry. In the fabrication of polymer coating, one of the strategies is to allow isocyanates to react with hydroxyl compounds to get radiation curable coating slurries.20–23 The polyurethane resin, made of, e.g., IPDI, has excellent higher surface energy, photo-stability and chemical resistance and it is commonly used in paints, coatings, printing stamps and adhesion agents.22,24,25 HEMA is one of poly-acrylate derivates among acrylate-based resin, and acrylate-based monomers are used widely because of their low cytotoxicity and high heat resistance, while acrylate-based resin is prone to have a slower curing rate. Multifunctional monomers are applied to introduce more crosslinking sites, accelerate the curing rate and enhance the mechanical properties of the cured resin.Experimental
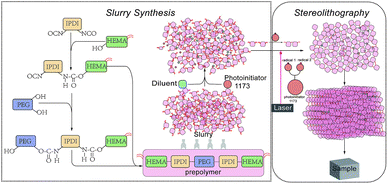
Materials and preparation of the slurry
Most raw materials were obtained from Aladdin Corporation Company (Shanghai, China). The prepolymer was made from 2-hydroxyethyl methacrylate (HEMA), isophorone diisocyanate (mixture of isomers) (IPDI) and polyethylene glycol (PEG, average Mn 300) and the principle of pre-polymerization and slurry synthesis is shown in Fig. 1. First, we added isophorone diisocyanate (IPDI) and 2-hydroxyethyl methacrylate (HEMA) to start first step of the pre-polymerization, ditin butyl dilaurate (DBTDL) and 2,6-di-tert-butyl-4-methylphenol (BHT) were used as a catalyst which allows the reaction to take place at a rapid rate at lower temperatures19 and a polymerization inhibitor during the pre-polymerization, respectively. Then we added PEG which reacted with the unreacted IPDI in the previous step. It is not advisable to add the HEMA and PEG in reverse order, because PEG has long chains which would make the slurry obtained in first step thicker and the distance between the unreacted groups further. The above two reactions are exothermic; therefore, HEMA and PEG have to be added dropwise under constant stirring. As the viscosity of the pre-polymerization slurry was too sticky for SLA, it is necessary to add diluents agents to modify the viscosity of the resin to achieve proper wetting and impregnating behavior for printing. We used three different diluents, ethylene glycol, ethylene glycol monophenyl ether and 2-hydroxyethyl acylate, and they can be divided into three different types, as shown in Table 1. We tried different diluent concentrations and found that 20 wt% was optimal. With the addition of diluents, the slurries could be cured and demonstrated good printing quality. Different diluents also result in different properties of the final products. Variations of the end groups and functionality of the diluents can tailor the properties of a resin for different applications. The photo-initiator is 2-hydroxy-2-methylpropiophenone (photo-initiator 1173) which can be activated by ultraviolet (UV) light radiation. Tinuvin 1130 is an UV light absorbent obtained from BASF Corporation Company (Florham Park, NJ, USA) to absorb excess UV light and control extra solidification during stereolithography. The reaction mixture was not purified.| Type 1 | Ethylene glycol |
| Type 2 | Ethylene glycol monophenyl ether |
| Type 3 | 2-Hydroxyethyl acrylate |
Viscosity
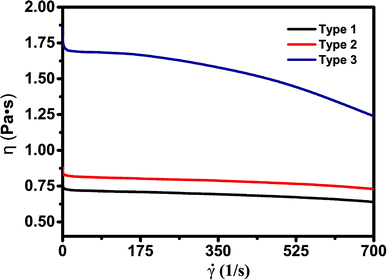
Viscosity is an important parameter to ensure good quality of SLA-printed parts. When the scarper forms a new layer, it is necessary to wait until the resin surface becomes completely flat in order to have accurate thickness control. Low-viscosity slurries are usually preferred as they allow better resin flow to replenish each layer during printing and also make handling easy (refilling and cleaning the resin tank more convenient). In practice, the resin should have a viscosity of less than 5 Pa s to achieve stable SLA printing. However, low-viscosity slurries may yield high shrinkage and affect the quality of finished products. The slurry viscosity was measured before SLA using a German HAAKE RS6000 rotational rheometer at the temperature of 30 °C. Fig. 2 shows the rheological characterization of the slurries.![[small gamma, Greek, dot above]](https://www.rsc.org/images/entities/i_char_e0a2.gif) is the shear rate. η is the viscosity, equal to the shear stress on the unit area per unit of velocity gradient, which reflects the flow resistance generated by the interaction between the liquid molecules.26 The red, black and blue lines represent type 1, type 2 and type 3 respectively. The polymer slurries show obvious non-Newtonian fluid behavior at 30 °C and the viscosity decreases with the increase of shear rate, which is sometimes called as pseudoplastic fluid.26 It has been proposed that the entanglements in the materials are the cause of their non-Newtonian features, as the structure of the flow system changes under shear stress. The viscosity of the three slurries was all smaller than 1.9 Pa s which is suitable for stencil, screen, and dispenser printing methods. The slurry with the diluent ethylene glycol (type 1) has the lowest viscosity (0.6–0.7 Pa s). The viscosity of the slurry with 2-hydroxyethyl acrylate (type 3) is 1.2–1.7 Pa s, much larger than that of type 1 and type 2. The most likely cause for this condition is that the type 3 slurry has the highest concentration of hydrogen bonds and/or strongest polar interaction of –OCONH– groups among these slurries. The resin slurries are not air-sensitive. Therefore, we don't need to store or use them under inert or N2 atmosphere and 3D printing can be done in ambient atmosphere.
is the shear rate. η is the viscosity, equal to the shear stress on the unit area per unit of velocity gradient, which reflects the flow resistance generated by the interaction between the liquid molecules.26 The red, black and blue lines represent type 1, type 2 and type 3 respectively. The polymer slurries show obvious non-Newtonian fluid behavior at 30 °C and the viscosity decreases with the increase of shear rate, which is sometimes called as pseudoplastic fluid.26 It has been proposed that the entanglements in the materials are the cause of their non-Newtonian features, as the structure of the flow system changes under shear stress. The viscosity of the three slurries was all smaller than 1.9 Pa s which is suitable for stencil, screen, and dispenser printing methods. The slurry with the diluent ethylene glycol (type 1) has the lowest viscosity (0.6–0.7 Pa s). The viscosity of the slurry with 2-hydroxyethyl acrylate (type 3) is 1.2–1.7 Pa s, much larger than that of type 1 and type 2. The most likely cause for this condition is that the type 3 slurry has the highest concentration of hydrogen bonds and/or strongest polar interaction of –OCONH– groups among these slurries. The resin slurries are not air-sensitive. Therefore, we don't need to store or use them under inert or N2 atmosphere and 3D printing can be done in ambient atmosphere.
Manufacturing process
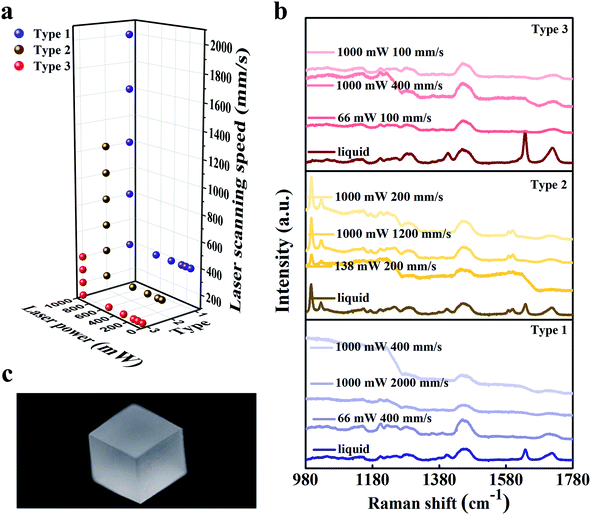
The SLA printing machine used the bottom-up approach and the scanning of the UV laser was controlled by a computer. The laser wavelength is 355 nm which can activate the photo-initiator 1173. During printing, the liquid slurry was placed in a reservoir, and a movable platform which was designed to hold the printing products was initially set in a position wherein only a thin layer of resin (≤0.1 mm) was exposed on the surface. A laser scanned the exposed resin to create a cured layer with a 2D pattern. After printing one layer, the build platform moved 0.1 mm downwards (axis resolution), and a scraper provided a new layer of resin slurry. During this step of layer coating, the cure depth should be greater than the resin layer thickness (0.1 mm) to get strong interlayer adhesion. We also adjusted the software to match the viscosity of the slurries and studied the effect of scanning laser intensity and scanning speed on printing quality.Square samples were 3D-printed with size of 10 mm × 10 mm × 10 mm, as shown in Fig. 3(c). By adjusting the scanning speed and laser power, we found that the three kinds of slurry had different typing ranges as shown in Fig. 3(a). There are six laser power points: 1000 mW, 580 mW, 350 mW, 196 mW, 138 mW and 66 mW. When the laser power was 1000 mW, the maximum scanning speeds of type 1, type 2 and type 3 were 2000 mm s−1, 1200 mm s−1 and 400 mm s−1 respectively. When the scanning speed of laser was over 2000 mm s−1, the unfinished product of type 1 with the diluent ethylene glycol was a cube that hasn't been completely cured inside. This is because the laser was not able to cure the resin to form one resin layer. The type 2 and type 3 slurries could be cured into a layer when the scanning speed exceeded 1200 mm s−1 and 400 mm s−1. Nevertheless, the cured layer was scraped away due to the high viscosity. With the increase in viscosity, it becomes difficult for our current machine scraper to stabilize the liquid level, which led to failure of printing multilayer parts. During the experiment, the scanning speeds were also fixed to explore the relationship between the quality of printed samples and laser intensity. During SLA, when the laser power was smaller than 66 mW, 138 mW and 66 mW in printing type 1, type 2 and type 3 respectively, the square parts could not be formed suggesting that when the laser intensity was not enough to cure the slurry of these types or the performance of the cured resin layer was too weak to form a multilayer part. Strong interlayer adhesion was not achieved to ensure the cure depth greater than resin layer thickness. After printing, the resultant samples were then manually agitated in an isopropyl alcohol (IPA) bath for 2 min and were left immersed in IPA for another 3 min to remove any unreacted resin. The finished samples were then exposed to air in room temperature for 20 days to examine possible moisture absorption and contamination.
Statistical analysis
From the chemistry point of view, during photo-initiation, the radicals generated by photo-initiator attack the functional groups (C![[double bond, length as m-dash]](https://www.rsc.org/images/entities/char_e001.gif) C) in the pre-polymer slurry, which open up and connect to each other, forming long chains. Finally, the changes in structure solidify the resin. This behavior was monitored using a Horiba HR Evolution Raman spectrometer using the 532 nm laser for excitation. Liquid slurries and a portion of the solid samples were tested to examine the curing process of the resin as shown in Fig. 3(c). Type 2 slurry has different Raman peaks around 997 cm−1, 1027 cm−1, 1587 cm−1 and 1600 cm−1 compared with that of type 1 and type 3 resin, which indicates the presence of benzene ring structure and its linkage with –OH. The characteristic absorption peaks of the functional groups are detected during the synthesis reactions. The Raman peaks around 1640 cm−1 and 1720 cm−1 are observed in the liquid resin, but the peaks vanish in the solid. This significant change is well consistent with the pre-polymerization process which is accompanied by the vanishing of C
C) in the pre-polymer slurry, which open up and connect to each other, forming long chains. Finally, the changes in structure solidify the resin. This behavior was monitored using a Horiba HR Evolution Raman spectrometer using the 532 nm laser for excitation. Liquid slurries and a portion of the solid samples were tested to examine the curing process of the resin as shown in Fig. 3(c). Type 2 slurry has different Raman peaks around 997 cm−1, 1027 cm−1, 1587 cm−1 and 1600 cm−1 compared with that of type 1 and type 3 resin, which indicates the presence of benzene ring structure and its linkage with –OH. The characteristic absorption peaks of the functional groups are detected during the synthesis reactions. The Raman peaks around 1640 cm−1 and 1720 cm−1 are observed in the liquid resin, but the peaks vanish in the solid. This significant change is well consistent with the pre-polymerization process which is accompanied by the vanishing of C![[double bond, length as m-dash]](https://www.rsc.org/images/entities/char_e001.gif) C bonds and formation of long aliphatic chains. The sharp decline segments in curves can be ascribed to the impact of the pits on the sample surface that affect the intensity of the light radiation detected by the Raman Spectrometer.
C bonds and formation of long aliphatic chains. The sharp decline segments in curves can be ascribed to the impact of the pits on the sample surface that affect the intensity of the light radiation detected by the Raman Spectrometer.
A focused ion beam scanning electron microscopy (SEM) was used in characterizing the surface morphology of the samples. The SEM operated at an acceleration voltage of 3 kV. The samples (type 3, 1000 mW, 100 mm s−1) were placed onto a carbon tape and sputtered with gold particles prior to analysis. Fig. 4 illustrates the morphologies of the front and side surfaces of unpolished and polished resin samples. It can be found in Fig. 4(a) that the typical front surface of the unpolished resin sample is rough. However, compared with the striated side surface in Fig. 4(b), the front surface is relatively smooth. The slurry absorbs UV laser and becomes solidified into one layer, but the scattering of the UV laser also causes the edge of the scanning path to solidify, as shown in the central part in Fig. 4(b). In Fig. 4(c) and (d), the front and side surfaces of the polished samples have fine pores and flat smooth surfaces, and the two polished surfaces are very similar.
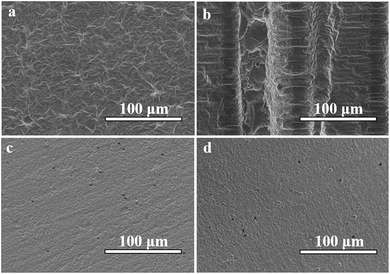 | ||
| Fig. 4 SEM images of an unpolished resin sample (type 3, 1000 mW, 100 mm s−1). (a) The front surface of the resin sample; (b) and (c) the side surface of the resin sample. | ||
The volume shrinkage is an important physical property of photosensitive resin. The volume shrinkage ratio is closely related with the internal stress of the curing parts: when the shrinkage of the curing parts is large, the internal stress is large too and the fabricated parts can be easily warped. Photosensitive resin solidified with small volume shrinkage has less internal stress, such that the forming parts are not easily to be distorted by warping and the precision is higher. After the possible moisture absorption and contamination, the parts were measured by an electronic vernier caliper. The lengths of type 1 rectangle samples are between 9.06 mm and 9.80 mm, the shrinkage changes a lot with the changing of laser power and scanning speed. The length range of type 2 is between 9.49 mm and 9.79 mm and its average shrinkage is smaller than that of type 1. The shrinkage of type 3 is very small, their length range is between 9.87 mm and 10.00 mm. The shrinkage of the type 3 resin is smaller than 1.3%, which is very suitable for high precision manufacturing.
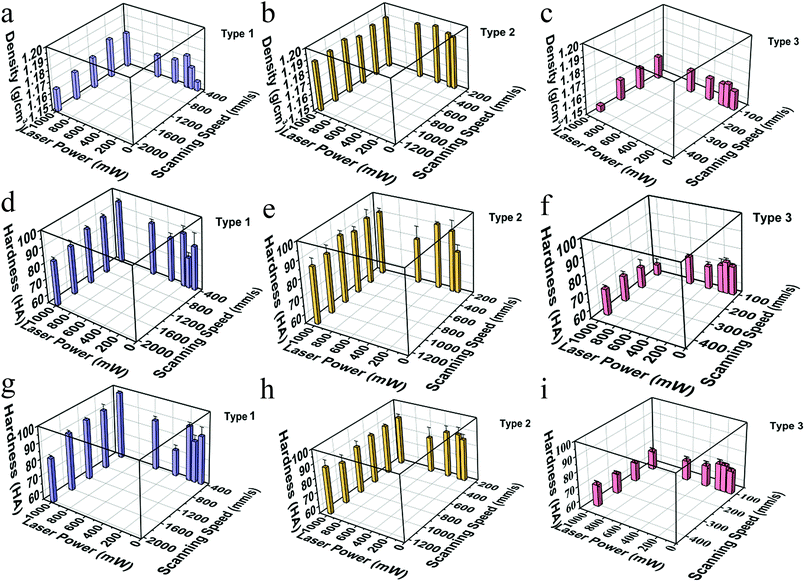
Resin density was measured by the Archimedes method using water as the immersion liquid as shown in Fig. 5(a)–(c). The density range of type 1 changes between 1.15 g cm−3 and 1.18 g cm−3 and the density range of type 3 was between 1.15 g cm−3 and 1.16 g cm−3. Density of all type 2 resin samples was around 1.19 g cm−3, which was close to PC density (1.20–1.22 g cm−3) and higher than the density of PVC (1.19–1.35 g cm−3) and PET (1.29–1.41 g cm−3). The variation of sample density with different scanning speeds is small and the density changes like a sinusoidal curve with the laser intensity increasing, going up first, then going down, and finally going up.
Hardness of samples was measured by Shaw rubber hardness tester A. The hardness of the front and side surfaces for all samples with varying diluents is presented in the second row and the third row in Fig. 5. Comparing the results in the second and the third row, we can figure out that both in the front and the side surfaces, when the scanning speed and laser intensity are the same, hardness of the type 1 and type 2 is similar, much larger than that of type 3. Comparing longitudinally, hardness of the front and side surfaces of one sample has similar value, and the trend is the same for different series of samples. Combined with the results shown in Fig. 4(c) and (d), we can infer that the interior of a sample is homogeneous, and the processing mode of SLA does not make a significant difference between the front and side surfaces. Taken the density into account, the hardness has a similar trend with density in type 1 and type 2, and shows an opposite trend in type 3 with the change of scanning speeds which needs to be studied further. The trend like a sinusoidal curve is considered to be related with the packaging state of the materials. As shown in Fig. 6, when the laser power is a low (66 mW), the resin has been not cured completely. Therefore, the density and hardness of the parts with porous structure are small after removing the unsolidified resin. As the laser power rises, the degree of solidification increases and the inner porosity of the printing parts decreases, and both the density and hardness increase. The resin is almost completely solidified to form a dense structure when the laser power is 350 mW. As the laser power increases further, the resin components are over-cured and gasification is induced, resulting in the formation of bubbles as observed in Fig. 6(d), thus, density and hardness decrease. When the laser power is high enough, granular aggregates with densified structure are formed as shown in Fig. 6(e) and the printed component shows high density and hardness. Further investigations may be necessary to completely clarify the observed phenomena. In order to test whether the slurry can be used in functional parts during industrial process, we printed out complex-shaped parts shown in Fig. 7, which are essentially hard to achieve through traditional casting, especially the hollow glass as shown the Fig. 7(a).
 | ||
| Fig. 6 The optical images of type 2 samples with the decreasing laser power: (a) 138 mW; (b) 196 mW; (c) 350 mW; (d) 580 mW; (e) 1000 mW. The laser scanning speed was 200 mm s−1. | ||
 | ||
| Fig. 7 Optical images of SLA-printed complex-shaped parts photographed by a digital camera. (a) Hollow glass; (b) gear wheel and (c) the spiral piece. | ||
Conclusions
The study demonstrates that the crosslinking strategy of polyurethane-acrylate polymer used in coating technology can be applied for pre-polymerization in the synthesis of resin slurry used for 3D-printing and variations of diluents can tailor resin characteristics needed for various applications. With 2-hydroxyethyl acrylate as diluents, the slurry can be used in high precision manufacturing, and the shrinkage of final parts is smaller than 1.3%. With ethylene glycol monophenyl ether as diluents, the density of final parts is larger than that of PVC and PET, which is comparable to the density of PC. The individual samples are uniform in the interior, and the front and side after polishing have similar surface quality and hardness. The laser scans with low power and high speed resulting in incomplete curing, while low speed and high power may cause over-polymerization. Together, our results provide important technique information for exploring polymer-based stereolithography in manufacturing of more complex functional parts.Conflicts of interest
The authors declare that there is no conflict of interest.Acknowledgements
This work was financially supported by the National Key R&D Program of China (Grant No. 2018YFB1107200), the National Natural Science Foundation of China (Grant Nos. 1150432, 61775192, 51472091, 51772270), Open funds of State Key Laboratory of Precision Spectroscopy, East China Normal University and State Key Laboratory of High Field Laser Physics, Shanghai Institute of Optics and Fine Mechanics, Chinese Academy of Sciences.References
- F. P. W. Melchels, J. Feijen and D. W. Grijpma, Biomaterials, 2009, 30, 3801–3809 CrossRef PubMed.
- J. R. Tumbleston, D. Shirvanyants, N. Ermoshkin, R. Janusziewicz, A. R. Johnson, D. Kelly, K. Chen, R. Pinschmidt, J. P. Rolland, A. Ermoshkin, E. T. Samulski and J. M. DeSimone, Science, 2015, 347, 1349–1352 CrossRef PubMed.
- J. Zhou, Z. Lu, K. Miao, Z. Ji, Y. Dong and D. Li, Propulsion and Power Research, 2015, 4, 63–71 CrossRef.
- C. E. Corcione, F. Gervaso, F. Scalera, F. Montagna, T. Maiullaro, A. Sannino and A. Maffezzoli, J. Polym. Eng., 2017, 37, 741–746 Search PubMed.
- X. Song, Z. F. Zhang, Z. Y. Chen and Y. Chen, Journal of Manufacturing Science and Engineering, 2017, 139, 031015 CrossRef.
- V. B. Morris, S. Nimbalkar, M. Younesi, P. McClellan and O. Akkus, Ann. Biomed. Eng., 2017, 45, 286–296 CrossRef PubMed.
- J. Palaganas, A. de Leon, J. Mangadlao, N. Palaganas, A. Mael, Y. J. Lee, H. Y. Lai and R. Advincula, Macromol. Mater. Eng., 2017, 302 Search PubMed.
- N. P. Macdonald, G. L. Bunton, A. Y. Park, M. C. Breadmore and N. L. Kilah, Anal. Chem., 2017, 89, 4405–4408 CrossRef PubMed.
- E. Skliutas, S. Kasetaite, G. Grigaleviciute, L. Jonusauskas, S. Rekstyte, J. Ostrauskaite and M. Malinauskas, Proc. SPIE, 2017, 10115 Search PubMed.
- J. Z. Manapat, J. D. Mangadlao, B. D. B. Tiu, G. C. Tritchler and R. C. Advincula, ACS Appl. Mater. Interfaces, 2017, 9, 10085–10093 CrossRef PubMed.
- J. L. Jimenez-Perez, A. Cruz-Orea, P. V. Pincel and Z. N. Correa-Pacheco, Int. J. Thermophys., 2017, 38 CrossRef.
- S. J. Leigh, C. P. Purssell, J. Bowen, D. A. Hutchins, J. A. Covington and D. R. Billson, Sens. Actuators, A, 2011, 168, 66–71 CrossRef.
- M. Y. Shie, W. C. Chang, L. J. Wei, Y. H. Huang, C. H. Chen, C. T. Shih, Y. W. Chen and Y. F. Shen, Materials, 2017, 10, 136 CrossRef PubMed.
- S. A. Mohmmed, M. E. Vianna, S. T. Hilton, D. R. Boniface, Y. L. Ng and J. C. Knowles, Microsc. Res. Tech., 2017, 80, 202–210 CrossRef PubMed.
- F. B. Wu Lizhen, D. Changyun, L. Xiaodong and S. Luo, Plast. Sci. Technol., 2017, 45, 6 Search PubMed.
- B. W. Huang, Z. P. Du, T. Yong and W. J. Han, J. Wuhan Univ. Technol., Mater. Sci. Ed., 2017, 32, 726–732 CrossRef.
- X. Feng, Z. Yang, S. S. H. Rostom, M. Dadmun, S. Wang, Q. Wang and Y. Xie, Mater. Des., 2018, 138, 62–70 CrossRef.
- Q. Wan, S. R. Schricker and B. M. Culbertson, J. Macromol. Sci., Part A: Pure Appl.Chem., 2000, 37, 1301–1315 CrossRef.
- D. K. Chattopadhyay and K. V. S. N. Raju, Prog. Polym. Sci., 2007, 32, 352–418 CrossRef.
- M. Johansson, E. Malmstrom and A. Hult, J. Polym. Sci., Part A: Polym. Chem., 1993, 31, 619–624 CrossRef.
- M. Johansson, T. Glauser, G. Rospo and A. Hult, J. Appl. Polym. Sci., 2000, 75, 612–618 CrossRef.
- E. Dzunuzovic, S. Tasic, B. Bozic, D. Babic and B. Dunjic, J. Serb. Chem. Soc., 2004, 69, 441–453 CrossRef.
- G. Xu and W. Shi, Prog. Org. Coat., 2005, 52, 110–117 CrossRef.
- J. Li, L. Xu, C. W. Tang and A. A. Shestopalov, ACS Appl. Mater. Interfaces, 2016, 8, 16809–16815 CrossRef PubMed.
- J. H. Li, L. S. Xu, S. Kim and A. A. Shestopalov, J. Mater. Chem. C, 2016, 4, 4155–4165 RSC.
- M. Rubbistein and R. H. Corlby, Polymer Physics, Oxford University Press, 2003, p. 347 Search PubMed.
| This journal is © The Royal Society of Chemistry 2018 |

