
 Open Access Article
 This Open Access Article is licensed under a Creative Commons Attribution-Non Commercial 3.0 Unported Licence
A comparative study on the photocatalytic degradation of organic dyes using hybridized 1T/2H, 1T/3R and 2H MoS2 nano-sheets†
Mohamed R. Sabera,
Gomaa Khabirib,
Ahmed A. Maaroufc,
Mathias Ulbrichtd and
Ahmed S. G. Khalil *b
*b
aChemistry Department, Faculty of Science, Fayoum University, Fayoum 63514, Egypt
bPhysics Department, Center for Environmental and Smart Technology (CEST), Faculty of Science, Fayoum University, Fayoum 63514, Egypt. E-mail: asg05@fayoum.edu.eg
cDepartment of Physics, IRMC, Imam Abdulrahman Bin Faisal University, Saudia Arabia
dLehrstuhl für Technische Chemie II, Center for Water and Environmental Research (ZWU), Universität Duisburg-Essen, 45141 Essen, Germany
First published on 24th July 2018
Abstract
MoS2 is a very attractive material and has been well studied for potential applications in various areas. However, due to the wide variety of factors affecting the molecular and electronic structure of MoS2, several contradictory reports about the adsorptive and photocatalytic properties of such materials have been published. In most of these reports, the effect of the actual phase of the materials on the properties was neglected. Here, different phases of MoS2 nanosheets (1T/2H, 1T/3R and 2H) have been obtained using the hydrothermal method with different Mo![[thin space (1/6-em)]](https://www.rsc.org/images/entities/char_2009.gif) :S molar ratios and different autoclave filling ratios. The obtained materials have been thoroughly characterized using Raman, UV-vis, powder XRD, SEM, TEM and XPS measurements in order to accurately identify the existing phases in each material. A comparative study of the photocatalytic organic dye degradation efficiency under white light irradiation has been conducted using methyl orange to correlate the different activity of each material to the respective phase composition. The results indicate a much higher performance of the 1T/2H phase compared to the 2H and 3R phases. Detailed computational studies of the different phases revealed the emergence of mid-gap states upon introducing 1T sites into the 2H lattice. This leads to the improvement of the photocatalytic activity of 1T/2H compared to the other prepared materials.
:S molar ratios and different autoclave filling ratios. The obtained materials have been thoroughly characterized using Raman, UV-vis, powder XRD, SEM, TEM and XPS measurements in order to accurately identify the existing phases in each material. A comparative study of the photocatalytic organic dye degradation efficiency under white light irradiation has been conducted using methyl orange to correlate the different activity of each material to the respective phase composition. The results indicate a much higher performance of the 1T/2H phase compared to the 2H and 3R phases. Detailed computational studies of the different phases revealed the emergence of mid-gap states upon introducing 1T sites into the 2H lattice. This leads to the improvement of the photocatalytic activity of 1T/2H compared to the other prepared materials.
Introduction
Molybdenum disulfide (MoS2) is a 2D layered material with a graphene-like structure, which exhibits a variety of unique properties and enables applications as a catalyst in the hydrogen evolution reaction (HER), as a photo-catalyst, and for electrochemical energy storage.1–6 This important material exists in two stable semiconducting phases with trigonal prismatic molybdenum centres (2H and 3R), and a metastable metallic octahedral phase (1T).4 The higher conductivity and the more active basal plane of the 1T phase enabled a superior performance in energy storage and HER applications making it, thus, quite desirable.5–21 Studies have shown that domains of 1T and 2H phases can coexist in single layers of hybridized MoS2.22The activity of MoS2 in electrochemical and photocatalytic water splitting was found to be substantially improved by increasing the density of active sites via introducing defects or increasing conductivity in composites with carbon based materials or other semiconductors.3,23–27 The electronic structure of 1T/2H phases has been the focus of several computational studies.13,28–32 The origin of the improved performance in HER catalysis by 1T/2H phase materials has been attributed to the enhanced charge mobility in the material, due to the enhanced metallic conductivity of 1T phases.25
As an efficient semiconducting nanomaterial, MoS2 has been employed in environmental engineering, for treatment of organic pollutants via both, adsorption or photo-catalytic degradation.33–40 MoS2 is, however, a very delicate semiconducting material. The factors affecting its electronic structure and, hence, properties are quite various, including the molybdenum local coordination environment, the sulphur vacancies and surface defects, the crystal phase (1T, 2H or 3R) with different conductivities, as well as the degree of exfoliation, and the size and morphology of the nano-sheets. This wide variety of factors affecting the molecular and electronic structure as well as active surface area has led to several contradicting reports about the adsorptive and photo-catalytic properties of the material, probably due to neglecting the effect of the actual phase of the material.33–40 Fast and efficient adsorption has been reported for MoS2 and several of its nanocomposites towards different organic dyes.33–37 Liu and co-workers claimed no adsorptive capabilities for their samples and attributed the improved photo-catalytic activity of leaf-shaped MoS2 to its morphology and its thinner layer structure with no account on the actual phase of the material.39 Another study of the photo-degradation of Brilliant Green on bulk MoS2 and WS2 revealed 60% efficiency under visible light.41 These reports highlight a crucial need for a careful structure (phase)–property correlation for the material that takes into account all the different affecting factors. Significant improvements in the photocatalytic degradation efficiency has been achieved in MoS2 nanocomposites with graphene,38 TiO2,42–45 TiO2@zeolite,46 Bi2WO6,47 carbon nanofibers,48 PbS,26 Fe3O4,49 polyaniline,36 and RGO/Fe2O3.50 Bai et al. employed a room temperature assembly mechanism to obtain TiO2/MoS2 (1T) composites which exhibited enhanced efficiency compared to the 2H containing phase.51 Similar improvements in supercapacitors and HER efficiencies have been reported using pure and hybridized 1T phases.7–17
The quest for 1T rich phases has been addressed via several routes.5–18 The Li-intercalation/exfoliation technique using butyl lithium followed by treatment with water has been employed to convert 2H into 1T MoS2 (60–70% 1T).9–11,19,25,51 The treatment of 2H MoS2 with LiBH4 (1:2.5) under Ar at 300 °C for 3 days followed by exfoliation in water has resulted in 80% 1T phases.10 However, this strategy is time consuming, complicated and dangerous due to the pyrophoric nature of the lithium reagents used. Recently, simple hydrothermal and microwave assisted hydrothermal methods have been successfully used to obtain hybridized phases as catalysts in HER,5,21,23,27 and as electrode materials in supercapacitors.8 The fraction of 1T is controlled by the Mo:S molar ratio, with an reported optimum ratio 1:4.25.8 Liu et al. achieved 70% 1T phase MoS2 using aqueous propionic acid medium.2 In another study, supercritical CO2 has been employed to obtain 70% 1T phase MoS2.20 Another aspect of this hydrothermal route is that the use of ammonium molybdate as a precursor enhances the probability to obtain 1T phase due to the intercalation of NH4+ ions.5,23 The transformation of 2H to 1T phases has been also achieved by heating ethanol suspensions of MoS2 at 220 °C for 4 hours.27 On the other hand, annealing 1T phase at 350 °C for 2 hours under argon converted it back to 2H phase MoS2.23
In this work, we conducted a comparative study in order to correlate the photo-catalytic activity of MoS2 materials to their crystalline phases and morphology. We employed the hybridization of 1T into 2H/3R phases as a strategy to enhance the photocatalytic degradation efficiency for organic pollutants in water. A simple hydrothermal synthesis has been used to prepare the target catalysts with different phases; 1T/2H (S1, S2), 1T/3R (S3) and 2H (S4). The filling ratio of the reactor was introduced as an essential factor controlling the 1T content in the materials. The obtained materials were structurally characterized using several analytical techniques. The photo-degradation efficiency towards methyl orange (MO) dye was investigated. Detailed computational studies were conducted in order to gain deeper insights into the origins of the improved catalytic activity of the prepared samples.
Results and discussion
Syntheses and characterizations
The MoS2 materials with different phase composition in this study were obtained via a hydrothermal reaction of ammonium molybdate with thiourea at 200 °C (Fig. 1). Three factors were used to control the type of phase obtained. The reaction with Mo:S ratio of 1:5 at 45% filling of the reactor resulted in hybridized 1T/2H phase (S1) with 70% 1T. Increasing the filling of the reactor to 75% resulted in lower 1T content (20% 1T; S2). A less pronounced decrease in the 1T content has been observed upon varying the molar ratio at 45% filling ratio (1:10, S5, 65% 1T, ESI Fig. 1†). Using a large excess of sulphur with a Mo:S ratio of 1:25 at 75% filling of the reactor gave 1T/3R phase (S3). The thermal treatment of S3 or S1 at 800 °C under argon in a tube furnace resulted in pure 2H phase (S4) (Fig. 2 and ESI Fig. 3†). Similar transformation from 1T to 2H phase upon thermal treatment has been reported previously.52 Materials S1 to S5 have been thoroughly characterized using several analytical techniques.
 | ||
| Fig. 1 Schematic description of the hydrothermal method used for the preparation of different hybridized phases. Molecular structures and optical images suspensions of the obtained samples are shown. | ||
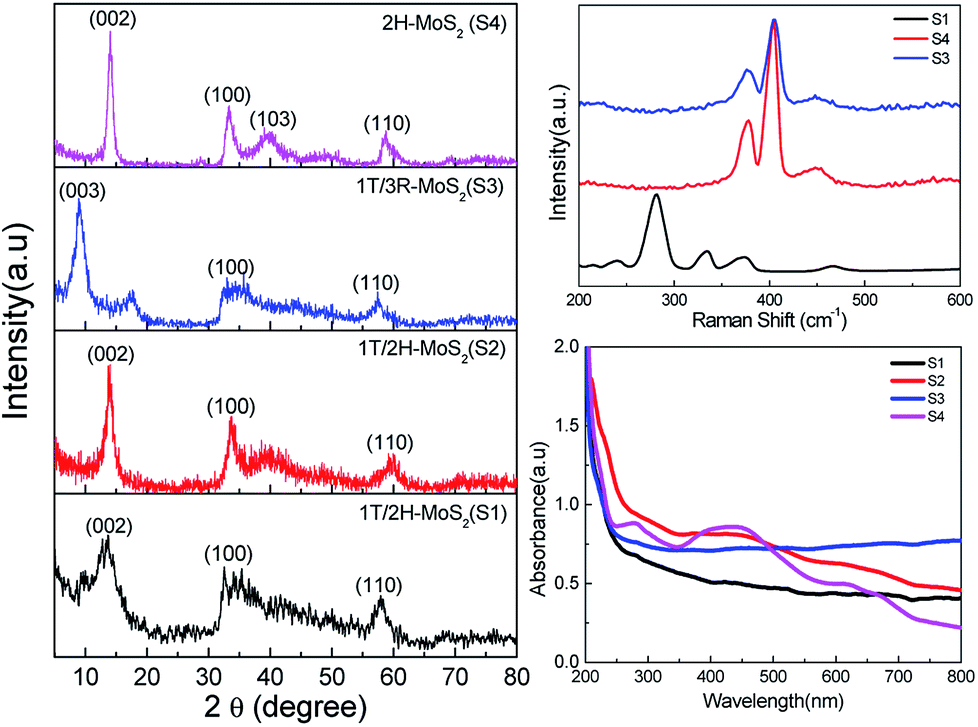 | ||
| Fig. 2 Powder XRD patterns (left) indexed with 2H (S1, S2 and S4) and 3R (S3) patterns. Raman (right top) and UV-vis (right bottom) spectra for S1–4 showing the characteristic modes for each phase. | ||
The powder X-ray diffraction patterns of materials S1, S3 and S4 show clear matching with 1T/2H, 3R and 2H phases, respectively (Fig. 2, left; 2H: PDF no. 00-024-0513; 3R: PDF no. 01-089-2905).
Scanning electron microscopy (SEM) measurements were used to study the morphology of the materials (Fig. 3, top). Micro-flowers of aggregated MoS2 nano-sheets were observed in all cases, with no significant differences. The same morphology has been reported for similar hydrothermally synthesized materials.8 High resolution transmission microscopy (HR-TEM) images (Fig. 3, bottom) show thin petals consisting of few layers of MoS2 nano-sheets. The images clearly show the grid of MoS2 mono-layer; however, the decisive identification of phases using TEM images is quite complicated and not possible without corrected aberration.53
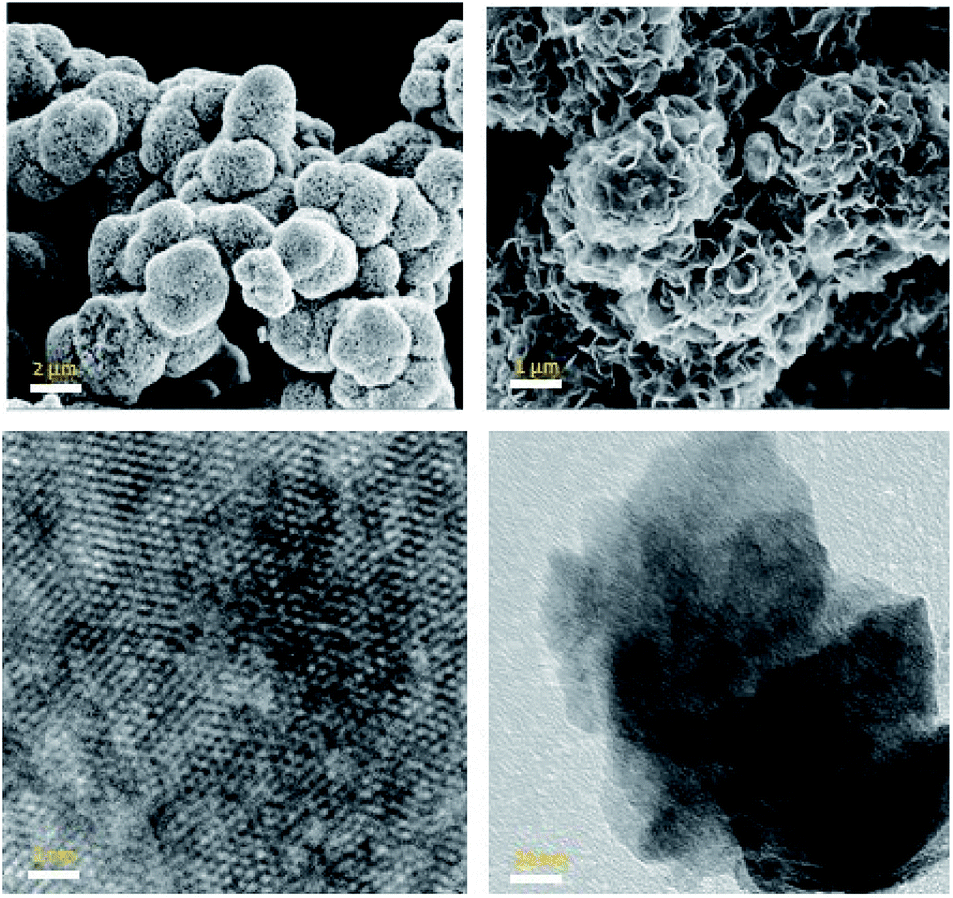 | ||
| Fig. 3 SEM images (top) of MoS2 particles showing the flower-like morphology. HR-TEM (bottom) images showing flakes of few layers of MoS2 and the 2H domains in a monolayer. | ||
Raman spectra of the materials were measured to differentiate between the phases (Fig. 2, top right). Spectra of S3 and S4 exhibit peaks at 377 cm−1 and 405 cm−1 which are attributed to E12g and A1g modes in 2H and 3R phases.54 The spectrum of S1 exhibits the two characteristic peaks for 1T phase at 239 and 334 cm−1.8 The optical A2u mode of the octahedral 1T MoS2 at 485 cm−1 is also observed.55
The optical images of suspensions of the materials in water (Fig. 1) are characteristic for the dominating phase of each sample. Suspensions of S4 with 2H phase exhibit a dark green colour, while suspension of S1 is black-blue. The 3R-containing material (S3) was quite stable and very difficult to exfoliate even with extended sonication time.17 The UV-vis spectra shown in Fig. 2, bottom, exhibit two bands at 628 and 667 nm for S4 which correspond to the excitation in the Brillouin zone at the K point of the 2H phase.20 The lack of absorption bands for S1 to S3 is attributed to the metallic nature of the 1T phase.20
The nature of the phase in each material is more decisively determined using XPS measurements (Fig. 4). The spectrum of S4 exhibits the typical Mo 3d5/2 and Mo 3d3/2 peaks at 229.5 and 232.7 eV, characteristic to the trigonal prismatic environment in 2H phase.8 The deconvolution of peaks in spectra of S1 revealed the existence of the same two peaks that belong to 2H centres, along with two additional peaks shifted by about 1 eV to 228.6 and 231.7 eV, which were assigned to Mo 3d5/2 and Mo 3d3/2 of the 1T phase.8 Similarly, the S 2p3/2 and S 2p1/2 peaks of the 2H phase in S4 appeared at 162.3 and 163.5 eV, respectively. Materials S1, S2, S3 and S5 exhibited two additional peaks shifted by about 1 eV (161.7, 162.8 eV (S1), 161.8, 162.6 eV (S2) and 161.5, 162.4 eV (S3)), as expected for 1T sites.8 The deconvolution of the peaks in both regions using Origin 9 indicated that material S1 contains 69(±2)% 1T phase. An additional peak around 236.5 eV is due to the MoO3 impurities in the samples (∼8% in S1). The deconvolution of spectra for S2 indicated a 1T phase content of 18(±2)%, whereas S3 contains 66(±2)% 1T phase and S5 contains 65(±2) 1T phase (ESI Fig. 1†).
 | ||
| Fig. 4 XPS spectra of S1–4 showing Mo d5/2 and d3/2 peaks for trigonal prismatic (2H, 3R) and octahedral (1T) centers. | ||
Photo-catalytic studies
In order to evaluate the performance of the different materials with different phase composition in photo-catalytic degradation of organic dye (MO), the same doses of S1 to S5 were introduced into MO solution (100 ml, 20 ppm). The mixture was kept in the dark for 30 minutes in order to achieve the adsorption–desorption equilibrium before starting the irradiation with white light (400 W tungsten lamp). The degradation efficiency of MO was monitored with irradiation time by measuring the remaining dye concentration using UV-vis at λ = 485 nm. For the reaction at pH = 7, S1 shows a significantly higher activity (77%), compared with S5, S2, S3 and S4 (60%, 35%, 13% and 4%, respectively; Fig. 5, 6 and ESI Fig. 2†). A further increase in the photo-catalytic activity has been observed under more acidic conditions (pH = 2; S1: 95%; S5: 85%, S2: 60%; S4: 12%). The activity of S3 increased with increasing the pH value (pH = 11, 30%). The observed photo-catalytic activity of S1 is comparable to that of several previously reported MoS2 composites.38,46,56 Previous studies reported photo-catalytic activity of MoS2 in acidic medium albeit with lower efficiencies (60–90%).39,41 The improved activity of their samples has been attributed to the morphology, with no reports on the existing phase.39 It is more reasonable, however, to correlate the enhanced activity of S1 to the improved conductivity of the 1T phase and the active sites introduced via 1T defects in the 2H layers (69% T1 content; Table 1). This hypothesis is strongly supported by the largely decreased activity of S2, which has much lower 1T content (18% 1T; Table 1). It is also backed with the DFT calculations which will be discussed later. Another study reported 97% degradation of Rhodamine B (RB) using MoS2.57 However, our recent unpublished findings using RB, indicate an ultrafast adsorption in the dark. Such observation suggests that any photo-catalytic studies using RB dye would be unreliable. The current optimized MoS2 catalyst (S1) retains ca. 75% of its efficiency after four cycles of usage (ESI Fig. 4†). This clearly show the potential of such novel catalysts for different waste water treatment applications. | ||
| Fig. 5 Photocatalytic activity of S1 at different pH values (95% removal at pH = 2). | ||
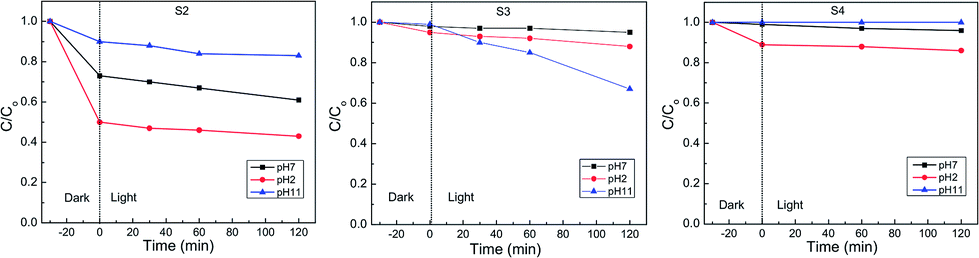 | ||
| Fig. 6 Photocatalytic activity of S2–4 at different pH values. | ||
| S1 | S2 | S3 | S4 | |
|---|---|---|---|---|
| 1T% | 69(±2)% | 18(±2)% | 66(±2)% | — |
| Activity (pH = 2) | 95% | 60% | 13% | 12% |
Another crucial factor is the highly exfoliated nature of the material S1 as compared to S3, which remained mostly un-exfoliated even after several hours of sonication. This difficulty in exfoliation is probably due to the more stable stacking in the 3R phase and the slightly larger particles.17 This un-exfoliated nature of S3 hinders the dye molecules from accessing the active sites on the surface of the MoS2 particles, which turned out to be quite detrimental to the photo-catalytic activity of the material.
MoS2 is an n-type semiconductor. The photocatalytic activity proceeds via electron transfer from the nano-sheets to the oxygen in the solution, to form oxygen radicals. Then, water molecules get adsorbed to the positively charged centres on the surface of the semiconductor to create H+ and hydroxyl radicals (ȮH). The protons get adsorbed to the negatively charged surface centres and then combine with an electron to react with oxygen radicals and ultimately form hydrogen peroxide (eqn (1)).
 | (1) |
The hydrogen peroxide can combine with one more electron, and react with a proton to form more hydroxyl radicals (eqn (2)).
| H2O2 + 1e + H+ → H2O + ˙OH | (2) |
The generation of these reactive species (H2O2, oxygen radicals, hydroxyl radicals) leads to organic dye oxidation, which is apparently faster in acidic media.40
Computational studies
We used DFT calculations to study the electronic structure of mixed phase (1T/2H) MoS2. Single layer 2H MoS2 is direct gap semiconductor. The gap decreases and becomes indirect as more layers are added. To understand the effect of 1T phase embedded in the 2H phase, we considered a 6 × 6 supercell of single layer 2H MoS2, with 36 Mo, and 72 S atoms. We studied 4 configurations of 1T/2H: one site, two sites, a 7 Mo atom 1T patch (Fig. 7a–c), and a similar patch with 3 S vacancies at the boundary with the 2H surrounding region. | ||
| Fig. 7 DFT results of 1H single layer with: (a) one 1T site (b) two 1T sites (c) 7 Mo atoms 1T patch. The successive increase of 1T sites leads to the introduction of mid-gap states of Mo d orbitals in nature. | ||
With one 1T defect, structural relaxation yields a local symmetric distortion in the Mo sites surrounding the Mo 1T atom (inset of Fig. 7a), where the boundary Mo–Mo distance decreases from 3.21 Å to 3.02 Å. The trigonal configuration at the 1T sites affects the Mo–S coordination of the surrounding Mo atoms, leading to the emergence of mid-gap Mo states. Projection of these states on the atomic orbitals show that they are d states of the Mo atom at the 1T site.
With two 1T defects (Fig. 7b), the situation is similar. The structural symmetry breaking induced by the location of the defects leads to an asymmetric distortion around the defect sites (Fig. 7b, inset). The gap is further quenched by mid-gap Mo states (Fig. 7b), which are also d states of the Mo 1T atoms at the two defect sites. The extended 1T region (Fig. 7c) fills the gap with more d states of the 1T patch Mo atoms. The introduction of such mid-gap state upon embedding 1T defects in the layer explains the improved conductivity of 1T/2H phases as compared to pure 2H. It also explains the improved photo-catalytic activity due to the presence of mid-gap states and the induced structural distortions and sulphur vacancies at the boundaries of the 1T defect sites which work as active sites for catalysis.
To compare the presence of the 1T defect in the 2H phase vs. the 3R phase, we study the properties of two bilayer systems, a 2H, and a 3R, with one 1T defect in the top layer for both cases. The second is a 3R system with a similar one 1T defect, also in the top layer. Each unit cell has 216 atoms. As in the single layer case, the Mo atoms in the vicinity of the 1T defect suffer some structural deformation, changing the Mo–Mo distance to 3.02 Å for both cases.
As we see in Fig. 8, the effect of the 1T in the 2H case is less pronounced than for the single layer system, which can be attributed to the lower 1T defect density. Furthermore, the 1T defective 3R structure has a highly similar DOS, which would give a similar photocatalytic activity to the 2H system. The low photocatalytic activity of the 1T/3R phase (S3) suggests that the 1T regions in the mixed phase are more homogeneous distributed than in the 2H phase, making it more difficult to exfoliate it, and hence lowering its photocatalytic activity.
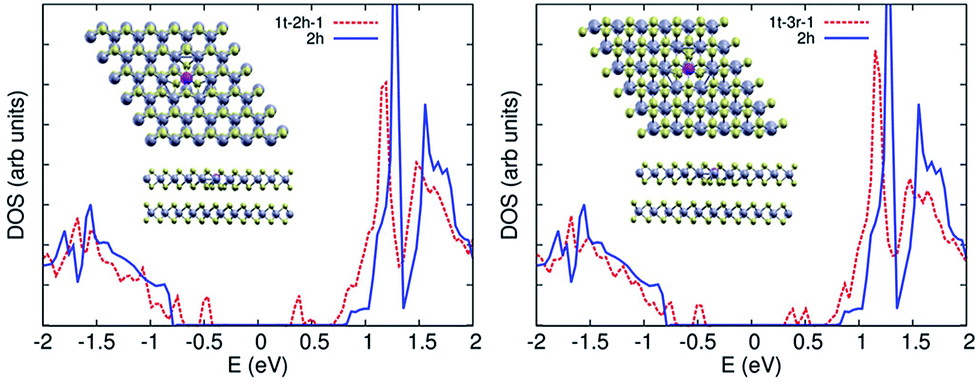 | ||
| Fig. 8 DOS of 1T/2H (left) and 1T/3R (right) phases versus 1H single layer (blue). | ||
Experimental
Materials
All the chemicals employed were of analytical grade and applied without further purification.Syntheses
In a typical synthesis of MoS2 nano-sheets S1–4, (2.47 g, 2 mmol) of (NH4)6Mo7O24·4H2O and (0.76 g, 10 mmol) of CS(NH2)2 were dissolved in 60 ml of distilled water under constant stirring. The mixture was transferred into a 150 ml Teflon-lined stainless steel autoclave and sealed (S1: filling ratio 45%). The autoclave was placed in a pre-heated oven at 200 °C for 24 h, then left to cool down to room temperature. The black precipitate was collected by centrifugation, washed three times with distilled water then ethanol, thereafter dried in an oven at 80 °C for 12 h. The variation of the molar and filling ratios (1:5, 75% (S2), 1:25, 75% (S3) and 1:10, 45% (S5)) resulted in the different phases obtained. S4 was obtained via thermal treatment of S3 in a tube furnace (Carbolite) at 800 °C under Ar for 2 hours.
Characterization of MoS2 materials
X-ray photoelectron spectroscopy (XPS, VersaProbe II, Ulvac-PHI) was performed with monochromatic Al K-alpha light with a photon energy of 1486.8 eV. The calibration for determining the elemental binding energy was done using the sputter-cleaned copper 2p3/2 line at 932.67 eV of thin copper foil fixed on the same electronic potential as the samples. SEM imaging was performed using LEO SUPRA 55VP FEG, Zeiss, equipped with Oxford EDS detector. HR-TEM images were obtained using JOEL 2100F at 200 kV. Raman spectra were collected on ProRamanL, Enwave Optronics at excitation wavelength λexc = 532 nm. X-ray diffraction patterns were collected using Cu Kα monochromatic radiation (K = 1.54056) at room temperature on a 202964 Panalytical Empryan diffractometer.Exfoliation
50 mg of the prepared material was added into DI water with stirring for 1 one hour, then sonicated for 30 minutes to obtain a suspension (of different appearance; S1: black; S4: yellow-green). The obtained suspension was then centrifuged at 4000 rpm for 45 min to remove the precipitates. The supernatant was collected and then centrifuged at 18000 rpm to obtain exfoliated samples. Thereafter, the products were re-dispersed into 25 ml ethanol through sonication for 2–3 hours for later use in spectral studies.
Photo-catalytic studies
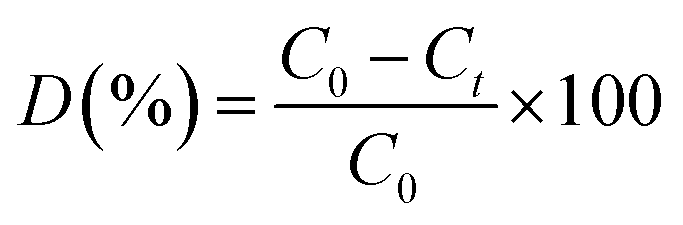
Photo-catalytic degradation of methyl orange (MO) was carried out under visible-light irradiation (400 W tungsten lamp). 100 mL aqueous samples (20 ppm MO) were added to 50 mg of the photo-catalyst. To establish absorption/desorption equilibrium, the solutions/dispersions were stirred for 30 min in the dark before irradiation. The samples were kept at constant temperature (∼30 °C) during the experiment. The change of concentration of the dyes was monitored using UV-vis measurements (λmax = 464 nm, Agilent, Cary 60). The dye degradation surveys were conducted at the interval of 4 min, and the catalyst was isolated via centrifugation. The photo-degradation percentage of MO was calculated using the following equation:where C0 and Ct are the concentrations of the dye at time 0 and t (s), respectively, and t is the irradiation time.
Computational studies
All calculations were performed using the Quantum Espresso plane waves package58 based on density functional theory. We used the Perdew–Wang 91 (PW91) gradient-corrected functional.59 A 6 × 6 2H supercell is built, with a vacuum separation of 13 to prevent interaction between neighboring cells. A dense 16 × 16 Monkhorst–Pack k-mesh60 was used for the calculation of the density of states, and an energy cut-off of 612 eV. All systems were structurally relaxed, until all atomic forces become less than 0.002 Ry bohr−1.Conclusions
New hybridized materials of MoS2 with different phase composition have been hydrothermally synthesized using the Mo:S ratio and the reactor filling ratio as controlling factors. A systematic correlation between the different phases of MoS2 (1T/2H (S1, S2, S5), 1T/3R (S3) and 2H (S4)) and their photo-catalytic degradation activity towards methyl orange in water under white light irradiation has been established. The results indicate a significantly improved performance of 1T containing phases. Detailed computational studies suggest that introducing 1T sites into 1H layers induces surface distortions and introduces mid-gap states which improves the conductivity and catalytic activity of the material. This study provides more evidence of the delicate nature of MoS2 nano-sheets which renders the material's structure and properties quite susceptible to a wide variety of factors, including the molybdenum local coordination environment, the sulphur vacancies and surface defects, the crystal phase (1T, 2H or 3R) with different conductivities as well as the degree of exfoliation, and the size and morphology of the nano-sheets.
Conflicts of interest
There are no conflicts to declare.Acknowledgements
A. Maarouf would like to acknowledge the use of the resources of the Supercomputing Laboratory at King Abdullah University of Science & Technology (KAUST) in Thuwal, Saudi Arabia, and the resources and technical services provided by the Scientific and High Performance Computing Center at Imam Abdulrahman Bin Faisal University, Dammam, Saudi Arabia. The XPS analyses had been performed by Dr U. Hagemann and I. Stratmann at University Duisburg-Essen. The authors would like to thank Ossama I. Metwalli, Asmaa M. A. Omar and Mohamed E. M. Ali for their support in materials synthesis.Notes and references
- X. Geng, Y. Zhang, Y. Han, J. Li, L. Yang, M. Benamara, L. Chen and H. Zhu, Nano Lett., 2017, 17, 1825–1832 CrossRef PubMed.
- Z. P. Liu, Z. C. Gao, Y. H. Liu, M. S. Xia, R. W. Wang and N. Li, ACS Appl. Mater. Interfaces, 2017, 9, 25291–25297 CrossRef PubMed.
- F. Q. Huang, W. Zhao, J. Pan, Y. Fang, X. Che, D. Wang and K. Bu, Chemistry, 2018 DOI:10.1002/chem.201801018.
- X. Chia, A. Y. S. Eng, A. Ambrosi, S. M. Tan and M. Pumera, Chem. Rev., 2015, 115, 11941–11966 CrossRef PubMed.
- F. Z. Wang, M. J. Zheng, B. Zhang, C. Q. Zhu, Q. Li, L. Ma and W. Z. Shen, Sci. Rep., 2016, 6, 31092 CrossRef PubMed.
- D. Saha and S. Mahapatra, Phys. Chem. Chem. Phys., 2017, 19, 10453–10461 RSC.
- Y. Yu, G.-H. Nam, Q. He, X.-J. Wu, K. Zhang, Z. Yang, J. Chen, Q. Ma, M. Zhao, Z. Liu, F.-R. Ran, X. Wang, H. Li, X. Huang, B. Li, Q. Xiong, Q. Zhang, Z. Liu, L. Gu, Y. Du, W. Huang and H. Zhang, Nat. Chem., 2018, 10, 638–643 CrossRef PubMed.
- N. Thi Xuyen and J. M. Ting, Chemistry, 2017, 23, 17348–17355 CrossRef PubMed.
- M. Acerce, D. Voiry and M. Chhowalla, Nat. Nanotechnol., 2015, 10, 313–318 CrossRef PubMed.
- D. Voiry, M. Salehi, R. Silva, T. Fujita, M. Chen, T. Asefa, V. B. Shenoy, G. Eda and M. Chhowalla, Nano Lett., 2013, 13, 6222–6227 CrossRef PubMed.
- L. Jiang, S. Zhang, S. A. Kulinich, X. Song, J. Zhu, X. Wang and H. Zeng, Mater. Res. Lett., 2015, 3, 177–183 CrossRef.
- W. Chen, J. Gu, Q. Liu, R. Luo, L. Yao, B. Sun, W. Zhang, H. Su, B. Chen, P. Liu and D. Zhang, ACS Nano, 2018, 12, 308–316 CrossRef PubMed.
- M. R. Ryzhikov, V. A. Slepkov, S. G. Kozlova, S. P. Gabuda and V. E. Fedorov, J. Comput. Chem., 2015, 36, 2131–2134 CrossRef PubMed.
- Y.-Y. Wang, J.-J. Deng, X. Wang, J.-T. Che and X.-L. Ding, Phys. Chem. Chem. Phys., 2018, 20, 6365–6373 RSC.
- C. K. Chua, A. H. Loo and M. Pumera, Chem.–Eur. J., 2016, 22, 14336–14341 CrossRef PubMed.
- L. Danqin, Z. Weiqiang, Z. Qianjie, Y. Guo, W. Tongzhou, W. Jing, C. Yanan and X. Jingkun, Nanotechnology, 2017, 28, 395401 CrossRef PubMed.
- K. Chang, X. Hai, H. Pang, H. Zhang, L. Shi, G. Liu, H. Liu, G. Zhao, M. Li and J. Ye, Adv. Mater., 2016, 28, 10033–10041 CrossRef PubMed.
- H. Wang, Z. Lu, D. Kong, J. Sun, T. M. Hymel and Y. Cui, ACS Nano, 2014, 8, 4940–4947 CrossRef PubMed.
- R. Kappera, D. Voiry, S. E. Yalcin, B. Branch, G. Gupta, A. D. Mohite and M. Chhowalla, Nat. Mater., 2014, 13, 1128–1134 CrossRef PubMed.
- Y. Qi, Q. Xu, Y. Wang, B. Yan, Y. Ren and Z. Chen, ACS Nano, 2016, 10, 2903–2909 CrossRef PubMed.
- X. Geng, W. Sun, W. Wu, B. Chen, A. Al-Hilo, M. Benamara, H. Zhu, F. Watanabe, J. Cui and T.-p. Chen, Nat. Commun., 2016, 7, 10672 CrossRef PubMed.
- G. Eda, T. Fujita, H. Yamaguchi, D. Voiry, M. Chen and M. Chhowalla, ACS Nano, 2012, 6, 7311–7317 CrossRef PubMed.
- Q. Liu, X. Li, Q. He, A. Khalil, D. Liu, T. Xiang, X. Wu and L. Song, Small, 2015, 11, 5556–5564 CrossRef PubMed.
- J. Xie, H. Zhang, S. Li, R. Wang, X. Sun, M. Zhou, J. Zhou, X. W. Lou and Y. Xie, Adv. Mater., 2013, 25, 5807–5813 CrossRef PubMed.
- M. A. Lukowski, A. S. Daniel, F. Meng, A. Forticaux, L. Li and S. Jin, J. Am. Chem. Soc., 2013, 135, 10274–10277 CrossRef PubMed.
- V. R. Raja, D. R. Rosaline, A. Suganthi and M. Rajarajan, Solid State Sci., 2017, 67, 99–108 CrossRef.
- S. Shi, D. Gao, B. Xia, P. Liu and D. Xue, J. Mater. Chem. A, 2015, 3, 24414–24421 RSC.
- Y.-C. Lin, D. O. Dumcenco, Y.-S. Huang and K. Suenaga, Nat. Nanotechnol., 2014, 9, 391 CrossRef PubMed.
- K. F. Mak, C. Lee, J. Hone, J. Shan and T. F. Heinz, Phys. Rev. Lett., 2010, 105, 136805 CrossRef PubMed.
- M. Calandra, Phys. Rev. B, 2013, 88, 245428 CrossRef.
- A. P. Nayak, T. Pandey, D. Voiry, J. Liu, S. T. Moran, A. Sharma, C. Tan, C.-H. Chen, L.-J. Li, M. Chhowalla, J.-F. Lin, A. K. Singh and D. Akinwande, Nano Lett., 2015, 15, 346–353 CrossRef PubMed.
- H. He, P. Lu, L. Wu, C. Zhang, Y. Song, P. Guan and S. Wang, Nanoscale Res. Lett., 2016, 11, 330 CrossRef PubMed.
- C. Wang, J. Jin, Y. Sun, J. Yao, G. Zhao and Y. Liu, Chem. Eng. J., 2017, 327, 774–782 CrossRef.
- H. J. Song, S. S. You, X. H. Jia and J. Yang, Ceram. Int., 2015, 41, 13896–13902 CrossRef.
- X. Qiao, F. Hu, D. Hou and D. Li, Mater. Lett., 2016, 169, 241–245 CrossRef.
- Y. Gao, C. Chen, X. Tan, H. Xu and K. Zhu, J. Colloid Interface Sci., 2016, 476, 62–70 CrossRef PubMed.
- H. Li, F. Xie, W. Li, B. D. Fahlman, M. Chen and W. Li, RSC Adv., 2016, 6, 105222–105230 RSC.
- Y. Zhao, X. Zhang, C. Wang, Y. Zhao, H. Zhou, J. Li and H. Jin, Appl. Surf. Sci., 2017, 412, 207–213 CrossRef.
- W. Liu, Q. Hu, F. Mo, J. Hu, Y. Feng, H. Tang, H. Ye and S. Miao, J. Mol. Catal. A: Chem., 2014, 395, 322–328 CrossRef.
- J. M. Wu, W. E. Chang, Y. T. Chang and C. K. Chang, Adv. Mater., 2016, 28, 3718–3725 CrossRef PubMed.
- A. K. Mishra, K. V. Lakshmi and L. Huang, Sci. Rep., 2015, 5, 15718 CrossRef PubMed.
- Y. Yu, J. Wan, Z. Yang and Z. Hu, J. Colloid Interface Sci., 2017, 502, 100–111 CrossRef PubMed.
- J. Wang, B. Wei, L. Xu, H. Gao, W. Sun and J. Che, Mater. Lett., 2016, 179, 42–46 CrossRef.
- H. Li, Y. Wang, G. Chen, Y. Sang, H. Jiang, J. He, X. Li and H. Liu, Nanoscale, 2016, 8, 6101–6109 RSC.
- X. Hu, H. Zhao, J. Tian, J. Gao, Y. Li and H. Cui, Sol. Energy Mater. Sol. Cells, 2017, 172, 108–116 CrossRef.
- W. Zhang, X. Xiao, L. Zheng and C. Wan, Appl. Surf. Sci., 2015, 358, 468–478 CrossRef.
- J. Zhang, L. Huang, H. Jin, Y. Sun, X. Ma, E. Zhang, H. Wang, Z. Kong, J. Xi and Z. Ji, Mater. Res. Bull., 2017, 85, 140–146 CrossRef.
- Y. Wang, J. Sunarso, F. Wang, B. Zhao, X. Liu and G. Chen, Ceram. Int., 2017, 43, 11028–11033 CrossRef.
- C. Han, G. Huang, D. Zhu and K. Hu, Mater. Chem. Phys., 2017, 200, 16–22 CrossRef.
- L. Chen, F. He, N. Zhao and R. Guo, Appl. Surf. Sci., 2017, 420, 669–680 CrossRef.
- S. Bai, L. Wang, X. Chen, J. Du and Y. Xiong, Nano Res., 2014, 8, 175–183 CrossRef.
- Y. Zhao, Y. Liu, H. Liu, H. Kang, K. Cao, Q. Wang, C. Zhang, Y. Wang, H. Yuan and L. Jiao, J. Power Sources, 2015, 300, 358–364 CrossRef.
- G. Eda, T. Fujita, H. Yamaguchi, D. Voiry, M. Chen and M. Chhowalla, ACS Nano, 2012, 6, 7311 CrossRef PubMed.
- J. U. Lee, K. Kim, S. Han, G. H. Ryu, Z. Lee and H. Cheong, ACS Nano, 2016, 10, 1948–1953 CrossRef PubMed.
- S. Jiménez Sandoval, D. Yang, R. F. Frindt and J. C. Irwin, Phys. Rev. B: Condens. Matter Mater. Phys., 1991, 44, 3955–3962 CrossRef.
- W. Zhang, X. Xiao, L. Zheng and C. Wan, Can. J. Chem. Eng., 2015, 93, 1594–1602 CrossRef.
- F. Yang, Z. Zhang, Y. Wang, M. Xu, W. Zhao, J. Yan and C. Chen, Mater. Res. Bull., 2017, 87, 119–122 CrossRef.
- G. Paolo, B. Stefano, B. Nicola, C. Matteo, C. Roberto, C. Carlo, C. Davide, L. C. Guido, C. Matteo, D. Ismaila, C. Andrea Dal, G. Stefano de, F. Stefano, F. Guido, G. Ralph, G. Uwe, G. Christos, K. Anton, L. Michele, M.-S. Layla, M. Nicola, M. Francesco, M. Riccardo, P. Stefano, P. Alfredo, P. Lorenzo, S. Carlo, S. Sandro, S. Gabriele, P. S. Ari, S. Alexander, U. Paolo and M. W. Renata, J. Phys.: Condens. Matter, 2009, 21, 395502 CrossRef PubMed.
- M. Ernzerhof and G. E. Scuseria, J. Chem. Phys., 1999, 110, 5029–5036 CrossRef.
- H. J. Monkhorst and J. D. Pack, Phys. Rev. B: Solid State, 1976, 13, 5188–5192 CrossRef.
Footnote |
| † Electronic supplementary information (ESI) available. See DOI: 10.1039/c8ra05387a |
| This journal is © The Royal Society of Chemistry 2018 |