 Open Access Article
A green approach for the synthesis of novel Ag3PO4/SnO2/porcine bone and its exploitation as a catalyst in the photodegradation of lignosulfonate into alkyl acids†
Kai Chen,
Mengdie Cao,
Cong Ding * and
Xinsheng Zheng*
College of Science, Huazhong Agricultural University, Wuhan, 430070, China. E-mail: dingcong@mail.hzau.edu.cn; xszheng@mail.hzau.edu.cn
First published on 27th July 2018
Abstract
A novel Ag3PO4/SnO2/porcine bone composite photocatalyst was successfully prepared via an ion exchange method, which can convert lignin derivatives into small molecular acids upon exposure to visible light at room temperature at ambient pressure. The composition characterization, optical absorption properties and photocatalytic activities of the Ag3PO4/SnO2/porcine bone composites were thoroughly investigated. The certain role of each component of the composites in the degradation reaction was discussed: Ag3PO4 acted as the major active component, while SnO2 and porcine bone as cocatalyst contributed to improve the photocatalytic activity and stability of Ag3PO4. The enhanced activity of the Ag3PO4/SnO2/porcine bone composite may be attributed to the synergistic effect including the matched energy band structures of Ag3PO4 and SnO2 for the decrease in the probability of electron–hole recombination and improved performance in the presence of hierarchical porous porcine bone (hydroxyapatite). This paper also analyzed the change of the molecular weight and structure of sodium lignin sulfonate in the photocatalytic reaction and discussed the possible photocatalytic mechanism of the photocatalyst composite, indicating that the benzene rings of guaiacol were oxidized into different alkyl acids (maleic acid, oxalic acid, formic acid and methoxy acetic acid).
Introduction
As one of the typical biomasses of sustainable raw materials, lignocellulose contains abundant lignin (25–35%), cellulose (30–50%) and hemicellulose (20–35%), which is a significant feedstock source to produce green energy and fine chemicals.1–3 As the second most abundant terrestrial biopolymer on Earth after cellulose, lignin provides mechanical and chemical stability to plant tissues since it is very difficult to degrade biologically. As a result of its rich content of aromatic carbon, lignin has the potential to be decomposed to yield valuable chemicals and alternatives to fossil fuels. From a sustainability viewpoint, the effective utilization of renewable lignin and its derivatives for production of platform industrial chemicals and liquid fuels would relieve the society's strong dependence on fossil energy and reduce the emission of greenhouse gases of carbon dioxide.4–6 Therefore, research of high-value utilization of industrial lignin is very urgent and significant for both the development of environmental protection and resource utilization.7 The primary structure of lignin is largely composed of oxygenated 4-propylphenolic units crosslinked via phenyl ether bonds, as well as by C–C and other C–O bonds.8–10 The difficulty in converting lignin to high-value chemicals and liquid fuels mostly derives from its highly complexity and diverse structures, which requires elaborate control of conversion reaction conditions and the employment of catalysts capable of selective bond cleavage.11 Another challenge associated with lignin utilization is to find economic pathways for conversion of lignin to value-added chemicals and fuels. To date, multiple strategies have emerged for catalyzing lignin transformations including pyrolysis and liquefaction techniques,12,13 acidic or basic hydrolysis14,15 and a more selective depolymerization process via catalytic cleavage of C–C or C–O bonds in lignin interunit linkages.16,17 Although considerable progress has been made in converting lignin into high-value chemicals and liquid fuels by utilizing these catalytic methods, most of these experiments normally require elevated temperature and high pressure to operate, resulting in raised cost and strict limitation of operation to these proposed technologies.18,19Among all methods, photocatalysis may be regarded as one of the most innovative methods in green chemistry due to its excellent merits including environment-friendly, energy-saving, and low cost.20–23 The synthesis of vanillin form lignin derivatives by using photocatalytic method provides a new way for commercial production of vanillin.24,25 Lignin photodegradations were carried out by using TiO2 as catalyst under UV radiation, and the main products obtained are syringaldehyde, pyrocatechol and raspberry ketone.26 Zhang et al. reported the photocatalytic degradation of lignin by Ag–AgCl/ZnO nanorods under solar light, and bioavailability of degraded lignin was also evaluated by using batch methane fermentation experiments.27 In recent years, the research of photocatalysis for degradation or depolymerization of lignin is mainly focused on two aspects. One is photocatalytic degradation of lignin to remove contaminants in wastewater of paper mill.28,29 Another is to obtain aromatic compounds by photocatalytic depolymerization of lignin.30 However, few of them referred to the dearomatization reaction of benzene ring in lignin to generate alkyl alcohols and alkyl acids by using photocatalytic method, which facilitates the transformation of lignin into liquid fuels and high-value chemicals.
To address these issues, we have developed a green catalytic method for conversion of lignin derivative into small molecular acids by oxygenizing the benzene rings of the derivative. The chosen starting compound is sodium lignin sulfonate, a commercially available water-soluble lignin derivative. The reaction is driven by visible light at room temperature and under ambient pressure using Ag3PO4/SnO2/porcine bone composites as catalyst synthesized by ion-exchange method. Porous hydroxyapatite supporter gained from natural products (porcine bone) was introduced into the catalyst to make the photocatalysis process economically and ecologically friendly as well as to increase the adsorption ability between the photocatalyst and organic reactants of the system. To the best of our knowledge, it is the first time to utilize green catalytic approach for efficient conversion of lignin derivatives to high value-added chemicals in mild conditions. Due to the use of biomass-based composites as photocatalyst and being driven by visible light at room temperature and ambient pressure, the conversion process of lignin derivative to alkyl acids exhibits the distinct characteristics of green catalysis.
Experimental
Materials
The photocatalyst used in the investigation was prepared from porcine bone, SnCl4 and AgNO3. The chemical reagents including SnCl4·5H2O, AgNO3, ethanol, EDTA-2Na, tert-butanol, glucose, p-benzoquinone and sodium lignin sulfonate were all of analytical grade and used directly without further purification. All the reagents except porcine bone were provided by Sinopharm Chemical Reagent Co. Ltd. Porcine bone in the experiments was collected from nearby restaurant and boiled to remove all the impurities and contaminants. Then transferred it into a Teflon-lined stainless steel autoclave and kept in an oven at a constant temperature of 180 °C for 12 h. The resultant was washed for several times with tap water and dried with a drying oven at 80 °C for 6 h, followed by crushed into tiny fragments.Catalyst preparation
SnO2/porcine bone was synthesized by a hydrothermal method. The mixture of SnCl4·5H2O (20 mmol), glucose (40 mmol), pretreated porcine bone (1.00 g) and water (70 mL) were added into the Teflon-lined stainless steel autoclave, and then hydrothermal reaction was conducted at 180 °C for 6 h. The precipitate was collected by centrifugation and washed for several times with ethanol and deionized water alternately, and dried under vacuum at the temperature of 80 °C for 6 h, finally calcined at 500 °C for 2 h to obtain SnO2/porcine bone.31The SnO2/porcine bone was impregnated with AgNO3 aqueous solution, constantly stirring for 2 h, and then the resultant was washed with deionized water for several times. Finally, the system was dried for about 8 h at 60 °C. With the procedure above, the sample of the photocatalyst denoted as Ag3PO4/SnO2/porcine bone composite was obtained.
Catalysis procedures
The conversion of lignin derivative was performed by stirring an aqueous solution containing of sodium lignin sulfonate (50 mg L−1, 100 mL) and Ag3PO4/SnO2/porcine bone catalyst (50 mg). Before exposed to light, the mixture was stirred in the dark for 0.5 h to establish an adsorption–desorption equilibrium. Then the reaction mixtures were exposed to light irradiation from a 300 W xenon lamp (power density was about 0.56 W cm−2) under constant air-equilibrated conditions. The distance between the Xe lamp source and the center of the quartz cap rabbet was 10 cm during this photocatalytic reaction process. The temperature of the solution was kept continuously at 298 ± 0.5 K by a digitally controlled water bath.Characterization of materials
X-ray diffraction (XRD) used a Bruker D8 Power X-ray diffractometer with Cu Kα (λ = 0.15406 nm) over a 2θ range of 10–80° with a step size of 0.04° at a scanning speed of 10° min−1. A scanning electron microscope (SEM) (JEOL JSM-6701F, Japan) was used to investigate the morphology of the catalyst. The BET (Brunauer, Emmett and Teller) specific surface area and pore size distribution of samples were determined by using N2 adsorption–desorption apparatus (Quantachrome, Autosorb-I, USA) and pore size distribution analyzer. The catalyst sample was first dried, and then the powder sample (0.1 g) was put in the dry sample tube washed by potassium dichromate solution. The catalysts were desorbed at 110 °C for 12 h and were measured by N2 adsorption method. Fourier Transform Infrared absorption (FT-IR) spectrums of the samples were conducted by a Nicolet is50 FT-IR spectrometer in the range of 4000–500 cm−1.The acidity test of final product
The conversion of lignin derivative was performed by stirring an aqueous solution of sodium lignin sulfonate containing Ag3PO4/SnO2/porcine bone catalyst under constant air-equilibrated conditions with visible light irradiation. The temperature of the solution was kept continuously at 298 ± 0.5 K by a digitally controlled water bath. The conversion reaction was interrupted at the time of 1 h, 2 h, 3 h, 4 h, 5 h, 6 h, and the acidity of the product was analyzed by potentiometric titration method using NaOH solution with certain concentration.Adsorption/photocatalytic activity measurements and component identification of the product
The UV-Vis diffuse reflectance absorption spectra (UV-Vis DRS) were recorded on a Cary 5000 UV-Vis-NIR spectrophotometer equipped with an integrating sphere using BaSO4 as a reference. Nuclear Magnetic Resonance hydrogen spectrums (1H NMR) were performed on a Bruker DRK-400 spectrometer operating at 400 MHz instrument with D2O as the solvent. Gel Permeation Chromatograph (GPC) measurements were carried out using a Waters 2690 Separations Module instrument equipped with a Waters 2410 Refractive Index Detector, with poly(ethylene oxide) as the standard sample and water as the solvent (flow rate: 0.6 mL min−1, column temperature: 40 °C, detector temperature: 40 °C). Electrospray mass spectrometry (ESI-MS) experiments were carried out on an ESI-MS system consisting of a Shimadzu LCMS-2010EV mass spectrometer. Data acquisition and processing were performed using LCSolutions 5.42 SP4 software. Drying and nebulizer gases of nitrogen were set at 15 L min−1 and 1.5 L min−1, respectively. Capillary voltage was set at 4.5 kV. Curved desolvation line and heat block temperatures were set at 250 °C and 200 °C, respectively. The detector voltage was set at 1.05 V. The samples were injected directly after dilution and filtering by membrane syringe filter. High Performance Liquid Chromatography (HPLC) was carried out by Agilent 1200 system (Agilent Technologies, Santa Clara, USA) equipped with reverse phase C18 symmetry™ column (Agilent Zorbax SB-Aq, 4.6 mm ID × 250 mm, 5 μm) and a thermostatted column compartment was set at 30 °C. The mobile phase was the solution mixture of methanol/phosphoric acid (10%![[thin space (1/6-em)]](https://www.rsc.org/images/entities/char_2009.gif) :
:![[thin space (1/6-em)]](https://www.rsc.org/images/entities/char_2009.gif) 90%, pH ≈ 3.5). The flow rate was set as 1.0 mL min−1. The detector was flexible wavelength detector (VWD) and the wavelength was 220 nm. The sampling amount was 50 μL.
90%, pH ≈ 3.5). The flow rate was set as 1.0 mL min−1. The detector was flexible wavelength detector (VWD) and the wavelength was 220 nm. The sampling amount was 50 μL.
The UV-Vis absorption peaks of spectrum of guaiacol (the model compounds of lignin) solution under different conditions
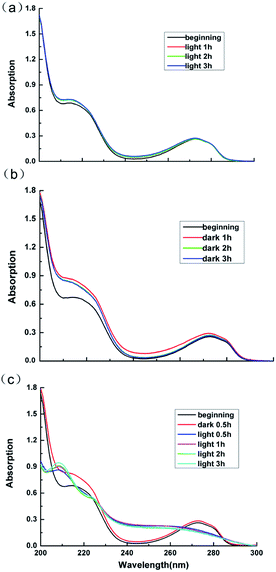
The reaction systems were carried out under three different conditions as following to verify the effect of catalyst and light on the degradation product of guaiacol. The fundamental reaction mixture was composed of guaiacol (10−3 mol L−1, 10 mL) and distilled water (90 mL). In each reaction condition, pristine solution (4 mL) was taken in centrifuge tube as contrast. Take 4 mL solution from the reaction system every hour, then analyze the spectrum by UV-Vis test after centrifugation. The ultraviolet absorption (UV) spectrums of the samples were detected by SHIMADZU UV-Vis 2450 spectrophotometer in the range of 190–350 nm. The light source used in the photocatalytic reaction process was a CEL-HXF1000 high-energy xenon lamp (power density was about 0.56 W cm−2).Results and discussion
The characterization of the photocatalyst
This paper, employing natural sources of porcine bones as the carrier, synthesized SnO2/porcine bone by hydrothermal method and then prepared Ag3PO4/SnO2/porcine bone composite by ion exchange method. The curves of (a)–(c) in Fig. 1 represent the XRD patterns of (a) standard hydroxyapatite, (b) standard SnO2 and (c) standard Ag3PO4, respectively. The curve (d) represents XRD patterns of porcine bone treated by hydrothermal method at 180 °C and then calcined at 500 °C. The typical peaks of the treated porcine bone are in agreement with standard hydroxyapatite (HAP) pattern (curve a), which means the key component is HAP. The curves of (e) and (f) show the X-ray diffraction (XRD) patterns of various samples in different synthetic stages. Mixture of porcine bone powder and SnCl4 aqueous solution was treated by the afore-mentioned method as treated porcine bone, and XRD peaks of the resultant in curve (e) are well consistent with the data of standard tetragonal rutile SnO2 (curve b) and standard hydroxyapatite (HAP) pattern (curve a), indicating the component of resultant is SnO2/HAP composite. In curve (f), XRD pattern of the photocatalyst prepared by impregnating the SnO2/HAP composite with AgNO3 aqueous solution shows peaks corresponding to standard Ag3PO4 (curve c), implying that AgNO3 has transformed to Ag3PO4 during the preparation process.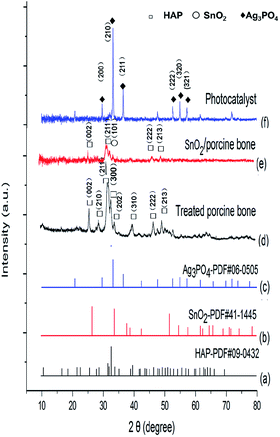 | ||
| Fig. 1 XRD patterns of (a) standard hydroxyapatite, (b) standard SnO2, (c) standard Ag3PO4, (d) treated porcine bone, (e) SnO2/porcine bone, and (f) the photocatalyst. | ||
It is worth noting that HAP structure still exist in the final catalyst although the characteristic peak of (211) of HAP is not obvious enough to find out when compared with the strong intensity of (210) peak of major active component of Ag3PO4. And it may be overlapped by the (101) peak of SnO2 and finally presented as a broad peak in the XRD pattern of Ag3PO4/SnO2/porcine bone composite. The structure of HAP is unable to destroy under the temperature of the entire experimental (≤500 °C), while the decomposition temperature of HAP is proved to above 1000 °C.32 The results of XRD demonstrate the photocatalyst is a composite consisting of Ag3PO4, SnO2, HAP, denominated as Ag3PO4/SnO2/porcine bone.
The morphology of porcine bone treated under 500 °C calcination, SnO2/porcine bone and Ag3PO4/SnO2/porcine bone are shown in Fig. S1.† Fig. S1a† represents the calcined bone powder with porous structure, which is in accordance with the characteristics of hydroxyapatite (HAP). Fig. S1b† shows the bone powder loaded with SnO2 (SnO2/bone), the porous structure of which almost unchanged compared with pure bone powder, indicating SnO2 did not change the basic morphology of the carrier of HAP. Fig. S1c† displays the morphology of SnO2/porcine bone after loading Ag3PO4, on the surface of which small spherical particles of Ag3PO4 can be obviously observed, proving that Ag3PO4 particles distributes on the surface of the catalyst and almost wraps up the SnO2/porcine bone, which can fully contact with the substrate in the catalytic process.
The specific surface area of catalyst was measured by BET method, and the N2 adsorption–desorption isotherms and the derived PSD (pore size distribution) for the as-prepared HAP and Ag3PO4/SnO2/HAP catalyst were displayed in Fig. 2. Fig. 2 shows that HAP and Ag3PO4/SnO2/HAP both exhibit type-IV isotherms following the IUPAC classification, indicating the presence of mesopores. It should be pointed out that the hysteresis loop of the HAP mainly appears in the high pressure region, suggesting its high proportion of large mesopores. According to the PSDs in Fig. 2c, the HAP display typical multiple-region distributions with at several tiny peaks at lower than 10 nm, a dominant peak around 35 nm as well as rich macropores (larger than 55 nm). The pure hydroxyapatite had a loose and hierarchical porous structure with a large specific surface area. While after loading, the pore size of Ag3PO4/SnO2/HAP mainly concentrate in the smaller size of mesoporous distribution (<10 nm), and the larger mesopores disappeared, and some macropores around 80 nm still remained (Fig. 2d). The results could be further corroborated by the change of specific surface area of pure hydroxyapatite (87.22 m2 g−1) and the loaded catalyst Ag3PO4/SnO2 (4.82 m2 g−1). The remarkable decrement on surface area could be resulted from pore blockage after loading SnO2 and Ag3PO4 on the surface, which is common phenomenon for supported catalyst. The results suggested that the load amount of Ag3PO4 and SnO2 during the preparation of the catalyst was high. This result is also consistent with that of SEM image.
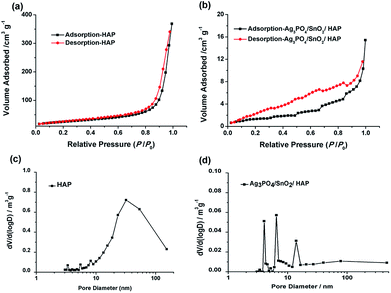 | ||
| Fig. 2 Nitrogen adsorption–desorption isotherms (a and b) and the derived PSD (c and d) for the as-prepared HAP and Ag3PO4/SnO2/HAP catalyst. | ||
The respective function of the three components in the Ag3PO4/SnO2/porcine bone photocatalyst
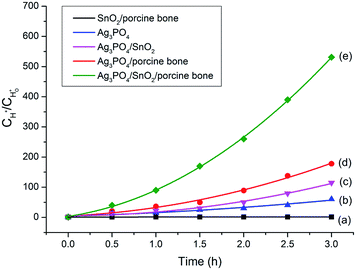
To explore the role of the three components in affecting the photocatalytic activity, conversion experiments of sodium lignin sulfonate were conducted using different samples as catalysts under the same condition. The photocatalytic activity is evaluated by the amount of generated acid generated in the transformation reaction of sodium lignin sulfonate and the results are shown in Fig. 3. The curve (a) in Fig. 3 shows that the acid was scarcely generated in the transformation reaction using SnO2/porcine bone as photocatalyst. This revealed that SnO2/porcine bone showed no catalytic activity in the photo-oxidation reaction. Firstly, this could be ascribed to the fact that HAP and SnO2 has no absorption response to the visible light due to their wide band gap (4.85 eV and 3.8 eV, respectively), which could only be excited by ultraviolet light, thus exhibiting rarely activity for photocatalytic degradation. The impact could be also confirmed by the UV-Vis DRS and the band gap value obtained from the Tauc plot of Ag3PO4/SnO2 and Ag3PO4/SnO2/porcine bone composites (ESI; Fig. S2†). The optical band gap of Ag3PO4/SnO2 is 2.23 eV, while the Eg of Ag3PO4/SnO2/porcine bone was determined to be 2.60 eV, which mainly came from Ag3PO4 (2.4 eV). The higher band gap of Ag3PO4/SnO2/porcine bone and Ag3PO4/SnO2 over Ag3PO4 indicated SnO2 and HAP may not contributed to the optical absorption.33,34 However, the acid amount of the reaction system was increased by prolonging the reaction time when Ag3PO4 was added into the individual materials of SnO2 and HAP as the curves of (c and d) in Fig. 3 reveals. These results established the subject status of Ag3PO4 in the composite, which predominately promoted the photocatalyst conversion.35While naked Ag3PO4 used as photocatalyst for the conversion reaction, the amount of generated acids scarcely increased after 2.5 h (Fig. 3b), indicating that pure Ag3PO4 has essentially lost its photocatalytic activity at this point. It is worth noting that the photocatalytic stability and activity of the Ag3PO4/SnO2/porcine bone composite are much higher than that of the pure Ag3PO4 under the reaction condition, confirming the assistant action of both SnO2 and porcine bone. The specific function of SnO2 can be explained in the form of the band structure diagram of the composite photocatalyst (as shown in the Scheme 1). For Ag3PO4/SnO2 photocatalysts, the conduction band and valence band potentials of SnO2 are more positive than that of Ag3PO4. Therefore, the photogenerated electrons in the Ag3PO4 can be easily transferred to the surface of the SnO2, and the photo induced holes remain on the surface of Ag3PO4, which promotes the effective separation of photoexcited electron–hole pairs and decreases the probability of electron–hole recombination, resulting in the increment of the photocatalytic activity.35
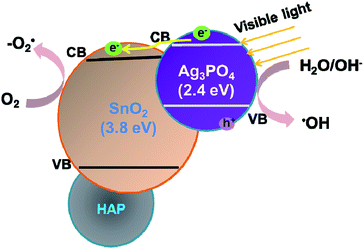 | ||
| Scheme 1 Schematic model for the Ag3PO4/SnO2/porcine bone for the high photocatalytic activity under visible light irradiation. | ||
Simultaneously, porcine bone acts as the supporter and provides PO43− during the preparation of the photocatalyst. The enhanced photocatalyst activity of Ag3PO4/SnO2/porcine bone composite compared with Ag3PO4/SnO2 could be attributed to the abundant hierarchical porosity of HAP composed of mesopores connected with macropores, which has been confirmed by the PSD of HAP in the above Fig. 2c. HAP with featured porous structure facilitates the adsorption ability of organic reactant and promotes the photocatalyst rate.33,34 Also, it is widely accepted that hierarchical porous photocatalysts are beneficial to the enhancement of photocatalytic performance, due to more surface active sites, easier mass transportation,36 and higher light-harvesting efficiency. Especially, the existence of mesopores favors multilight scattering/reflection, resulting in enhanced harvesting of the exciting light37–39 and thus improved reaction activity, which may account for the outstanding performance and photocatalytic activity of Ag3PO4/SnO2/porcine on the conversion reaction in contrast with Ag3PO4/SnO2.
In summary, the enhanced performance of the Ag3PO4/SnO2/porcine bone composites under visible light was owed to the synergistic effect including the matched energy band structures and hierarchical porous effect.
Activity of the photocatalyst can be also affected by factors including the mass ratio of SnO2/porcine bone and AgNO3, concentration of AgNO3 in the impregnating solution, and the impregnation time. The mass ratio of SnO2/porcine bone and AgNO3 has the most significant effect on activity of the photocatalyst among these factors, and its specific effect on photocatalytic activity is shown in Fig. S3,† which is also evaluated by the generated acid in the reaction system under the same condition. The activity of the photocatalyst shows consistent growth as the mass ratio of SnO2/porcine bone vs. AgNO3 varied from 1![[thin space (1/6-em)]](https://www.rsc.org/images/entities/char_2009.gif) :
:![[thin space (1/6-em)]](https://www.rsc.org/images/entities/char_2009.gif) 1 to 1
1 to 1![[thin space (1/6-em)]](https://www.rsc.org/images/entities/char_2009.gif) :
:![[thin space (1/6-em)]](https://www.rsc.org/images/entities/char_2009.gif) 3 (ESI; Fig. S3†), and then the activity of the photocatalyst declines when the mass ratio exceeds 1
3 (ESI; Fig. S3†), and then the activity of the photocatalyst declines when the mass ratio exceeds 1![[thin space (1/6-em)]](https://www.rsc.org/images/entities/char_2009.gif) :
:![[thin space (1/6-em)]](https://www.rsc.org/images/entities/char_2009.gif) 3. It can be concluded that the optimized mass ratio of SnO2/porcine bone and AgNO3 is 1
3. It can be concluded that the optimized mass ratio of SnO2/porcine bone and AgNO3 is 1![[thin space (1/6-em)]](https://www.rsc.org/images/entities/char_2009.gif) :
:![[thin space (1/6-em)]](https://www.rsc.org/images/entities/char_2009.gif) 3, when the catalyst synthesized demonstrates the highest photocatalytic activity.
3, when the catalyst synthesized demonstrates the highest photocatalytic activity.
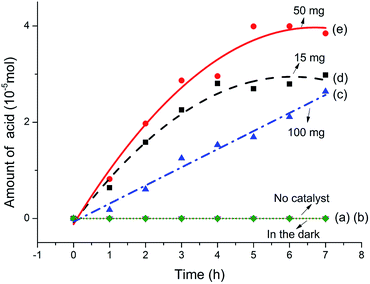
Fig. 4 summarizes the amount of acid generated varies with reaction time. It can be seen from Fig. 4a and b that almost no acid produced neither in the dark with catalyst nor exposure under visible light without catalyst during the reaction process. These results suggest that both visible light irradiation and the catalyst are indispensable for the photodegradation conversion of sodium lignin sulfonate. The amount of generated acid increases obviously along with the prolongation of reaction time as shown in Fig. 4c–e. In addition, the dosage of the catalyst significantly affected the amount of acid generated in the reaction system. When adding the dosage of the catalyst from 15 mg to 50 mg per 100 mL reaction system, the amount of generated acid increased obviously. Dynamics of the photocatalytic degradation of sodium lignin sulfonate can be divided into three stages: a much faster grow process occurred initially in the reaction, followed by a transition stage and a lag stage (with a much slower rise rate) in the final stage of the reaction. The result is in accordance with heterogeneous catalysis principles, which means increasing the amount of photocatalyst more electron–hole pairs can formed, thus produce more active substances and accelerate the degradation reaction within reasonable limits.40 However, when the dosage of the catalyst was up to 100 mg per 100 mL reaction system, the amount of generated acid decreased markedly. This may be ascribed to the raised of turbidity and opacity of the suspension reaction solution and boosted light scattering caused by excessive photocatalyst addition, which would lead to the depression of the photocatalytic reaction rate. Besides, the slowly increased concentration of acid may be attributed to the adsorption of by-product gas (CO2) on the catalyst surfaces. Thus parts of the active sites may be occupied by the gas formed during the degradation reaction, and intermediates may compete for the sites on the catalyst surface.
Analysis of the photocatalytic product of the conversion reaction
To confirm the structure of acid generated in the product, the samples of sodium lignin sulfonate and the photodegraded product were characterized by FT-IR in the wavenumber range of 4000–500 cm−1 (Fig. 5). Compared with the FT-IR spectrum of sodium lignin sulfonate (Fig. 5a), a new band in the FT-IR spectrum of the product appearing at 1763 cm−1 can be attributed to C![[double bond, length as m-dash]](https://www.rsc.org/images/entities/char_e001.gif) O stretching (Fig. 5b), indicating the generation of carboxylic acid during the conversion. In addition, several bands between 1600 cm−1 and 1200 cm−1 ascribed to the benzene skeleton vibration obviously disappear. According to the results, we speculate that the generated acid may derive from the oxidation of benzene rings in sodium lignin sulfonate.
O stretching (Fig. 5b), indicating the generation of carboxylic acid during the conversion. In addition, several bands between 1600 cm−1 and 1200 cm−1 ascribed to the benzene skeleton vibration obviously disappear. According to the results, we speculate that the generated acid may derive from the oxidation of benzene rings in sodium lignin sulfonate.
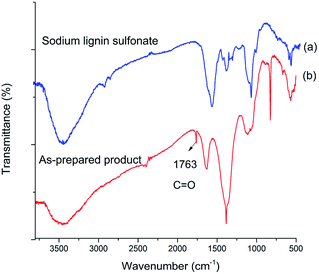 | ||
| Fig. 5 FT-IR spectrum of (a) sodium lignin sulfonate, and (b) as-prepared product arising from the conversion. | ||
To prove the speculation above, UV spectrum of sodium lignin sulfonate and the photodegraded product were detected (in Fig. 6). The concentration of both samples are 50 mg/100 mL. UV absorption peak of benzene ring in lignin usually located at 280 nm.41 As shown in Fig. 6, the peak at 280 nm for the product sample (Fig. 6b) is much weaker than that for sodium lignin sulfonate (Fig. 6a). Moreover, there appears a new peak at 210 nm assigned to carboxylic acid in the product sample in contrast with the UV spectrum of sodium lignin sulfonate. These variations suggest that the benzene rings of sodium lignin sulfonate can be oxidized to carboxylic acid, which confirm the speculation of the FT-IR analysis above.
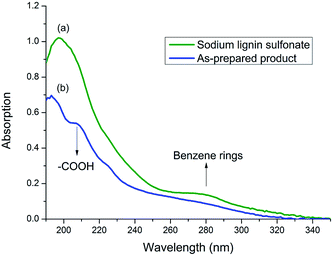 | ||
| Fig. 6 UV spectrum of samples of sodium lignin sulfonate (a) and the as-prepared product (b) obtained from the conversion. | ||
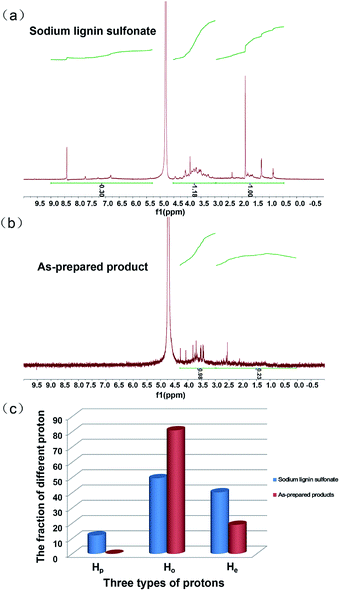
The 1H NMR characterization of sodium lignin sulfonate and the photodegraded product were performed to quantitatively confirm the reduction of benzene rings in the conversion reaction. To clearly show the signal variation of the benzene rings of the reactant, we adopted a set of numerical indices to provide metrics for classifying the chemical transformations in the product and the reactant.42 He represents the fraction of protons bound to aliphatic carbons (chemical shift between 3.0 and 0.5 ppm). Hp is the fraction of protons on the aromatic ring (chemical shift between 9.0 and 7.0 ppm). Ho refers to the fraction of proton next to the oxygen atom (chemical shift between 5.0 and 3.0 ppm). According to the previously reported method,42 we calculated that the values of Hp, Ho and He for reactant were about 12.10, 49.58 and 40.32, respectively (Fig. 7a). From Fig. 7b, the calculated values of Hp, Ho and He for the as-prepared product were about 0.00, 80.99 and 19.01, respectively.
These calculated results are summarized in Fig. 7c. It is worth noting that the fraction of protons on the aromatic ring (Hp) approximates to zero, indicating nearly complete conversion of the aromatic rings in the reactant. In addition, the fraction of proton adjacent to the oxygen atom (Ho) significantly increases as shown in Fig. 7c, suggesting that a large amount of carboxyl forms in the product and derives from the oxidation of benzene rings in the reactant. The result is in accordance with that of UV, FT-IR spectra. Nonetheless, we have to point out that there is some ambiguity in the determination of aliphatic and aromatic –OH protons since they do not always appear in the range of chemical shift.42
In order to investigate the difference in molecular weight between the reactant sodium lignin sulfonate and the as-prepared product, GPC measurements were carried out. As displayed in Fig. 8, the components with molecular weights 1282 Da and 464 Da are the most abundant ones in sodium lignin sulfonate (Fig. 8a), while the GPC trace of the as-prepared product (Fig. 8b) shifts to lower molecular weight direction with a bi-modal shape (in double peak mode). It is clear that the peak molecular weight values of the as-prepared product are lower than those of the reactant sodium lignin sulfonate, indicating that the reactant is partially depolymerized during the conversion. It is well known that the major structure of typical lignin is phenylpropane monomers linked together through C–O bonds of α- and β-arylalkyl ethers. When its benzene rings are oxidized in the conversion, the depolymerization of the sodium lignin sulfonate is inevitable, leading to the decrease of molecular weight of the product.
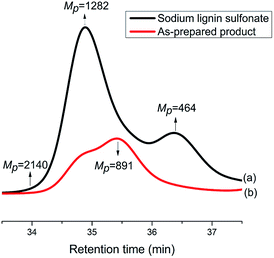 | ||
| Fig. 8 GPC traces of sodium lignin sulfonate (a) and the as-prepared products arising from the conversion (b). | ||
ESI-MS experiments were performed for the evaluation of depolymerization degree of the reactant sodium lignin sulfonate during the conversion process. Fig. 9a and b shows the ESI-MS spectra of sodium lignin sulfonate and the as-prepared product, respectively. In Fig. 9a, the molar mass of sodium lignin sulfonate shows a wide distribution (ranging from 50 Da to 1400 Da) and most of the fragments' signals appear in the region from 50 Da to 800 Da. Whereas in Fig. 9b, the fragments of the as-prepared product mainly appear in the region from 50 Da to 350 Da. It is notable that the signals in the region from 350 Da to 800 Da drastically reduce after degradation. These results demonstrate the partial depolymerization of sodium lignin sulfonate during the conversion process, which is consistent with the GPC results.
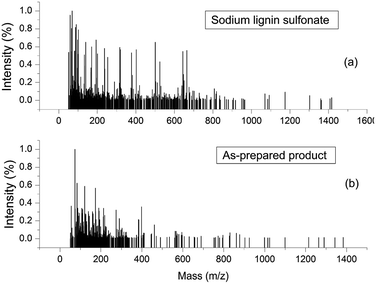 | ||
| Fig. 9 ESI-MS spectra of sodium lignin sulfonate (a) and the as-prepared product arising from the conversion (b). | ||
Photocatalytic mechanism of the conversion reaction
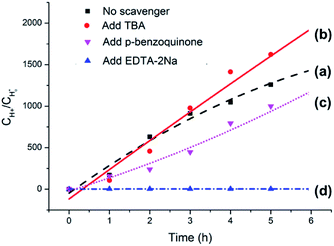
The origin of photocatalytic activity is primarily associated with Ag3PO4 in the Ag3PO4/SnO2/porcine bone composite according to the analyses above. Previously reported experimental results have demonstrated that Ag3PO4 semiconductor possesses extremely high visible-light photocatalytic activity and can achieve quantum efficiencies up to 90% at wavelengths greater than 420 nm.43,44 When the Ag3PO4 semiconductor absorbs a photon with energy equal to or greater than its band-gap, an electron from the valence band is excitated to the conduction band, resulting in the formation of an electron–hole pair (e−CB + h+VB). The photogenerated electron (e−CB) can be captured by O2 absorbed on the surface of the catalyst to generate a superoxide radical (·O2−). Part of the superoxide radicals (·O2−) combines with water from solvent to form hydroxyl radicals (·OH). The photogenerated holes, superoxide radicals, and hydroxyl radicals are possibly the oxidizing species in the photocatalytic oxidation processes.45,46To clarify the dominating oxidizing species determining the photocatalytic oxidation performance of the Ag3PO4/SnO2/porcine bone composite for the conversion of lignin sulfonate into acids, a series of experiments were performed and the results were summarized in Fig. 10. Curve (a) in Fig. 10 illustrates the generated acid amount during the conversion of sodium lignin sulfonate vs. test time in the absence of the scavenger using the as-prepared composite as photocatalyst under visible light irradiation and ambient pressure at room temperature. Curve (b) represents the generated acid amount in the same reaction condition when 5 mM tert-butanol (TBA) as hydroxyl radicals (·OH) scavenger was added into the sodium lignin sulfonate aqueous solution. Compared with curve (a), the tert-butanol hardly affects the photocatalytic oxidation performance of this photocatalyst, indicating that the hydroxyl radicals (·OH) are not the dominated active oxidative species in the photocatalytic oxidation of sodium lignin sulfonate. Curve (c) shows the oxidation transformation tendency of sodium lignin sulfonate catalyzed by the Ag3PO4/SnO2/porcine bone composite in the solution containing 5 mM p-benzoquinone as the capture agent for superoxide radicals (·O2−), and acids still generated. The result implies that the photocatalytic oxidation performance is not obviously affected by the decrease of superoxide.
However, the acid could scarcely generated when 5 mM EDTA-2Na was added into the reaction system as the capture agent for photo-generated holes under the same condition, as indicated by curve (d) in Fig. 10, suggesting that direct holes oxidation mainly govern the photocatalytic process.47,48 It is worth noting that the oxidation efficiency of photo-generated holes highly depends on the O2 molecules from the air, which is benefit for the stability of the holes by obtaining electrons from the photocatalyst and efficiently separating the electron–hole pairs. Since the primary structure of lignin is composed of a diversely linked network of electron-rich phenylpropanols, it is very reasonable that holes, the positively charged electron vacancies, are the major active oxidative species in the oxidation process of sodium lignin sulfonate.
The possible degradation pathway of lignins
Lignins are aromatic polymers with amorphous structure and containing structural units of oxo-phenylpropanol or its derivatives in the molecular structure. Due to its structural complexity and variability and the difficulty in the analysis of the products of the photocatalytic degradation reaction, model compounds with β-O-4 linkage, which represents the most typical substructure in lignin, are often adopted to disclose the chemical issues in lignin valorization.49 Thus guaiacol, the model compounds of lignin is employed in this work to explore the products of the photocatalytic reaction.Fig. 11 displays the UV-Vis absorption peaks of spectrum of guaiacol solution under different conditions. As can be seen from Fig. 11a and b, the absorption peaks of sample of guaiacol without catalyst after 3 h photoreaction as well as the samples of guaiacol with Ag3PO4/SnO2/porcine bone composites as catalyst after 3 h dark reaction almost remain the same as the original guaiacol. The features peak of benzene ring of guaiacol at 272 nm doesn't disappear, while no new carboxyl absorption peak appears. According to the result of UV-Vis data in Fig. 11c, the absorption peaks of spectrum of guaiacol solution with Ag3PO4/SnO2/porcine bone composites as catalyst after 30 min dark reaction and the original guaiacol almost keep consistent, and the features peak of benzene ring of guaiacol at 272 nm still exists. While with the beginning of the photoreaction, the features peak of benzene ring of guaiacol disappear, while a new carboxyl absorption peak appears at 210 nm. Furthermore, with the prolonging of photoreaction time, the intensity of the absorption peak of carboxyl gradually increases.
To sum up, guaiacol does not degrade neither under the condition of light without photocatalyst nor in dark environment with the photocatalyst. Only when the catalyst and the light coexist, can the photodegradation of guaiacol occur, and the benzene ring of guaiacol be broken to form carboxylic acid compounds.
In order to explore the mechanism of benzene of guaiacol being interrupted and the certain kinds of carboxylic acids with the simultaneous existence of catalysts and light, the degradation products were analyzed by HPLC (High Performance Liquid Chromatography, as shown in ESI; Fig. S4†). From the analysis results of the degradation products of guaiacol, the main alkyl acids were maleic acid, oxalic acid, formic acid and methoxy acetic acid (as displayed in Table 1).
On the basis of the results the detection of HPLC of small molecular acids, we propose the possible degradation pathways of the guaiacol, and the reaction process can be inferred and shown in Scheme 2. On the one hand, guaiacol converts into o-dihydroxybenzene and formic acid through demethylation reaction with the simultaneous existence of catalysts and holes induced by light, following by the formation of maleic acid and oxalic via acid ring-opening reaction of the o-dihydroxybenzene, and oxalic acid and formic acid subsequently converted by maleic acid. On the other hand, guaiacol generates methoxy acetic acid and maleic acid through direct ring-opening reaction, and finally maleic acid converts into oxalic acid together with formic acid in the presence of catalyst and light inducing holes.
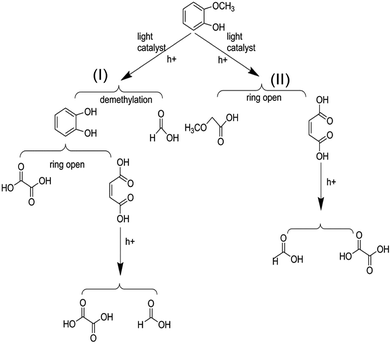 | ||
| Scheme 2 Possible reaction process of the photocatalytic conversion of guaiacol, the model compounds of lignin. | ||
Conclusions
In summary, a new catalytic preparation approach for the conversion of lignin derivatives to alkyl acids has been developed. The photocatalytic reaction is driven by visible light at room temperature and at ambient pressure. The synthesized composite photocatalyst is characterized and the role of each component of the catalyst playing in the photocatalytic reaction is also explored. The composite of the photocatalyst for the conversion reaction involves Ag3PO4 acting as the major active component, while SnO2 and porcine bone as cocatalyst contribute to improve the photocatalytic activity and stability of the Ag3PO4. The enhanced activity of the Ag3PO4/SnO2/porcine bone composite may be attributed to the matched potential of valence band of Ag3PO4 and SnO2 semiconductors by decreasing the probability of electron–hole recombination. Besides, the hierarchical porous structure of supporter HAP may increase the adsorption of organics and light-harvesting, and also boost mass transport. This paper analyzes the change of the molecular weight of the sodium lignosulfonate system and the certain structure of the degradation products in the photocatalytic reaction, proving the partial depolymerization of sodium lignin sulfonate and the oxidization of benzene rings into alkyl acids. At last, the photocatalytic reaction mechanism was discussed. The predominant oxidizing species in the photocatalytic oxidation reaction were the photogenerated holes on the surface of the photocatalyst. From the analysis results of the degradation products of the model compounds, guaiacol, the main alkyl acids were turned out to be maleic acid, oxalic acid, formic acid and methoxy acetic acid. Our research may provide a new approach to economical and eco-friendly utilization of lignin derivatives to produce liquid biofuels and high-value chemicals for sustainable development.Conflicts of interest
There are no conflicts to declare.Acknowledgements
This work was financially supported by the National Natural Science Foundation of China (No. 51173059), the Natural Science Foundation of Hubei Province of China (Program No. 2017CFB281) and Fundamental Research Funds for the Central Universities of China (Program No. 2662015QD044).Notes and references
- M. Madadi and A. Abbas, J. Plant Pathol. Microbiol., 2017, 8, 398, DOI:10.4172/2157-7471.1000398.
- J. Dai, A. Patti, L. Longé, G. Garnier and K. Saito, Chemcatchem, 2017, 9, 2684–2690 CrossRef.
- J. F. Blandez, S. Navalón, M. Alvaro and H. Garcia, Chemcatchem, 2015, 7, 3020–3026 CrossRef.
- A. J. Ragauskas, G. T. Beckham, M. J. Biddy, R. Chandra, F. Chen, M. F. Davis, B. H. Davison, R. A. Dixon, P. Gilna, M. Keller, P. Langan, A. K. Naskar, J. N. Saddler, T. J. Tschaplinski, G. A. Tuskan and C. E. Wyman, Science, 2014, 344, 1246843 CrossRef PubMed.
- K. Barta, G. R. Warner, E. S. Beach and P. T. Anastas, Green Chem., 2014, 16, 191–196 RSC.
- C. Awungacha Lekelefac, N. Busse, M. Herrenbauer and P. Czermak, Int. J. Photoenergy, 2015, 2015, 1–18 CrossRef.
- H. Wang, X. Qiu, W. Liu and D. Yang, Appl. Surf. Sci., 2017, 426, 206–216 CrossRef.
- A. W. Pelzer, M. R. Sturgeon, A. J. Yanez, G. Chupka, M. H. O'Brien, R. Katahira, R. D. Cortright, L. Woods, G. T. Beckham and L. J. Broadbelt, ACS Sustainable Chem. Eng., 2015, 3, 1339–1347 CrossRef.
- K. R. Alunga, Y. Y. Ye, S. R. Li, D. Wang and Y. Liu, Catal. Sci. Technol., 2015, 5, 3746–3753 RSC.
- M. R. Sturgeon, M. H. O'Brien, P. N. Ciesielski, R. Katahira, J. S. Kruger, S. C. Chmely, J. Hamlin, K. Lawrence, G. B. Hunsinger, T. D. Foust, R. M. Baldwin, M. J. Biddy and G. T. Beckham, Green Chem., 2014, 16, 824–835 RSC.
- E. Lam and J. H. T. Luong, ACS Catal., 2014, 4, 3393–3410 CrossRef.
- S. K. Singh and J. D. Ekhe, Catal. Sci. Technol., 2015, 5, 2117–2124 RSC.
- H. M. Liu and Y. L. Liu, Bioresour. Technol., 2014, 151, 424–427 CrossRef PubMed.
- M. Schwiderski, A. Kruse, R. Grandl and D. Dockendorf, Green Chem., 2013, 16, 1569–1578 RSC.
- P. Langan, L. Petridis, H. M. O'Neill, S. V. Pingali, M. Foston, Y. Nishiyama, R. Schulz, B. Lindner, B. L. Hanson and S. Harton, Green Chem., 2013, 16, 63–68 RSC.
- A. G. Sergeev and J. F. Hartwig, Science, 2011, 332, 439–443 CrossRef PubMed.
- Y. Nakasaka, T. Yoshikawa, Y. Kawamata, T. Tago, S. Sato, T. Takanohashi, Y. Koyama and T. Masuda, Chemcatchem, 2017, 9, 2875–2880 CrossRef.
- W. J. Liu, X. S. Zhang, Q. Yanchao, J. Hong and H. Q. Yu, Green Chem., 2012, 14, 2226–2233 RSC.
- S. Hu, X. Luo and Y. Li, ChemSusChem, 2014, 7, 66–72 CrossRef PubMed.
- D. Ravelli, D. Dondi, M. Fagnoni and A. Albini, Chem. Soc. Rev., 2009, 38, 1999–2011 RSC.
- Y. Wang, X. Wang and M. Antonietti, ChemInform, 2012, 51, 68–89 Search PubMed.
- J. Gong, A. Imbault and R. Farnood, Appl. Catal., B, 2017, 204, 296–303 CrossRef.
- D. Zhou, Z. Chen, Q. Yang, C. Shen, G. Tang, S. Zhao, J. Zhang, D. Chen, Q. Wei and X. Dong, Chemcatchem, 2016, 8, 3175 CrossRef.
- V. Augugliaro, G. Camera-Roda, V. Loddo, G. Palmisano, L. Palmisano, F. Parrino and M. A. Puma, Appl. Catal., B, 2012, 111–112, 555–561 CrossRef.
- S. H. Li, S. Liu, J. C. Colmenares and Y. J. Xu, Green Chem., 2016, 18, 594–607 RSC.
- R. Prado, X. Erdocia and J. Labidi, Chemosphere, 2013, 91, 1355–1361 CrossRef PubMed.
- H. Li, Z. Lei, C. Liu, Z. Zhang and B. Lu, Bioresour. Technol., 2015, 175, 494–501 CrossRef PubMed.
- H. El Hajjouji, F. Barje, E. Pinelli, J. R. Bailly, C. Richard, P. Winterton, J. C. Revel and M. Hafidi, Bioresour. Technol., 2008, 99, 7264–7269 CrossRef PubMed.
- L. Tonucci, F. Coccia, M. Bressan and N. d'Alessandro, Waste Biomass Valorization, 2011, 3, 165–174 CrossRef.
- J. D. Nguyen, B. S. Matsuura and C. R. Stephenson, J. Am. Chem. Soc., 2014, 136, 1218–1221 CrossRef PubMed.
- Z. Lin, W. Song and H. Yang, Sens. Actuators, B, 2012, 173, 22–27 CrossRef.
- C. Liao, F. Lin, K. Chen and J. Sun, Biomaterials, 1999, 20(19), 1807–1813 CrossRef PubMed.
- M. Hu, Z. Yao, X. Liu, L. Ma, Z. He and X. Wang, J. Taiwan Inst. Chem. Eng., 2018, 85, 91–97 CrossRef.
- Y. Liu, C. Y. Liu, J. H. Wei, R. Xiong, C. X. Pan and J. Shi, Appl. Surf. Sci., 2010, 256, 6390–6394 CrossRef.
- L. Zhang, H. Zhang, H. Huang, Y. Liu and Z. Kang, New J. Chem., 2012, 36, 1541–1544 RSC.
- S. Fan, B. Fang, J. H. Kim, J. J. Kim, J. S. Yu and J. Ko, Appl. Phys. Lett., 2010, 96, 063501 CrossRef.
- B. Fang, A. Bonakdarpour, K. Reilly, Y. Xing, F. Taghipour and D. P. Wilkinson, ACS Appl. Mater. Interfaces, 2014, 6, 15488–15498 CrossRef PubMed.
- B. Fang, Y. Xing, A. Bonakdarpour, S. Zhang and D. P. Wilkinson, ACS Sustainable Chem. Eng., 2015, 3, 2381–2388 CrossRef.
- T. Zhao, Z. Liu, K. Nakata, S. Nishimoto, T. Murakami, Y. Zhao, L. Jiang and A. Fujishima, J. Mater. Chem., 2010, 20, 5095 RSC.
- X. Lang, X. Chen and J. Zhao, Chem. Soc. Rev., 2013, 43, 473–486 RSC.
- F. Coccia, L. Tonucci, D. Bosco, M. Bressan and N. D'Alessandro, Green Chem., 2012, 14, 1073–1078 RSC.
- K. Barta, T. D. Matson, M. L. Fettig, S. L. Scott, A. V. Iretskii and P. C. Ford, Green Chem., 2010, 12, 1640–1647 RSC.
- Y. Bi, S. Ouyang, N. Umezawa, J. Cao and J. Ye, J. Am. Chem. Soc., 2011, 133, 6490–6649 CrossRef PubMed.
- L. Liu, J. Liu and D. D. Sun, Catal. Sci. Technol., 2012, 2, 2525–2532 RSC.
- O. Tomita, B. Ohtani and R. Abe, Catal. Sci. Technol., 2014, 4, 3850–3860 RSC.
- Y. Bu and Z. Chen, ACS Appl. Mater. Interfaces, 2014, 6, 17589–17598 CrossRef PubMed.
- T. Xu, L. Zhang, H. Cheng and Y. Zhu, Appl. Catal., B, 2011, 101, 382–387 CrossRef.
- Y. He, L. Zhang, M. Fan, X. Wang, M. L. Walbridge, Q. Nong, Y. Wu and L. Zhao, Sol. Energy Mater. Sol. Cells, 2015, 137, 175–184 CrossRef.
- Y. Yang, H. Fan, J. Song, Q. Meng, H. Zhou, L. Wu, G. Yang and B. Han, Chem. Commun., 2015, 51, 4028–4031 RSC.
Footnote |
| † Electronic supplementary information (ESI) available. See DOI: 10.1039/c8ra04962a |
| This journal is © The Royal Society of Chemistry 2018 |

