 Open Access Article
Effect of dry water on methane separation and recovery from coal mine gas based on hydrate
Qiang Zhang *ab,
Chenwei Liab,
Qiang Wuab and
Baoyong Zhangab
aDepartment of Safety Engineering, Heilongjiang University of Science & Technology, Harbin 150022, Heilongjiang, China. E-mail: zq3946630@163.com
bNational Central Laboratory of Hydrocarbon Gas Transportation Pipeline Safety, Harbin 150022, Heilongjiang, China
First published on 31st July 2018
Abstract
Coal mine gas (CMG) is a form of unconventional natural gas and its reserves are abundant. However, a large proportion of coal mine gas cannot be used owing to the low concentration of the extraction gas. The hydrate-based method can be used for the separation and recovery of methane from coal mine gas. To devise an economic and efficient method for the separation of mine gas using hydrates, dry water (DW) was used as the carrier for separation under conditions in which the initial pressure was fixed at 10 MPa and the temperature was set at 274 K. On this basis, repeated gas hydrate separation experiments were carried out three times. A pure-water system, a stirring system, and a system using a compound solution of 1 mol L−1 THF + 500 mg L−1 SDS were used in control experiments. The spectral characteristics of the gas hydrates in pure water were determined by Raman spectroscopy, and the hydration index was calculated. The concentrations of gas components in the equilibrium gas phase were determined by chromatography. Moreover, the hydrate formation rate, methane recovery rate, distribution coefficient and separation factor were also calculated. The results indicate that the average gas hydrate formation rate was up to 6.85 × 10⁻⁴ mol min−1 in the presence of the THF + SDS solution. The maximum average methane recovery rate was 38.15%, the average distribution coefficient was up to 1.99, the average separation factor reached 2.47 and the highest methane concentration in the hydrate phase was 32.2% in DW. In the experimental range, the efficiency of DW in the recovery of methane by gas hydrate separation was greater than that of the stirring system and the system using the THF + SDS compound solution.
1 Introduction
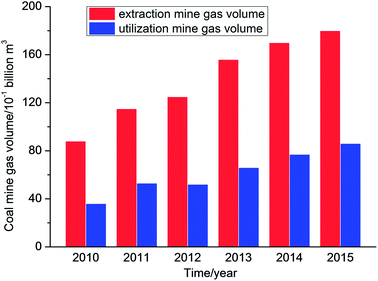
Coal mine gas (CMG) is a gas mixture that is composed of coal bed methane (CBM) and mainly consists of methane. Methane is a source of clean, efficient and high-quality energy. However, methane is also a potent greenhouse gas and can destroy ozone.1–3 According to IEA statistics, China's coal seams are buried at a depth of 2000 m and geological resources of CBM are about 36.81 trillion m3, which ranks third in the world.4 However, data showed that the volume of coal mine gas extracted in China was 83.4 billion m3 with a utilization volume of 37 billion m3, and hence the utilization rate was less than 45% from the year 2010 to 2015 (Fig. 1).5The main reasons for the low utilization rate are that the distribution of CBM resources is not concentrated and these are far from the industrial areas that utilize mine gas. In addition, the reserves in some areas are limited and the costs of storage and transportation are also higher. Furthermore, the majority of extraction gas contains large amounts of nitrogen and oxygen, which will reduce the methane concentration in CMG; therefore, the extraction gas cannot be directly used, which results in the direct discharge of a quantity of extraction gas, which is not only a waste of resources but also a form of environmental pollution.6
Hydrates are non-stoichiometric crystalline solid clathrate structures that consist of water and small molecules such as methane, ethane, carbon dioxide and nitrogen, which are formed under certain conditions of temperature and pressure.7 Extraction gas is mainly composed of methane, nitrogen and oxygen, and these three kinds of gas can form hydrates under certain conditions, but the phase equilibrium is totally different. On this basis, the separation and purification of methane from CMG could be achieved by controlling the hydration reaction pressure at the same temperature.8,9 Moreover, hydrates have a high gas storage capacity. The volume ratio of hydrates to stored gas is 1![[thin space (1/6-em)]](https://www.rsc.org/images/entities/char_2009.gif) :
:![[thin space (1/6-em)]](https://www.rsc.org/images/entities/char_2009.gif) 170 at normal atmospheric pressure, and hence the hydrate method can be used to separate, recover, store and transport methane in CMG.10
170 at normal atmospheric pressure, and hence the hydrate method can be used to separate, recover, store and transport methane in CMG.10
In research, the key scientific problems in the hydrate method of separation of gas mixtures are how to speed up the rate of hydrate separation, increase the gas storage capacity of hydrates, and improve the rate of recovery of methane to increase the selectivity of separation.11 As a result, in order to improve the performance of hydrate separation of gas mixtures, some researchers have proposed a variety of methods, such as the addition of a promoter (SDS,12 THF,13 TBAB,14 or TBAF15) or porous materials (silica,16 carbon nanotubes,17 activated carbon,18 nanoparticles,19 dry gels,20 foams,21 hydrogels,22 or polymers23), mechanical stirring (bubbling,24 stirring,25 or spraying26) and changing the thermodynamic conditions (increasing the pressure27 or lowering the temperature28). In the above studies, some researchers have also compared different methods of promoting hydrate formation. Zheng and Linga15 examined the promoting effect of TBAF on the hydrate formation process to investigate the hydrate method of recovering carbon dioxide produced during pre-combustion. Moreover, Zhao Y. S.29 and Zhao J. Z.30 carried out gas hydrate experiments in systems of 5A-type zeolites and porous media such as SBA-15 mesoporous materials. The influence of thermodynamic promoters and porous media on hydrate formation has been investigated. Linga31 comprehensively clarified the effect of reactor designs and materials that are employed on the hydrate formation rate.
The essence of the above method is to improve the solubility of gases in the liquid phase so as to speed up the rate of hydrate formation and increase the gas storage capacity of the hydrate phase. The results indicate that the presence of an additive has a certain promoting effect on the hydrate formation rate, but the additive has a greater influence on the purity of the gas separated by the hydrate. Methods of mechanical stirring and changing the thermodynamic conditions lose more energy in comparison with previous methods.
Dry water (DW) is a kind of functional material with high dispersibility, which is mainly composed of water encapsulated by nanoscale hydrophobic particles. DW has a high liquid storage capacity and flowability.32,33 DW particles form a free-flowing powder in which coalescence of the water droplets is prevented by the hydrophobic modified silica coating at the water–air interface. As such, they have a higher surface-to-volume ratio than bulk water. Therefore, the finely dispersed water droplets lead to greatly enhanced kinetics of clathration in a gaseous system, which results in an increased rate of methane hydrate formation in comparison with bulk water.34,35
It has been found that DW can increase the gas storage capacity of natural gas hydrates36 in a static system, although the influence of DW on techniques for the separation of gas mixtures has not yet been reported. Therefore, DW was used as the carrier for separation instead of the traditional liquid environment to improve the material and heat transfer conditions in the gas hydrate separation process. In addition, the effect of DW on the gas hydrate separation kinetics and rate of recovery of methane was studied including some other key parameters of hydrate separation.
2 Experiments
2.1 Experimental apparatus
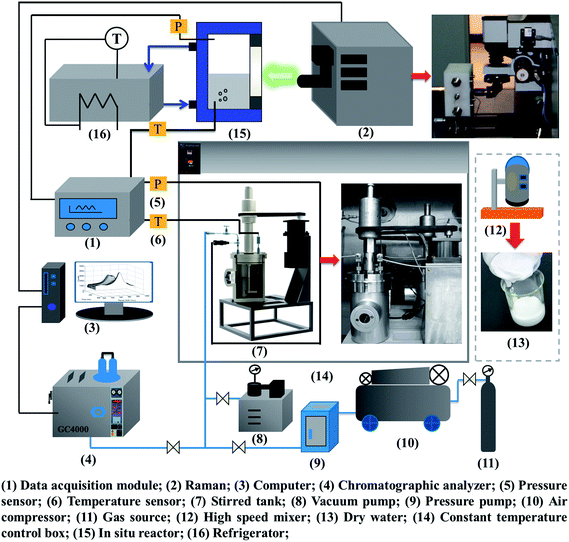
According to the study objectives, a high-pressure device for gas hydrate separation was built independently, as shown in Fig. 2. The experimental device mainly comprised a gas pressurization system, a gas hydrate reaction system, a DW preparation system, a data acquisition system, a Raman testing system and a chromatographic analysis system.The core equipment was a stirring reactor with a volume of 1000 mL, a temperature range of 263.15–323.15 K and a limit pressure of 20 MPa. It was equipped with a servomotor, which drove the stirring of the reactor at an adjustable speed in the range of 0–200 rpm. Temperature and pressure data for gas hydrate separation were collected by a temperature sensor and a pressure sensor and then transmitted by an FCC6000 field data server and BT 5000 monitoring configuration software, and were finally stored in an industrial control computer. The Raman spectroscopic measurement system was based on an HR 800 Raman spectrometer produced by JY Corporation, France. It was equipped with a 532 nm laser source and an in situ reactor, which was used for in situ observations of the hydrate. An MS-B homogeneous emulsifying machine with high shear and dispersion rates was the key component of the DW preparation system. The speed range was 1–2.8 × 10⁴ rpm. An SUS 304 stainless steel dispersing cutter head was used to achieve homogeneous stirring. An image acquisition system recorded macroscopic phenomena of gas hydrate separation in real time. The gas chromatographic analysis system consisted of a gas-phase chromatographic analysis workstation using 5000 A software, which was used to determine the mole fractions of the gas components accurately before and after hydrate separation with an accuracy of 0.01%. The temperature set by the temperature control system ranged from 253.15 K to 313.15 K with an accuracy of ±0.1 K.
2.2 Experimental samples and reagents
The purity of hydrophobic silica (HB630-SiO2), THF and SDS in this experiment was >99.8%, and the composition of the raw gas mixture was G: φ(methane) = 20%, φ(nitrogen) = 64%, φ(oxygen) = 16%.2.3 Experimental procedure
![[thin space (1/6-em)]](https://www.rsc.org/images/entities/char_2009.gif) 000 rpm and started. The mixture of water and 5 g HB630-SiO2 was stirred for 90 seconds at a speed of 19
000 rpm and started. The mixture of water and 5 g HB630-SiO2 was stirred for 90 seconds at a speed of 19![[thin space (1/6-em)]](https://www.rsc.org/images/entities/char_2009.gif) 000 rpm, and then the power was turned off and the dry water that was prepared was removed. The above operation was repeated 20 times to obtain 2000 g dry water as a stand-by. According to the mass fractions of the gas phase, hydrophobic SiO2 in DW, deionized water and SiO2 were added to the stirring vessel. The homogeneous emulsifying machine with high shear and dispersion rates was started, and the D gear (1.9 × 10⁴ rpm) was selected for stirring, which was continued for 90 s to prepare DW.
000 rpm, and then the power was turned off and the dry water that was prepared was removed. The above operation was repeated 20 times to obtain 2000 g dry water as a stand-by. According to the mass fractions of the gas phase, hydrophobic SiO2 in DW, deionized water and SiO2 were added to the stirring vessel. The homogeneous emulsifying machine with high shear and dispersion rates was started, and the D gear (1.9 × 10⁴ rpm) was selected for stirring, which was continued for 90 s to prepare DW.(2) Next, 500 mL DW was added to the experimental reactor, and the experimental equipment was connected with reference to Fig. 2. The tightness of the experimental system was confirmed with pure nitrogen.
(3) The system was vacuumed with a vacuum pump to make the system reach a pressure of 0.01 MPa.
(4) The experimental temperature control system was set to 274 K to cool the reactor. When the temperature in the reactor reached 274 K, the gas was passed into the reactor utilizing the pressurization system until an initial pressure of 10 MPa was reached.
(5) The changes in temperature and pressure in the process of gas hydrate formation were monitored by the data acquisition system.
(6) The pressure in the reactor did not change any longer, which indicated that the system had reached its equilibrium state. The gas-phase chromatographic analysis system was used to determine the mole fractions of the gas components in the residual gas phase when the gas hydrate separation process ended.
(7) In accordance with the above procedure and Table 1, the materials in the reactor were replaced successively, and the experiment was carried out. Experiments using four kinds of experimental system were repeated three times in each case.
| Experiment number | System | Mechanical stirring | Sample | Initial pressure/MPa | Initial temperature/K |
|---|---|---|---|---|---|
| I | Pure water | Static state | φ(methane) = 20%, φ(nitrogen) = 64%, φ(oxygen) = 16% | 10 | 274 |
| II | Pure water | Stirring | |||
| III | 1 mol L−1 THF + 500 mg L−1 SDS compound solution | Static state | |||
| IV | Dry water | Static state |
(2) When the temperature reached 274 K, the experiment gas was injected into the in situ reactor to replace the air. Then, the reactor was pressurized until the pressure reached 10 MPa.
(3) A confocal Raman spectrometer was employed with a 50× telephoto lens, a 532 nm laser, a power of 40 mW, a 400 μm confocal hole aperture and a 200 μm slit aperture. Monocrystalline silicon was utilized for correction before the hydrates were tested. The Raman shift was 520.7 cm−1.
(4) When the pressure reached an equilibrium state, the spectrum of the hydrate was recorded by the Raman spectrometer, and the exposure time was 60 s.
3 Experimental results and calculations
3.1 Experimental results
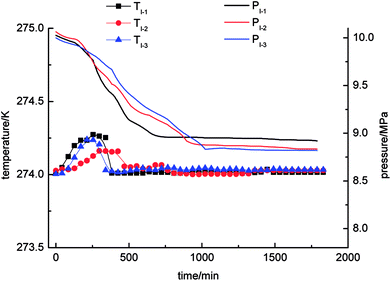
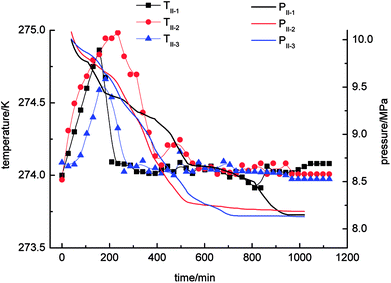
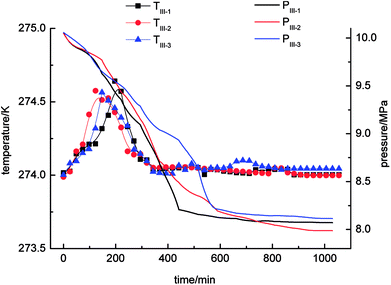
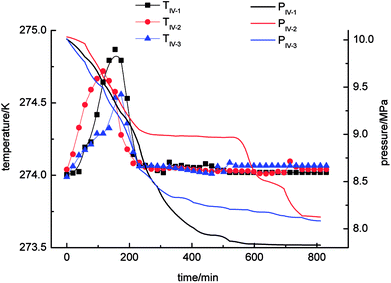
Three cycles of gas hydrate separation experiments were carried out in four systems, namely, static-water, stirring-water, static-SDS + THF compound solution and static-DW, respectively. Curves of the changes in temperature and pressure with time are shown in Fig. 3–6. A state of equilibrium was achieved, as the system pressure was constant and the gas hydrate reaction ended simultaneously.As Fig. 3 demonstrates, it was found that the pressure exhibited a decreasing trend with time in the static-water system, and the equilibrium pressures were 8.92 MPa, 8.83 MPa, and 8.82 MPa, respectively. In comparison with the other experimental systems, it could be concluded that the pressure in the static-water system declined least, which indicated low gas consumption during the process of gas hydrate separation. The system temperature increased first and then decreased with time in the process of gas hydrate separation. The range of the changes in temperature was from 274 K to 274.3 K. The gas hydrate separation mechanism mainly exploited the characteristics of methane, nitrogen and oxygen that the phase equilibrium pressures in the formation of the three kinds of gas hydrate were different under conditions of the same temperature. Methane had a lower phase equilibrium pressure in the formation of its hydrate with water, which enabled the separation of methane from nitrogen and oxygen. The formation of the hydrate was dominant in this period and was a kind of exothermic process. Therefore, the system temperature would change during the process of gas hydrate separation. Because the experiment was carried out at a constant temperature of 274 K, the heat generated by formation of the hydrate would be gradually lost to the environment and then reach an equilibrium state. Moreover, the site of hydrate formation, volume and distribution were random in each experiment, which resulted in great differences in the system temperature between different cycles of the experiments.
With regard to Fig. 4, the pressure in the stirring-water system decreased gradually during the gas hydrate reaction. The three cycles of the experiments were all accompanied by a stage of rapid decline in gas pressure. These periods were 0–526 min (II-1), 0–511 min (II-2) and 0–706 min (II-3), respectively, during which the gas hydrate formed rapidly and a large amount of gas was incorporated into the hydrate phase to make the gas pressure decrease rapidly. The equilibrium pressures in experiments II-1, II-2, and II-3 were 8.15 MPa, 8.19 MPa and 8.13 MPa, respectively. When experiment II-1 had been carried out for 526 min, the pressure dropped to 8.67 MPa as the gas pressure entered a stage of relative equilibrium (526–1045 min), then declined again and finally reached an equilibrium state. There was no such equilibrium stage in experiments II-2 and II-3. The temperature in the stirring-water system increased first and then declined during gas hydrate separation. The range of the changes in temperature during the three cycles of the experiments was 274–275 K, which represented a great change in comparison with the other three systems. It was concluded that the stirring-water system was the only dynamic system among the four experimental systems, and the others were all static systems. Therefore, the heat generated during the stirring process would affect the temperature of the system. The gas-phase pressures in experiments III-1, III-2 and III-3 were very different when the equilibrium state was reached, and the equilibrium pressures were 7.83 MPa, 8.12 MPa and 8.08 MPa, respectively. The range of the system temperatures was 274–274.9 K, which was similar to that in the stirring-water system. The gas hydrate separation process required less time in the static-SDS + THF compound solution system, and the time taken to reach equilibrium was also shorter in comparison with the other systems. It was indicated that the SDS + THF compound solution promoted the formation of gas hydrates.
 | ||
| Fig. 5 Curves of changes in temperature and pressure with time for the static-SDS + THF compound solution system. | ||
As shown in Fig. 6, the gas-phase pressure decreased gradually during gas hydrate separation in the static-DW system. The final equilibrium pressures in experiments IV-1, IV-2 and IV-3 were 8.07 MPa, 7.99 MPa and 8.11 MPa, respectively. In the three experiments, the trend of the variation in the gas-phase pressure with time was similar in that it dropped rapidly at the beginning of the gas hydrate separation process and then gradually reached an equilibrium state. In addition, the trend of the change in temperature with time was that it increased at first and then decreased. The range of the changes in temperature was 274–274.6 K.
By a comprehensive comparison of the four experimental systems (static-water, stirring-water, static-SDS + THF compound solution and static-DW), it was found that the tendencies of the changes in pressure and temperature were very similar, with little fluctuations during the three cycles of experiments in the static-water system and static-SDS + THF compound solution system. The pressure in the static-water system exhibited a great decline in comparison with that in the other three systems, which indicated that stirring, the THF + SDS compound solution and DW could increase the gas capacity in hydrate-based separation. The testing and calculation parameters for each experimental system are shown in Table 2.
| Experiment number | Final gas pressure/MPa | Mole fraction of methane in equilibrium gas/% | Mole fraction of methane in hydrate phase/% | Formation rate/10−4 mol min−1 | Methane recovery rate/% | Distribution coefficient | Separation factor |
|---|---|---|---|---|---|---|---|
| I-1st | 8.92 | 19.95 | 20.33 | 1.62 | 13.23 | 1.02 | 1.02 |
| I-2nd | 8.83 | 19.91 | 20.55 | 1.68 | 14.49 | 1.03 | 1.04 |
| I-3rd | 8.82 | 19.84 | 20.96 | 1.59 | 14.92 | 1.06 | 1.07 |
| II-1st | 8.15 | 17.12 | 29.91 | 4.66 | 33.68 | 1.75 | 2.07 |
| II-2nd | 8.19 | 15.58 | 35.34 | 4.79 | 39.53 | 2.27 | 2.96 |
| II-3rd | 8.13 | 17.87 | 27.28 | 4.60 | 30.87 | 1.53 | 1.72 |
| III-1st | 7.83 | 17.05 | 28.37 | 7.31 | 36.96 | 1.66 | 1.93 |
| III-2nd | 8.12 | 17.16 | 29.59 | 6.28 | 33.80 | 1.72 | 2.03 |
| III-3rd | 8.08 | 18.01 | 26.63 | 6.96 | 30.73 | 1.48 | 1.65 |
| IV-1st | 8.07 | 16.07 | 33.03 | 5.11 | 38.27 | 2.06 | 2.58 |
| IV-2nd | 7.99 | 16.81 | 29.91 | 4.81 | 36.41 | 1.78 | 2.11 |
| IV-3rd | 8.11 | 15.77 | 33.67 | 4.28 | 39.78 | 2.14 | 2.71 |
3.2 Calculation of gas hydrate separation parameters
In this paper, the gas consumption rate was used to define the gas hydrate formation rate by the equation:
 | (1) |
According to the PR state equation, the gas capacity in gas hydrate formation was calculated:
 | (2) |
 | (3) |
 | (4) |
| α(Tr) = [1 + m(1 − Tr0.5)]2 | (5) |
| m = 0.37464 + 1.54226w − 0.26992w2 | (6) |
Eqn (3)–(6) were incorporated into eqn (2) using the Excel single variable to solve the equation:
 | (7) |
The variable cell was set to be the solution parameter V and the target value that was chosen was 0. The value of VM was determined by calculation. The corresponding quantity of gas at the selected point was calculated according to eqn (7):
 | (8) |
| VG = V0G − ΔVH | (9) |
 ,
,  and
and  are the molar volumes in cm3 mol−1 of methane, nitrogen and oxygen, respectively, VG0 is the initial gas volume in cm3, VG represents the gas volume in cm3 after equilibrium was reached in the gas hydrate formation process, and nCH4, nN2 and nO2 are the molar quantities of methane, nitrogen and oxygen, respectively.
For hydrates of type I, the cavity density is ρH = 0.796 g cm−3. For hydrates of type II, the cavity density is ρH = 0.786 g cm−3, according to eqn (10):
 | (10) |
The hydration index α was calculated using eqn (11)–(16):
| θL/θS = IL/3IS | (11) |
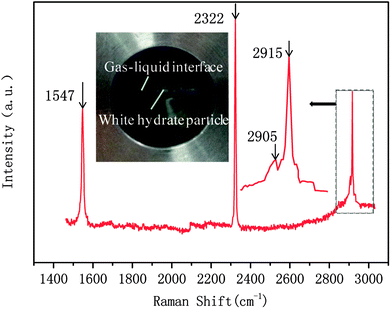
In this study, a gas hydrate of a methane–nitrogen–oxygen mixture was obtained from gas sample experiments. Therefore, the relative occupancy rates of methane, nitrogen and oxygen were initially calculated by deconvolution of Raman spectra. In order to calculate the occupancy rates of methane, nitrogen and oxygen in large and small cages, the van der Waals–Platteeuw statistical thermodynamic model of hydrates is needed. The gas hydrate was tested by Raman spectroscopy, which demonstrated four Raman peaks, and the Raman shifts were 1547 cm−1, 2322 cm−1, 2905 cm−1 and 2915 cm−1, respectively. In combination with research by other scholars, it was found that the peak at 1547 cm−1 was due to O–O bonds, that at 2322 cm−1 was due to N–N bonds and those at 2915 cm−1 and 2905 cm−1 corresponded to C–H bonds, respectively. The Raman test results showed that for nitrogen and oxygen only a single N–N Raman peak and one O–O Raman peak were detected. In theory, two N–N peaks and two O–O peaks should have appeared. However, researchers have only observed one N–N peak and one O–O peak for hydrates of natural air thus far, which contradicted the predictions of theory that molecules of nitrogen and oxygen could enter both types of cage. Hondoh37 held the opinion that the surrounding environment of molecules of nitrogen and oxygen in the two types of cage was consistent, and the stretching vibrations of molecules were also very similar. As a result, it was difficult for Raman spectral resolution to distinguish them, and hence only one Raman peak appeared. The hypothetical test results were calculated on the basis of two assumptions. Assumption 1 was that both nitrogen and oxygen entered large crystal cages in the hydrate; assumption 2 was that both nitrogen and oxygen entered small cages, according to the following equations:
 | (12) |
 | (13) |
| ΔμW,H = ΔμW,L | (14) |
Under conditions of air–water–hydrate equilibrium, the difference in chemical potential between molecules in the type I hydrate lattice and the type I hydrate is usually represented by ΔμW,H, which was 1297 J mol−1. By combining the relative occupancy rates using eqn (12)–(14), the occupancy rates of methane, nitrogen and oxygen in large and small cages could simultaneously be calculated.
The hydration index was calculated as follows:
 | (15) |
 | (16) |
In terms of eqn (15) and (16), it was calculated that αmax = 7.39 and αmin = 5.75. The hydration index of the methane–nitrogen–oxygen mixed gas hydrate was hence between 5.75 and 7.39, and the average value in this study was 6.57 (Fig. 7).
Finally, the gas hydrate formation rates in the static-water system, stirring-water system and static-DW system, respectively, were calculated according to the above formulae. In the static-SDS + THF compound solution system, the gases only occupied small crystal cages, because THF could form a hydrate of type II and occupy the large crystal cages in the hydrate.38,39 The ideal molecular formula of hydrates of type II was 24 M·136H2O (M is the guest molecule), and the cell structure was 8(51264)16(512)·136H2O, in which the ratio of large crystal cages (51264) to small crystal cages (512) was 1![[thin space (1/6-em)]](https://www.rsc.org/images/entities/char_2009.gif) :
:![[thin space (1/6-em)]](https://www.rsc.org/images/entities/char_2009.gif) 2. It was assumed that the gases completely filled the small crystal cages, and the hydration index was assumed to be 8.5 when the gas hydrate formation rate was calculated. The results are shown in Table 2.
2. It was assumed that the gases completely filled the small crystal cages, and the hydration index was assumed to be 8.5 when the gas hydrate formation rate was calculated. The results are shown in Table 2.
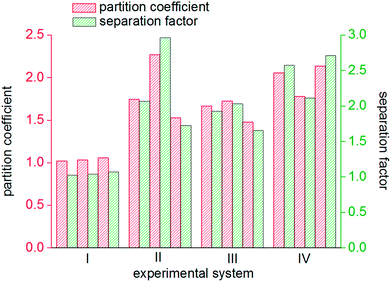
The distribution coefficient40 K, which was the ratio of the mole fractions of methane in the equilibrium gas phase and the hydrate phase when gas hydrate formation ended and reached an equilibrium condition, represented the methane transfer property and difficulty of separation into two phases. The formula used for calculating the distribution coefficient K was:
 | (17) |
 and
and  are the mole fractions of methane in the gas hydrate phase and the equilibrium gas phase, respectively.
The recovery rate mainly reflected the amount of methane recovered in the process of gas hydrate separation, and the equation used for calculating it was as follows:41
 | (18) |
In eqn (18),  is the molar quantity of methane in the hydrate phase and
  is the molar quantity of methane in the initial gas.
On the basis of the experimental data, an equation for the separation factor S.F.42 was derived as follows:
 | (19) |
 and
and  are the amounts of nitrogen and oxygen, respectively, in the hydrate phase and
  ,
,  and
and  are the amounts of methane, nitrogen and oxygen, respectively, in the equilibrium gas phase. The results of calculations of the separation factor, distribution coefficient and methane recovery rate are listed in Table 2.
4 Results, discussion and analysis
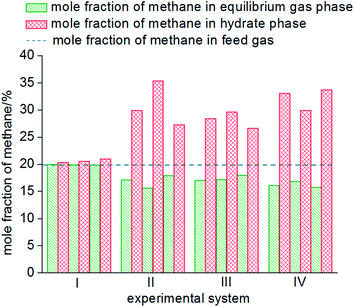
As seen from Fig. 8, the mole fractions of methane in the hydrate phase in all four systems (static-water, stirring-water, static-SDS + THF compound solution and static-DW) were higher than that in the raw gas, which was 20%, which indicated that the gas hydrate separation method could purify methane. In the static-water system, the average mole fraction of methane in the hydrate phase during the three cycles of experiments was 20.61%; that in the stirring-water system was 30.84%; and those in the static-SDS + THF compound solution and static-DW systems were 28.20% and 32.20%, respectively. Stirring and the addition of the THF + SDS compound solution and DW all improved the separation and purification functions of the gas hydrate in comparison with the static-water system. Here, the concentration of methane after purification in the stirring-water system was similar to that in the static-DW system, and these were both higher than that in the THF + SDS compound solution system. Deugd43 and Delahaye44 suggested that the presence of THF can reduce the phase equilibrium pressure in the formation of a hydrate in a gas hydrate formation system. Hashimoto45 observed that THF entered large cages in type II hydrates by Raman spectroscopy and X-rays. The promoting mechanism is that THF can form a type II hydrate before the gas to form a kind of basic hydrate, which provides the material basis for gas hydrate formation. The diameter of THF molecules is too large for them to enter the small cages of the hydrate, whereas gas molecules can pass into small cages directly, which reduces the phase equilibrium pressure in gas hydrate formation. The diameter of small cages in a type II hydrate is 0.391 nm, and methane, nitrogen and oxygen can all enter the small cages in a type II hydrate. The main principle of hydrate-based separation of a methane–nitrogen–oxygen gas mixture is that the phase equilibrium pressure displayed striking differences under conditions of the same temperature. The basic hydrate formed by THF exhibited no selectivity for methane, nitrogen or oxygen. Therefore, THF reduced the difference in phase equilibrium between the three kinds of gas and thus affected the separation efficiency. As a result, the concentration of methane after purification in the hydrate phase in the static-SDS + THF compound solution system was lower than that in the stirring-water and static-DW systems, and the promoting mechanism in the above two systems performed similarly, which increased the interfacial area between the gas and liquid phases to achieve solubilization and increase the concentration after gas hydrate separation. The DW system mainly depended on the effect of the gas phase in hydrophobic silica, which could disperse water to a great extent. In this study, the volume of the experimental reactor was 1000 mL with an inner diameter of 9.5 cm and a gas–liquid interface area of 70.85 cm2. According to the results of Carter46 and other researchers, the average diameter of a DW droplet is 50 μm, and the area of the gas–liquid interface in DW synthesized using 500 mL water was 59![[thin space (1/6-em)]](https://www.rsc.org/images/entities/char_2009.gif) 999.69 cm2, which represented an increase by a factor of approximately 847.
999.69 cm2, which represented an increase by a factor of approximately 847.
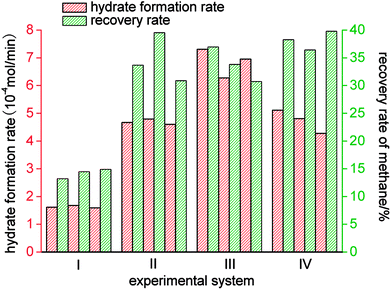
As shown in Fig. 9 and Table 2, of the average rates of gas hydrate separation in the three cycles of repeated experiments in the four systems, that in the static-SDS + THF compound solution system was the fastest, with a value of 6.85 × 10⁻⁴ mol min−1; the DW system ranked second with a rate of 4.73 × 10⁻⁴ mol min−1; the rate in the stirring-water system was 4.68 × 10⁻⁴ mol min−1; and the slowest was that in the static-water system, with a value of 1.63 × 10⁻⁴ mol min−1. On the basis of the above data, it was confirmed that stirring, the addition of dry water and the addition of the SDS + THF compound solution could all increase the gas hydrate formation rate, which increased by 5.22 × 10⁻⁴ mol min−1, 3.10 × 10⁻⁴ mol min−1 and 3.05 × 10⁻⁴ mol min−1, respectively, in comparison with the static-water system. By comparing Fig. 3 with Fig. 6, it was found that the total reaction period in the static-SDS + THF compound solution system was shorter, and the reaction quickly reached an equilibrium state. It was discovered from the temperature–time curves that the temperature changed greatly during the process of gas hydrate separation in the stirring-water system, which affected heat transfer, increased the difficulty of the system reaching an equilibrium state and also extended the reaction time, which resulted in a reduction in the gas hydrate formation rate. It is revealed from Fig. 6 that the temperature displayed a slight fluctuation in the static-DW system and changed with a similar trend in the three cycles of repeated experiments, which indicated that DW not only increased the area of the gas–liquid interface but also made heat transfer reach a stable state in the process of gas hydrate separation.
The gas hydrate recovery rate in the static-DW system was demonstrated to be the highest, with an average value of 38.15%, whereas those in the stirring-water system and static-SDS + THF compound solution system were 34.69% and 33.83%, respectively. The minimum average recovery rate was 14.21% in the static-water system. This indicated that DW performed better in the recovery of methane from gas mixtures by hydrate-based separation in comparison with the other three systems. The average gas consumption in the static-water system was 0.32 mol, and those in the stirring-water and static-DW systems were 0.52 mol and 0.55 mol, respectively. The greatest gas consumption was 0.56 mol in the static-SDS + THF compound solution, but the recovery rate was lower than that in the DW system, which implied that the concentration of methane in the hydrate phase was lower, which showed a consistent tendency with that in Fig. 8. It was calculated that the corresponding phase equilibrium pressures in the THF–methane, THF–nitrogen and THF–oxygen systems were 0.118 MPa, 0.412 MPa and 0.262 MPa, respectively, at a temperature of 274 K using the Chen-Guo model. In contrast, the phase equilibrium pressure of the THF–gas mixture (with mole fractions of φ(methane) = 20%, φ(nitrogen) = 64%, and φ(oxygen) = 16%) was 0.279 MPa at the same temperature. The initial pressure in this experiment was 10 MPa, at which the discrepancy in phase equilibrium between the three gases was smaller. As a result, methane, nitrogen and oxygen could meet the phase equilibrium conditions and form hydrates with a strong driving force, and the above three gases were all able to enter the same cage structure and compete with each other, which thus affected the methane content of the hydrate phase. At a temperature of 274 K, the phase equilibrium pressure of water–methane was 2.758 MPa, and those of water–nitrogen and water–oxygen were 17.812 MPa and 16.951 MPa, respectively, which revealed that the phase equilibrium pressures of the three kinds of gas differed greatly at the same temperature. However, for the gas mixture, the phase equilibrium pressure was 8.795 MPa at the same temperature. At the initial pressure of 10 MPa, methane was the only gas that was able to meet the phase equilibrium conditions for the hydrate. Water was highly dispersed in the DW system, and the phase equilibrium conditions for the gas mixture were not changed. Therefore, the methane content in the hydrate phase in the DW system was higher, and the recovery rate was higher than that in the mixing system, which indicated that in terms of water dispersion capacity DW performed better, and the solubilization effect on the gas was also stronger in comparison with that in the stirring system. Moreover, gas hydrate formation was affected by mechanical heat in the stirring system, and the gas phase in silica in DW could disperse water droplets, which was able to dissipate the heat generated in the process of hydrate formation over time. Hence, the recovery of methane in the DW system was the highest. It is found from Fig. 10 that the average distribution coefficients of the four systems (static-water, stirring-water, static-SDS + THF compound solution and static-DW) were 1.04, 1.85, 1.62, and 1.99, respectively, which showed that the separation of the gas mixture in the DW system was the least difficult. The separation factors of the above four systems were 1.04, 2.25, 1.85 and 2.47, respectively, which indicated that the degree of separation and purification by hydrate formation was highest in the DW system. On the basis of previous data, it was proved that the methane content of the gas hydrate phase was higher and the enrichment ability for methane was stronger in the DW system than those in the other two systems except for the static-water system, with similar gas consumption rates.
5 Conclusions
In this study, a gas mixture was obtained (φ(methane) = 20%; φ(nitrogen) = 64%; φ(oxygen) = 16%) with an initial pressure of 10 MPa and an initial temperature of 274 K. On the basis of the Raman spectral characteristics, it was calculated that the gas hydration index was in the range of 5.75–7.39. The results of chromatography demonstrated that stirring, the addition of a THF + SDS compound solution and the addition of DW could all enhance the separation and purification effects of gas hydrates in comparison with a pure-water system. Here, the concentration of methane after purification in the DW system was higher than the average concentration after purification in the two other systems (stirring and THF + SDS solution) and reached 32.2%, which was higher than that of the raw gas by 12.2%. In the DW system, water was highly dispersed by the gas phase in hydrophobic silica and the area of the gas–liquid interface was enlarged by a factor of 847 in comparison with that in the static-water system, which increased the rate of dissipation of heat and improved the thermal stability. In the DW system, the gas hydrate recovery rate was the highest at an average of 38.15%; the maximum average distribution coefficient was 1.99; and the highest average separation factor was 2.47, with the least difficulty in gas hydrate separation and the highest degree of separation and purification. In this study, the DW system performed better than the other systems in gas hydrate separation to recover methane. On the basis of the results, the authors will extend the research in the next step to study the effect of modified DW on the gas hydrate separation process and seek more efficient methods for promoting gas hydrate separation.Conflicts of interest
There are no conflicts to declare.Acknowledgements
This work was supported by the National Natural Science Foundation of China (No. 51404102, 51334005), the Natural Science Foundation of Heilongjiang Province (No. JJ2018QN0076), the Youth Innovation Talents Training Program in Universities and Colleges of Heilongjiang Province (No. UNPYSCT-2017140) and the Basic Research Projects of Basal Scientific Research Fund in Heilongjiang Provincial Colleges and Universities.References
- U. Takahisa, Sci. China: Technol. Sci., 2010, 40, 28–32 Search PubMed.
- Y. P. Cheng, L. Wang and X. L. Zhang, Int. J. Greenhouse Gas Control, 2011, 5, 157–166 CrossRef.
- R. Hernández-Gómez, D. Tuma, M. A. Villamañán, M. E. Mondéjar and C. R. Chamorro, J. Chem. Thermodyn., 2014, 68, 253–259 CrossRef.
- Y. Ju, Y. Sun, Z. Sa, J. Pan and J. Wang, Sci. Total Environ., 2016, 543, 514–523 CrossRef PubMed.
- Q. Q. Liu, S. L. Kong and H. F. Wang, J. Residuals Sci. Technol., 2017, 14, 67–75 CrossRef.
- Q. Wu, Q. Zhang and B. Y. Zhang, Safety Sci., 2012, 50, 865–868 CrossRef.
- E. D. Sloan and C. A. Koh, Clathrate Hydrates of Natural Gases, CRC Press, Boca Raton, 3rd edn, 2008, pp. 1–10 Search PubMed.
- D. L. Zhong, Y. Y. Lu, D. J. Sun, W. L. Zhao and Z. Li, Fuel, 2015, 143, 586–594 CrossRef.
- T. M. Narayanan and R. Ohmura, J. Nat. Gas Sci. Eng., 2016, 35, 1511–1518 CrossRef.
- C. A. Koh, A. K. Sum and E. D. Sloan, J. Nat. Gas Sci. Eng., 2012, 8, 132–138 CrossRef.
- Q. Wu and B. Y. Zhang, J. Energy Chem., 2010, 19, 446–451 Search PubMed.
- Y. Zhong and R. E. Rogers, Chem. Eng. Sci., 2000, 55, 4175–4187 CrossRef.
- T. Y. Makogon, R. Larsen, C. A Knight and E. D. Sloan, J. Cryst. Growth, 1997, 179, 258–262 CrossRef.
- V. Belandria, A. Eslamimanesh, A. H. Mohammadi and D. Richon, Ind. Eng. Chem. Res., 2011, 50, 5783–5794 CrossRef.
- J. J. Zheng, P. Zhang and P. Linga, Appl. Energy, 2017, 194, 267–278 CrossRef.
- P. S. R. Prasad, Y. Sowjanya and V. Dhanunjana Chari, J. Phys. Chem. C, 2014, 118, 7759–7764 CrossRef.
- J. Pasieka, S. Coulombe and P. Servio, Chem. Eng. Sci., 2013, 104, 998–1002 CrossRef.
- V. Govindaraj, D. Mech, G. Pandey, R. Nagarajan and J. S. Sangwai, J. Nat. Gas Sci. Eng., 2015, 26, 810–818 CrossRef.
- M. Mohammadi, A. Haghtalab and Z. Fakhroueian, J. Chem. Thermodyn., 2016, 96, 24–33 CrossRef.
- B. O. Carter, W. Wang, D. J. Adams and A. I. Cooper, Langmuir, 2010, 26, 3186–3193 CrossRef PubMed.
- A. Nambiar, P. Babu and P. Linga, Can. J. Chem. Eng., 2015, 93, 808–814 CrossRef.
- F. Su, C. L. Bray, B. Tan and A. I. Cooper, Adv. Mater., 2008, 20, 2663–2666 CrossRef PubMed.
- F. Su, C. L. Bray, B. O. Carter, G. Overend, C. Cropper, J. A. Iggo, Y. Z. Khimyak, A. M. Fogg and A. I. Cooper, Adv. Mater., 2009, 21, 2382–2386 CrossRef.
- B. Sebastien, G. B. Juan and S. Phillip, Fuel, 2010, 89, 294–301 CrossRef.
- G. Nimalan and A. Robert, Chem. Eng. Sci., 2004, 59, 3849–3863 CrossRef.
- M. Takahashi, T. Kawamura, Y. Yamamoto, H. Ohnari, S. Z. Himuro and H. Shakutsui, J. Phys. Chem. B, 2003, 107, 2171–2173 CrossRef.
- T. Kwon, G. Cho and J. C. Santamarina, Geochem., Geophys., Geosyst., 2013, 9, 680 Search PubMed.
- P. Servio and P. Englezos, Fluid Phase Equilib., 2001, 190, 127–134 CrossRef.
- Y. Zhao, J. Zhao, W. Liang, Q. Gao and D. Yang, Fuel, 2018, 220, 185–191 CrossRef.
- J. Zhao, Y. Zhao, W. Liang, S. Song and Q. Gao, Fuel, 2018, 220, 446–452 CrossRef.
- P. Linga and M. A. Clarke, Energy Fuels, 2017, 1, 1–13 CrossRef.
- B. P. Binks and R. Murakami, Nat. Mater., 2006, 5, 865–869 CrossRef PubMed.
- W. Wang, C. L. Bray, D. J. Adams and A. I. Cooper, J. Am. Chem. Soc., 2008, 130, 11608–11609 CrossRef PubMed.
- G. Hu, Y. Ye, C. Liu, Q. Meng, J. Zhang and S. Diao, Fuel Process. Technol., 2011, 92, 1617–1622 CrossRef.
- S. Fan, Y. Liang, Y. Wang, X. Lang and Y. Wen, Chem. Eng. Sci., 2014, 106, 53–59 CrossRef.
- J. Park, K. Shin, J. Kim, H. Lee and Y. Seo, J. Phys. Chem. C, 2015, 119, 1690–1699 CrossRef.
- T. Hondoh, H. Anzai, A. Goto, S. Mae and A. Higashi, J. Inclusion Phenom. Macrocyclic Chem., 1990, 8, 17–24 CrossRef.
- P. Linga, R. Kumar and P. Englezos, Chem. Eng. Sci., 2007, 62, 4268–4276 CrossRef.
- J. Park, S. P. Kang and J. W. Lee, Korean J. Chem. Eng., 2016, 33, 2186–2190 CrossRef.
- M. H. Avazkonandeh-gharavol, H. Haddad-sabzevar and M. Fredriksson, Int. J. Miner., Metall. Mater., 2014, 21, 980–989 CrossRef.
- L. Praveen, K. Rajnish and E. Peter, J. Hazard. Mater., 2007, 149, 625–629 CrossRef PubMed.
- J. Zhao, Y. Zhao and W. Liang, Energy Technol., 2016, 4, 864–869 CrossRef.
- R. M. D. Deugd, M. D. Jager and J. D. S. Arons, AIChE J., 2001, 47, 693–704 CrossRef.
- A. Delahaye, L. Fournaison, S. A Marinhas, I. Chatti and J. P. Petitet, Ind. Eng. Chem. Res., 2015, 45, 391–397 CrossRef.
- S. Hashimoto, M. Shu, T. Sugahara and K. Ohgaki, J. Chem. Eng. Data, 2006, 51, 1884–1886 CrossRef.
- B. O. Carter, D. J. Adams and A. I. Cooper, Green Chem., 2010, 12, 783–785 RSC.
| This journal is © The Royal Society of Chemistry 2018 |

