 Open Access Article
Comparison of enhancement of anaerobic digestion of waste activated sludge through adding nano-zero valent iron and zero valent iron†
Yayi Wang *,
Duanli Wang and
Huiying Fang
State Key Laboratory of Pollution Control and Resources Reuse, Shanghai Institute of Pollution Control and Ecological Security, College of Environmental Science and Engineering, Tongji University, Siping Road, Shanghai 200092, P. R. China. E-mail: yayi.wang@tongji.edu.cn
First published on 31st July 2018
Abstract
The feasibility of adding nano-zero valent iron (NZVI: 0.6, 1.0, 4.0, 10.0 g L−1) to enhance anaerobic digestion of waste activated sludge (WAS) was examined by comparison with ZVI, and the mechanisms of NZVI enhancement of the hydrolysis and methanogenesis processes were elucidated. NZVI could enhance hydrolysis–acidification of WAS by destroying the integrity of microbial cells. Both volatile fatty acids production and the acetic acid portion were greatly improved by NZVI additions, peaking at 4.0 g L−1 NZVI. In anaerobic digestion, CH4 production was promoted at a NZVI dosage ≤1.0 g L−1. The optimum dosage of NZVI for methanogenesis was 1.0 g L−1, and further addition of NZVI could cause inhibition of methanogenesis because of long-term accumulation of H2. ZVI could also improve hydrolysis–acidification and the CH4 yield, but its efficiency was relatively low compared with NZVI, and it could not induce cell wall rupture. 16S rDNA high-throughput sequencing results showed that NZVI addition at appropriate dosage facilitated increasing the proportion of microorganisms involved in WAS hydrolysis–acidification and methanogenesis.
1. Introduction
Anaerobic digestion has been widely used for treatment of waste activated sludge (WAS) in wastewater treatment plants (WWTPs) to recover energy resources such as volatile fatty acids (VFAs) and methane (CH4). The recovery of energy resources from waste activated sludge can equal 70–80% of the energy consumption required to run WWTPs if the efficiency of anaerobic digestion is maximized.1 Therefore, anaerobic digestion of WAS can be one of the key steps to achieve “carbon neutral” or even “carbon positive” WWTPs.2 However, in practical conditions, the sum of energy recovered from WAS anaerobic digestion is only 5–7% of that theoretically available in the raw wastewater, providing only about 33.3% of the energy required for wastewater treatment.3 It is primarily because CH4 production is limited in that only 40–50% of the organics in WAS can be converted into biogas.4To improve biochemical methane potential (BMP), various pretreatments have been adopted to accelerate hydrolysis of WAS, including thermal methods like incineration, gasification and pyrolysis, super- and subcritical wet oxidation, and hydrothermal treatment;5 chemical methods like free nitrous acid (FNA) pretreatment,6 Cd pretreatment,7 alkaline pretreatment, ozone pretreatment, and electrocoagulation;8 and mechanical methods like ultrasound, ballmills, high pressure homogenization, and mechanical jets.9 For example, previous studies showed free nitrous acid (FNA) serving as a pretreatment method for alkaline fermentation could enhance short-chain fatty acid production from WAS as it accelerated disruption of both extracellular polymeric substances and cell envelope.6 Xu et al.7 also found that low concentration of Cd enhanced solubilization, hydrolysis and acidogenesis processes of WAS anaerobic fermentation. However, most of these methods have the disadvantage of low cost-efficiency because of high energy consumption and high chemical agent requirements,8 which has become a great barrier to achieving “carbon neutral” water treatment.10 Therefore, alternative efficient methods are urgently required to enhance anaerobic digestion.
Zero valent iron (ZVI) has been reported to significantly accelerate anaerobic digestion,11,12 and its accelerating efficiency is directly proportional to its specific surface area. Thus, nano-zero valent iron (NZVI), a strong reductant (Eh = −0.44 V), can be more effective than ZVI in accelerating anaerobic digestion because the specific surface area of NZVI is much larger than that of ZVI.13,14 Moreover, when compared with ZVI, NZVI can remove a wider range of pollutant species thoroughly and rapidly, which favors the complete degradation of organics and shortens the reaction time.
So far, however, most relevant studies have examined the impact of ZVI on anaerobic digestion;11,12,15 although there have been a few studies on NZVI, there is still a lack of consensus on the influence of NZVI on anaerobic digestion of WAS.13,14,16 For example, Su et al.14 found that 0.1 wt% of NZVI in anaerobic digestion for 17 days improved the production of biogas and methane by 30.4% and 40.4% respectively. In contrast, inhibition of methanogens at concentrations of 10 mM NZVI and above was observed with a reduction of methane production of 20.0%.16 It seems that the impacts of NZVI on anaerobic digestion are greatly dependent on the NZVI dosage, the sludge characteristics and the microbial structure in the system. Moreover, information is still limited regarding how and why CH4 production is affected by addition of NZVI, but this information is important for understanding the mechanism of the effect(s) of NZVI on anaerobic digestion processes. Therefore, more in-depth and all-round research on the effects of NZVI on anaerobic digestion is required.
In this study, we investigated the effects of different dosages of NZVI on hydrolysis–acidification and the complete anaerobic digestion process of WAS separately and compared them with ZVI addition. Microbial community structure and the relative abundance of hydrolysis–acidification bacteria and methanogenic archaea at different NZVI and ZVI dosages were analyzed by Illumina 16S rRNA high-throughput sequencing. The main objectives of this study were: (1) to verify the feasibility of NZVI enhancing anaerobic digestion; (2) to determine the optimal NZVI dosage for enhancing different stages of anaerobic digestion, including hydrolysis, acidification and methanogenesis; and (3) to elucidate the mechanisms of NZVI enhancing anaerobic digestion. The results help to extend our knowledge regarding the effects of NZVI on WAS anaerobic digestion and may be technically useful for enhancing WAS anaerobic digestion and for energy recovery.
2. Materials and methods
2.1. The experimental sludge and NZVI particle preparation
Anaerobic digestion sludge (ADS) and WAS were used in the present study. The experimental ADS was taken from an anaerobic digester in a municipal WWTP in Shanghai, China; the experimental WAS was taken from the recycling sludge of a secondary sedimentation tank at the same WWTP. WAS was first settled for 8 h and filtered through mesh (1.0 mm), and then stored at 4 °C before use. The properties of the experimental WAS are listed in Table 1. The NZVI synthesis method was shown in ESI, Text S1.† The reduced iron powder (ZVI, 100 mesh) was purchased from Aladdin (Shanghai, China; product ID I116359).| Parameter | Value (mean value ± standard deviation) | Unit |
|---|---|---|
| SS | 18.582 ± 0.225 | g L−1 |
| VSS | 13.056 ± 0.161 | g L−1 |
| pH | 7.64 ± 0.11 | — |
| VFAs | 44.3424 ± 8.871574 | mg COD per L |
| SCOD | 178.6 ± 10.6 | mg L−1 |
| TCOD | 18924.2 ± 281.7 | mg L−1 |
| Liquid-protein | 2.727 ± 0.642 (0.143 ± 0.034) | mg L−1 (mg g per SS) |
| EPS-protein | 185.0 ± 3.860 (9.685 ± 0.202) | mg L−1 (mg g per SS) |
| Liquid-polysaccharides | 6.178 ± 0.008 (0.333 ± 0.004) | mg L−1 (mg g per SS) |
| EPS-polysaccharides | 79.74 ± 9.721 (4.288 ± 0.471) | mg L−1 (mg g per SS) |
2.2. Experimental approach
2.3. Analytical methods
| fd = B0 − B(t) | (1) |
In this study, B0 and k were calculated to evaluate the influence of NZVI on the whole anaerobic digestion process. The estimations were made by fitting methane production data to a first order kinetic model using Aquasim 2.1 with an objective function of residual sum of squares.19 A single substrate type model was used in this study (eqn (2))20
| B(t) = B0(1 − e−kt) | (2) |
SCOD and VSS reduction were measured and the method was introduced in details in ESI, Text S3.†
3. Results
3.1. Solubilization, reduction and bacterial live/dead ratio of WAS during hydrolysis–acidification at different NZVI/ZVI dosages
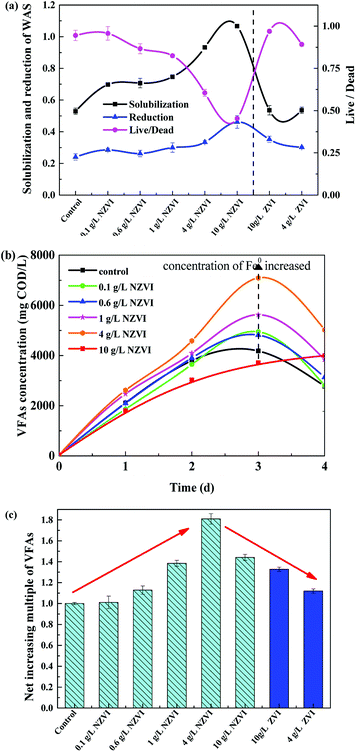
As shown in Fig. 1a, the solubilization of the WAS continuously increased, from 69.8% to 106.7%, as NZVI addition increased from 0.1 to 10.0 g L−1. At 10.0 g L−1 NZVI addition, the solubility of the WAS was 201.5% of the level in the control. In contrast, addition of 4 or 10 g L−1 ZVI had little impact on the solubility of the WAS. The WAS degradation rate improved with increasing NZVI additions from 0.0 to 10.0 g L−1, and VSS reduction reached a maximum value of 46.2% at 10.0 g L−1 NZVI, being 91.8% higher than that in the control. When 4.0 or 10.0 g L−1 ZVI were added, the sludge reduction was greater than that in the control, but much less than that with 4.0 or 10.0 g L−1 NZVI addition.The live/dead ratio in the WAS sharply decreased after NZVI addition (Fig. 1a). In particular, when 10.0 g L−1 NZVI were added, the live/dead ratio of the experimental WAS was only 0.45, approximately 53.0% lower than that in the control, indicating significant death of biomass when exposed to 10.0 g L−1 NZVI. However, ZVI additions of 4 and 10 g L−1 had little impact on the live/dead ratio. It seems that NZVI could accelerate hydrolysis and improve biodegradability by cell membrane disruption.8
3.2. VFA production during hydrolysis–acidification at different NZVI/ZVI dosages
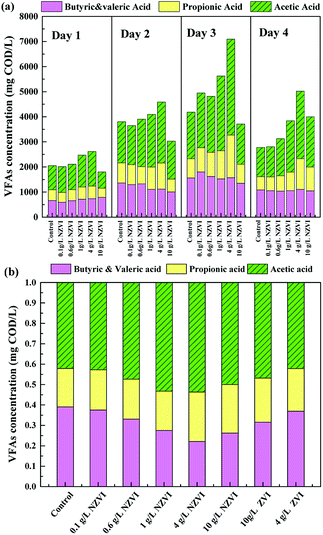
The acidification efficiency during a 4 day hydrolysis–acidification test at different NZVI/ZVI additions was assessed by evaluating VFA production characteristics, including accumulation (Fig. 1b) and composition (Fig. 2).Acetic acid was the dominant VFA product during the hydrolysis–acidification process, and its concentration increased with increasing NZVI addition from 0.1 to 4.0 g L−1, with nearly all values greater than those in the control (Fig. 2a). On day 3, the acetic acid concentrations peaked at 2182, 2236, 2981 and 3822 mg COD per L respectively with 0.1, 0.6, 1.0 and 4.0 g L−1 NZVI addition. In contrast, 10.0 g L−1 NZVI addition resulted in a proportion of acetic acid remarkably lower than that in the control during the initial 3 days of the experiment, but the level increased to 2000.0 mg COD per L on day 4 (Fig. 2a). The percentages of propionic acid, butyric acid and valeric acid changed slightly with NZVI addition (Fig. 2a). Previous studies have also demonstrated the positive influence of NZVI on acetate production. For example, when NZVI was added to the WAS anaerobic digestion systems, Yang et al.16 found addition of 1.68 g L−1 NZVI increased acetic acid dramatically on day 3; Yu et al.37 reported that the proportion of acetic acid was increased during a 3 day fermentation. However, the reason for this increment of acetate proportion on NZVI addition could not be determined in these studies.
As Fig. 2b shows, at the end of the test (day 4), the proportion of acetic acid increased to its maximum value of 53.7% at 4 g L−1 NZVI dosage, being approximately 1.3-times that in the control, and then decreased at 10.0 g L−1 dosage. On ZVI addition, acetic acid accounted for 46.8% and 42.2% of the total VFAs, respectively, when 10.0 and 4.0 g L−1 ZVI were fed, being 12.8% and 21.4% lower, respectively, than that on 4.0 g L−1 NZVI addition (Fig. 2b). As enhanced acetate production would be thermodynamically favorable for methanogenesis, the improvement of VFA composition (i.e., high acetate acid percentage) by NZVI addition in this study could be beneficial for subsequent methanogenesis.
3.3. Protein and polysaccharides in EPS and liquid during hydrolysis–acidification at different NZVI/ZVI dosages
Protein and polysaccharides constitute the main organic matter in WAS and are important substrates for hydrolysis.13 As Fig. 3a shows, the concentration of extracellular protein, both in the liquid and EPS, varied as NZVI dosage increasing from 0.0 to 10.0 g L−1, and the maximum value of 1187.5 mg L−1 occurred at 4 g L−1 NZVI addition on day 3. Considering that the live/Dead ratio of WAS (Section 3.1) was also decreased after NZVI addition (Fig. 1a), it was postulated that cell membranes had been ruptured, leading to the release of intracellular protein.22 This finding is in accordance with the production of VFAs, which increased with increasing NZVI addition from 0.1 to 4.0 g L−1 (Fig. 1b). It seems that NZVI could effectively accelerate the hydrolysis–acidification of biomass through disruption of cell membranes.In contrast, ZVI addition did not affect the total extracellular protein content or the amount of protein in the EPS (Fig. 3b), suggesting that ZVI could not contribute to the disruption of cell walls or the degradation of EPS. Neither NZVI nor ZVI addition had an obvious influence on the total extracellular polysaccharide and EPS-polysaccharide contents (Fig. 3c and d), possibly because polysaccharides were efficiently degraded and absorbed by cells.
3.4. CH4 and H2 production during anaerobic digestion at different NZVI/ZVI dosages
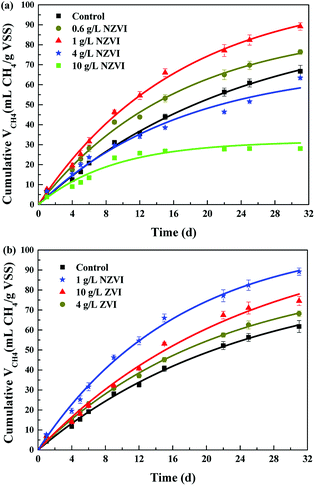
The cumulative CH4 production at different NZVI and ZVI dosages was examined during the 31 day anaerobic digestion process test (Fig. 4) to elucidate the effects of NZVI on the anaerobic digestion process.Various additions of NZVI had diverse effects on CH4 production (Fig. 4a). Sludge treated with 1 g L−1 NZVI produced the highest methane amount, final production 89.2 mL CH4 per g VSS, over 1.3 times that in the control. The lowest CH4 production, 28.1 mL CH4 per g VSS, occurred at 10.0 g L−1 NZVI dosage, being 57.9% less than that in the control. Addition of 0.6 or 1 g L−1 NZVI significantly promoted CH4 production, while 4.0 or 10.0 g L−1 NZVI substantially inhibited CH4 production (Fig. 4a). Such different effects of NZVI on CH4 production were also reported in previous studies. Carpenter et al.33 reported that 1 g L−1 NZVI and 1.25 g L−1 NZVI dramatically stimulated methanogenesis compared with controls [a 3.7-fold (on day 21) and 10.7% increase in methane production, respectively]. However, adding NZVI at a high dosage could inhibit methanogenesis,16,23 e.g., 69.0% reduction of methane production was observed on addition of 1.68 g L−1 NZVI to anaerobic sludge.16 Addition of 4 and 10 g L−1 ZVI increased CH4 production by 10.4% and 20.6% respectively, but the promoting effects were not as remarkable as that of 1.0 g L−1 NZVI (Fig. 4b).
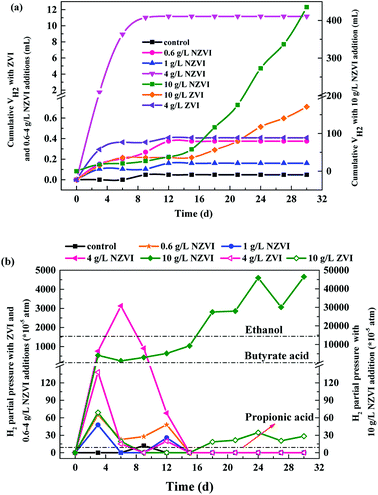
As to H2 production, both NZVI and ZVI, at each dose, could promote H2 production (Fig. 5a). The final volume of H2 was only 0.05 mL in the control. NZVI addition at 1.0 g L−1 had the smallest promoting effect with the final volume of H2 being only 0.16 mL. At 4.0 g L−1 NZVI addition, the final H2 volume increased sharply to 11.2 mL, 68.5 times greater than that on 1 g L−1 NZVI addition. It should be noted that when NZVI addition was 10 g L−1, the H2 production process was significantly increased after day 16 and reached 435.5 mL on day 31, being 38.0 times higher than that with 1.0 g L−1 NZVI addition. The fast and substantial accumulation of H2 at 4 and 10 g L−1 NZVI additions (Fig. 5a) explained the inhibition of methanogenesis and lower CH4 production at these two dosages (Fig. 4a).
3.5. Microbial population distribution during anaerobic digestion at different NZVI/ZVI dosages
Sludge samples were collected at the end of the hydrolysis–acidification test (day 4) and the whole anaerobic digestion process (day 31) for microbial community structure analysis using 16S rRNA high-throughput sequencing. The variations in hydrolysis–acidification and methanogenic archaea are detailed in ESI, Text S5.† In summary, NZVI addition stimulated proliferation of microorganisms responsible for hydrolysis–acidification, thus enhancing the hydrolysis and acidification processes in WAS.4. Discussion
4.1. Mechanism of the impact of NZVI on hydrolysis–acidification of WAS
NZVI is able to disrupt cell membranes.26 By adding NZVI, the initial solubilization and hydrolysis of particulate organics (in WAS) to soluble substances, which is the rate-limiting step of anaerobic digestion, can be accelerated. Indeed, exposing anaerobic sludge to 1.68 g L−1 NZVI led to a significant increase in SCOD in the mixed liquid slurry, which was an indication of cell disruption.16 Also, when Escherichia coli were exposed to NZVI, cell membrane disruption and leakage of the intracellular contents were observed; it was explained that NZVI addition caused the inactivation or enhanced a biocidal effect.27 Iron is a strong reductant  , and the reactive surfaces of NZVI directly interact with bacterial cells, and give rise to reductive decomposition of functional groups in proteins and lipopolysaccharides of the outer membranes, thus causing the disruption of the membranes.26
In the present study, NZVI addition facilitated the release of intracellular organic material to the liquid phase (Fig. 3), and improved further WAS solubility and VSS reduction (Fig. 1a). As a result, hydrolysis was accelerated and biodegradability was improved by the increase in dissolved organic matter, and, ultimately, VFA production was facilitated (Fig. 1b). As shown in Fig. 1c, the normalized VFA production on day 4 was greater than the control with NZVI additions from 0.1 to 10.0 g L−1.
4.2. The mechanism of NZVI effects on the complete anaerobic digestion process
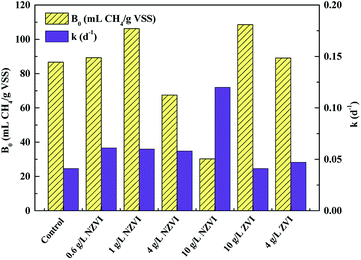 | ||
| Fig. 6 Variations in biochemical methane potential (B0) and apparent first order hydrolysis rate constant (k) of WAS with different NZVI (or ZVI) additions. | ||
Both improvement and inhibition effects of NZVI on B0 (at appropriate and excess dosages respectively) have been observed in previous studies. For instance, addition of 0.3–1.25 g L−1 NZVI led to a 10.7–60.5% increase in methane production.33 Similarly, Su et al.23 reported that NZVI dosages of 0.5 and 1.0 g L−1 increased methane production by 9.8% and 4.6% respectively; however, a NZVI dose of 2.0 g L−1 decreased the methane production by 8.8%. Yang et al.14 demonstrated that NZVI at ≥0.056 g L−1 inhibited methane generation, and 1.68 g L−1 NZVI caused a reduction of methane production of 69.0%. Clearly, the destruction of cell (including methanogens) integrity at high NZVI addition levels might contribute to inhibition of methanogenesis.
Unlike B0, the hydrolysis rate coefficient (k) continued to increase with increasing NZVI from 0.6 to 10.0 g L−1 (Fig. 6). This observation corresponded well with the finding that increasing NZVI addition from 0.6 to 10.0 g L−1 enhanced VFA production (Fig. 1b) due to cell disruption. Addition of NZVI from 0.6 to 4.0 g L−1 resulted in approximately the same value of k (approximately 0.06 d−1). k significantly increased, to 0.12 d−1, on addition of 10.0 g L−1 NZVI (Fig. 6). This finding confirmed that 10.0 g L−1 NZVI could rapidly cause damage to cell integrity, which corresponds to the live/dead ratio results showing that 10.0 g L−1 NZVI caused extensive death of microorganisms (Fig. 1a).
Addition of 4.0 and 10.0 g L−1 ZVI enhanced B0 but had little impact on k (Fig. 6). It was suggested that ZVI enhanced methane production by improving the BMP of WAS, rather than its hydrolysis rate. This might be because ZVI could improve VFA composition.15 In addition, the B0 values on 4.0 or 10.0 g L−1 ZVI addition were similar to those that on 0.6 or 1.0 g L−1 NZVI addition, indicating that although ZVI could improve the BMP, its efficiency was lower than that of NZVI: to achieve the same enhancement effect, the required dosage of ZVI was almost 9 times greater than that of NZVI.
Taken together, our findings demonstrate that NZVI addition could accelerate the WAS hydrolysis rate, but does not definitely improve the BMP. ZVI addition could also improve hydrolysis–acidification and the CH4 yield, but its efficiency was relatively low when compared with NZVI, and it could not induce cell wall rupture.
| Fe0 + 2H2O → Fe2+ + H2 + 2OH− | (3) |
| CH3CH2COO− + 3H2O → CH3COO− + HCO3− + H+ + 3H2 | (4) |
The limiting H2 pressures for production of methane from acetic acid, propionic acid and butyric acid are 0.144, 9 × 10⁻⁵ and 2 × 10⁻³ atm respectively. In this test, at 0.6 and 1.0 g L−1 NZVI, the partial pressure of H2 reached its maximum on day 3 and declined sharply on day 6 (Fig. 5b). On day 15, it decreased to 0 atm, and there was no H2 accumulation at the end of the test (day 31). However, after 4 or 10 g L−1 NZVI were added, the H2 partial pressure was higher than the limiting value for the VFAs for a long time. In particular, at 10 g L−1 NZVI the H2 partial pressure rose to 0.465 atm on day 31, indicating that the anaerobic digestion system lost self-adjustment capacity and had been destroyed. ZVI addition also increased H2 partial pressure, but the effect was not so obvious (Fig. 5b). From the microbial point of view, hydrogenotrophic methanogens and bacteria such as homoacetogens would compete for available H2 in anoxic environments, and the capacity of the methanogens to compete with homoacetogens for H2 decreases with increasing H2 concentration.35 Therefore, an appropriate increase of H2 production contributes to the enhancement of methanogenesis because H2 can be used by hydrogen-trophic methanogens, but excess H2 accumulation inhibits methanogenesis, leading to decreased CH4 production (Fig. 4a).
Additionally, our results illustrate that adding 0.1 to 4.0 g L−1 NZVI promoted VFA production (Fig. 1b), and CH4 production increased with increasing NZVI dosage only from 0.6 to 1.0 g L−1 (Fig. 4a), indicating that the optimal dosage of NZVI enhancing acidification and methanogenesis were not matched in this one-phase anaerobic digestion system, although generally the more fatty acids formed, the more CH4 is produced.16 It seems that NZVI addition had an independent influence on methanogenesis, which might be due to the inhibition of methanogenesis at high partial pressure of H2 at the higher NZVI dosages.
4.3. The correlation of relative abundance of bacteria involved in WAS hydrolysis–acidification and methanogens with different NZVI dosages
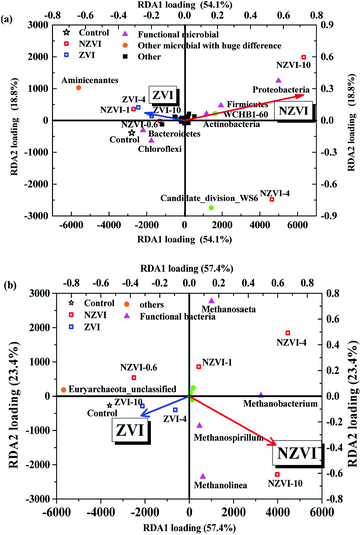
Redundancy analysis (RDA) of the bacterial community structure at the phylum level following different NZVI and ZVI additions is shown in Fig. 7a. Functional bacteria involved in WAS hydrolysis–acidification were positively correlated with the NZVI concentration, while non-functional bacteria were negatively correlated (Fig. 7a), indicating that NZVI is beneficial to the growth of functional bacteria. Specifically, Bacteroidetes, associated with propionic fermentation-type microorganisms,36 were among the most abundant bacteria in the cultures, were negatively correlated with NZVI dosages (Fig. 7a), indicating that propionic acid-type fermentation was inhibited by NZVI addition. The relative abundance of Clostridia increased with NZVI addition (Table S1†); the main functional bacteria of butyric acid fermentation are affiliated to Clostridia, which mainly produce acetic and butyric acids when degrading organic matter.37 Accordingly, butyric acid fermentation was promoted by the action of NZVI (Fig. 2a), and the VFA composition was optimized.In the anaerobic digestion of wastewater or WAS, the orders Methanobacteriales, Methanomicrobiales and Methanosarcinales contain the main methane-producing bacteria,38 among which only Methanosarcinales are aceticlastic methanogens.39 RDA analysis performed between methanogens at the genus level after different NZVI and ZVI additions showed that NZVI had much greater impacts on the microbial distribution than ZVI (Fig. 7b).
The relative abundances of the genera Methanobacterium, Methanospirillum and Methanolinea were positively correlated with the NZVI concentration (Fig. 7b), suggesting that NZVI addition was beneficial for these methanogens (Table S4†). Although Methanosaeta increased with increasing NZVI addition, it was not the dominant genus, shown by the obtuse angle between the triangle representing Methanosaeta and the red arrow in Fig. 7b. Therefore, we postulate that NZVI addition was more beneficial to hydrogenotrophic methanogens than to aceticlastic methanogens. Indeed, Hu et al.9 also found that in an anaerobic system with CO2 as the sole carbon source, heterotrophic methanogens gradually decreased while hydrogenotrophic methanogens dominated as the NZVI concentration was increased, indicating that NZVI could promote the growth of hydrogenotrophic methanogens.
Anaerobic digestion is a promising technology to recover renewable resources and achieve “carbon neutral” or even “carbon positive” WWTPs. However, the relatively low efficiency of hydrolysis and methanogenesis limits its application, and most current pretreatments have low cost-efficiency. In this study, we showed that addition of NZVI at a proper dosage could effectively enhance anaerobic digestion of WAS. Therefore, it can serve as a highly efficient method for promoting anaerobic digestion and has a great potential to be applied in WWTPs for energy recovery.
5. Conclusions
NZVI addition from 0.1 to 4.0 g L−1 could effectively enhance hydrolysis–acidification through disruption of cell membranes. The optimal dosage of NZVI was 4.0 g L−1, at which VFA and acetic acid accumulation were greatly increased. Addition of 0.6 and 1.0 g L−1 NZVI could effectively promote CH4 production through disruption of cell membranes, and the optimal dosage of NZVI for cumulative methane volume was 1.0 g L−1. While NZVI addition at 4.0 and 10.0 g L−1 caused inhibition of methanogenesis due to substantial H2 accumulation. ZVI could also improve hydrolysis–acidification and the CH4 yield, but its efficiency was relatively low compared with NZVI.Conflicts of interest
There are no conflicts to declare.Acknowledgements
This work was supported by the National Natural Science Foundation of China (NSFC) (51778446 and 51522809). The Foundation of the State Key Laboratory of Pollution Control and Resource Reuse (Tongji University, China) (PCRRY 0400231010) is also acknowledged.References
- P. Jenicek, J. Bartacek, J. Kutil, J. Zabranska and M. Dohanyos, Water Sci. Technol., 2012, 66, 1277–1281 CrossRef PubMed.
- C. Zamalloa, E. Vulsteke, J. Albrecht and W. Verstraete, Bioresour. Technol., 2011, 102, 1149–1158 CrossRef PubMed.
- W. Wei, X. Zhou, D. Wang, J. Sun and Q. Wang, Water Res., 2017, 118, 12–19 CrossRef PubMed.
- Y. Cao and A. Pawłowski, Renewable Sustainable Energy Rev., 2012, 16, 1657–1665 CrossRef.
- M. Imbierowicz and A. Chacuk, Water Res., 2012, 46, 5747–5755 CrossRef PubMed.
- J. Zhao, D. Wang, X. Li, Q. Yang, H. Chen, Y. Zhong and G. Zeng, Water Res., 2015, 78, 111–120 CrossRef PubMed.
- Q. Xu, X. Li, R. Ding, D. Wang, Y. Liu, Q. Wang, J. Zhao, F. Chen, G. Zeng, Q. Yang and H. Li, Water Res., 2017, 124, 269–279 CrossRef PubMed.
- J. A. Muller, Water Sci. Technol., 2001, 44, 121–128 CrossRef PubMed.
- U. Kepp, I. Machenbach, N. Weisz and O. E. Solheim, Water Sci. Technol., 2000, 42, 89–96 CrossRef.
- S. Gössling, Journal of Sustainable Tourism, 2009, 17, 17–37 CrossRef.
- Y. Hu, X. Hao, D. Zhao and K. Fu, Chemosphere, 2015, 140, 34–39 CrossRef PubMed.
- S. Karri, R. Sierra-Alvarez and J. A. Field, Biotechnol. Bioeng., 2005, 92, 810–819 CrossRef PubMed.
- J. Luo, L. Feng, Y. Chen, X. Li, H. Chen, N. Xiao and D. Wang, J. Biotechnol., 2014, 187, 98–105 CrossRef PubMed.
- L. Su, X. Shi, G. Guo, A. Zhao and Y. Zhao, J. Mater. Cycles Waste Manage., 2013, 15, 461–468 CrossRef.
- Y. Feng, Y. Zhang, X. Quan and S. Chen, Water Res., 2014, 52, 242–250 CrossRef PubMed.
- Y. Yang, J. Guo and Z. Hu, Water Res., 2013, 47, 6790–6800 CrossRef PubMed.
- S.-f. Yang and X.-y. Li, Process Biochem., 2009, 44, 91–96 CrossRef.
- P. D. Jensen, H. Ge and D. J. Batstone, Water Sci. Technol., 2011, 64, 880 CrossRef PubMed.
- D. Batstone, S. Tait and D. Starrenburg, Biotechnol. Bioeng., 2009, 102, 1513–1520 CrossRef PubMed.
- M. A. Latif, C. M. Mehta and D. J. Batstone, Water Res., 2015, 81, 288–293 CrossRef PubMed.
- G. Zhen, X. Lu, Y.-Y. Li, Y. Liu and Y. Zhao, Chem. Eng. J., 2015, 263, 461–470 CrossRef.
- J. Jimenez, F. Vedrenne, C. Denis, A. Mottet, S. Déléris, J.-P. Steyer and J. A. C. Rivero, Water Res., 2013, 47, 1751–1762 CrossRef PubMed.
- L. Su, G. Zhen, L. Zhang, Y. Zhao, D. Niu and X. Chai, Environ. Sci.: Processes Impacts, 2015, 17, 2013–2021 RSC.
- S. Inoue, S. Sawayama, T. Ogi and S. Y. Yokoyama, Biomass Bioenergy, 1996, 10, 37–40 CrossRef.
- D. C. Devlin, S. R. Esteves, R. M. Dinsdale and A. J. Guwy, Bioresour. Technol., 2011, 102, 4076–4082 CrossRef PubMed.
- J. Y. Kim, C. Lee, D. C. Love, D. L. Sedlak, J. Yoon and K. L. Nelson, Environ. Sci. Technol., 2011, 45, 6978–6984 CrossRef PubMed.
- J. Y. Kim, H.-J. Park, C. Lee, K. L. Nelson, D. L. Sedlak and J. Yoon, Appl. Environ. Microbiol., 2010, 76, 7668–7670 CrossRef PubMed.
- M. Tatara, T. Makiuchi, Y. Ueno, M. Goto and K. Sode, Bioresour. Technol., 2008, 99, 4786–4795 CrossRef PubMed.
- N. Ren, H. Chua, S. Chan, Y. Tsang, Y. Wang and N. Sin, Bioresour. Technol., 2007, 98, 1774–1780 CrossRef PubMed.
- R.-F. Yu, H.-W. Chen, W.-P. Cheng, Y.-J. Lin and C.-L. Huang, J. Taiwan Inst. Chem. Eng., 2014, 45, 947–954 CrossRef.
- L. Daniels, N. Belay, B. S. Rajagopal and P. J. Weimer, Science, 1987, 237, 509–511 CrossRef PubMed.
- A. F. Yakunin and P. C. Hallenbeck, Biochim. Biophys. Acta, Bioenerg., 1998, 1409, 39–49 CrossRef.
- A. W. Carpenter, S. N. Laughton and M. R. Wiesner, Environ. Eng. Sci., 2015, 32, 647–655 CrossRef PubMed.
- Y.-X. Huang, J. Guo, C. Zhang and Z. Hu, Water Res., 2016, 88, 475–480 CrossRef PubMed.
- O. R. Kotsyurbenko, M. V. Glagolev, A. N. Nozhevnikova and R. Conrad, FEMS Microbiol. Ecol., 2001, 38, 153–159 CrossRef.
- H.-Q. Tan, T.-T. Li, C. Zhu, X.-Q. Zhang, M. Wu and X.-F. Zhu, Int. J. Syst. Evol. Microbiol., 2012, 62, 2613–2617 CrossRef PubMed.
- B. Yu, X. Huang, D. Zhang, Z. Lou, H. Yuan and N. Zhu, RSC Adv., 2016, 6, 24236–24244 RSC.
- D. Boone, R. Castenholz and G. Garrity, Bergey's manual of systematic bacteriology, Springer, New York, 2001, vol. 1 Search PubMed.
- S. Beckmann, T. Lueders, M. Krueger, F. von Netzer, B. Engelen and H. Cypionka, Appl. Environ. Microbiol., 2011, 77, 3749–3756 CrossRef PubMed.
Footnote |
| † Electronic supplementary information (ESI) available. See DOI: 10.1039/c8ra05369c |
| This journal is © The Royal Society of Chemistry 2018 |

