
 Open Access Article
 This Open Access Article is licensed under a Creative Commons Attribution-Non Commercial 3.0 Unported Licence
Exploring the interaction between Salvia miltiorrhiza and α-glucosidase: insights from computational analysis and experimental studies†
Hongjin Tang *a,
Dongsheng Zhaob and
Zhenglian Xuea
*a,
Dongsheng Zhaob and
Zhenglian Xuea
aCollege of Biological and Chemical Engineering, Anhui Polytechnic University, Wuhu 241000, P. R. China. E-mail: tanghongjin@126.com
bState Key Laboratory of Natural Medicines, China Pharmaceutical University, Nanjing 210009, P. R. China
First published on 9th July 2018
Abstract
α-Glucosidase has emerged as an important target for type 2 diabetes mellitus. Salvia miltiorrhiza is a widely used traditional Chinese medicine. The interaction between the chemicals of S. miltiorrhiza and α-glucosidase are still not clear, and need to be deeply investigated. Herein, an integrated approach consisting of computational analysis and experimental studies was employed to illustrate the interactions between S. miltiorrhiza and α-glucosidase. Molecular docking simulations were performed to reveal the proposed binding characteristics of the chemicals identified in S. miltiorrhiza on the basis of the total docking scores and key molecular determinants for binding. The affinities of 13 representative compounds from the medicinal herb to α-glucosidase were predicted and then confirmed by enzyme inhibitory assay in vitro. The obtained results suggested that two compounds including salvianolic acid C and salvianolic acid A in S. miltiorrhiza showed potent α-glucosidase inhibitory activity with IC50 values of 4.31 and 19.29 μM, respectively. The active inhibitor, salvianolic acid C, exerted a mixed-competitive inhibition mode when binding to α-glucosidase. Such findings could be helpful to efficiently discover bioactive molecules from complex natural products, which suggests the usefulness of the integrated approach for this scenario.
1. Introduction
Diabetes mellitus is a multifarious metabolic disorder characterized by hyperglycemia, an abnormal postprandial increase of blood glucose.1 In particular, many severe complications occur with type 2 diabetes, such as uremia, neuropathy, kidney failure and cardiovascular diseases.2,3 In recent years, several effective approaches have been developed for the clinical treatment of various types of diabetes mellitus. One of the main therapeutic strategies is to decrease the postprandial glucose levels through inhibition of α-glucosidase.4 α-Glucosidase, a membrane-bound enzyme, is mainly distributed in the epithelium of the small intestine and helps to catalyze the reactions associated with carbohydrate digestion.5 α-Glucosidase plays an important role in converting disaccharides and oligosaccharides into glucose. The resulting monosaccharides are absorbed into bloodstream, which leads to a distinct increase of blood sugar levels.6,7 Currently, α-glucosidase has been emerged as a potential target enzyme for the treatment of type 2 diabetes. α-Glucosidase inhibitors play a key role in controlling the disease by delaying carbohydrate digestion and monosaccharides absorption after a meal.8,9 The discovery of novel α-glucosidase inhibitors has attracted extensive attentions of medicinal chemists, and many studies have been performed to develop novel α-glucosidase inhibitors with potential use.10 In clinical practice, several known α-glucosidase inhibitors, including miglitol, voglibose, acarbose and 1-deoxynojirimycin (DNJ) (Fig. 1), are widely used to treat type 2 diabetes by suppressing the hyperglycemia. However, in some cases, severe side effects ensue such as diarrhea, abdomen pain, flatulence and skin problems.11,12 Therefore, there is an urgent need to discover better α-glucosidase inhibitors having fewer adverse effects for the treatment of α-glucosidase-related diseases.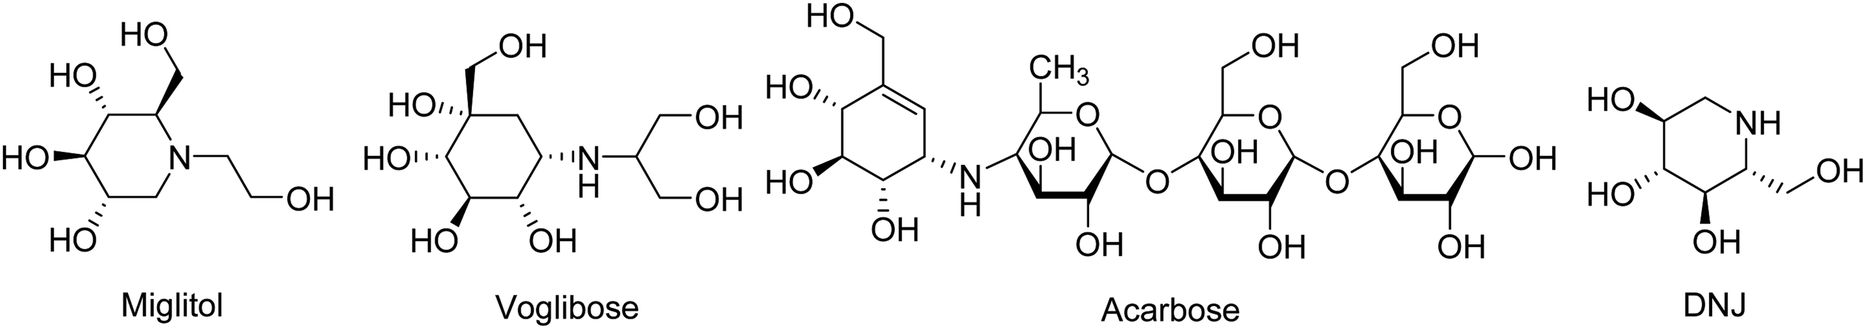 | ||
| Fig. 1 The chemical structures of the known α-glucosidase inhibitors. | ||
Natural products have been always the most important and productive sources of lead compounds for the development of drugs.13–15 Many potent α-glucosidase inhibitors have been discovered from natural products, such as quercetin, resveratrol and curcumin.16,17 Salvia miltiorrhiza, known as Danshen in China, has mainly been used to treat cardiovascular diseases for hundreds of years.18,19 The chemicals of S. miltiorrhiza could be divided into two major classes, including the lipid-soluble and the water-soluble ingredients. The former mainly refers to hydrophobic diterpenoids as tanshinones, and the latter represents a hydrophilic and polyphenolic combination of components as salvianolic acids.20 Both present a variety of biological activities, such as anti-platelet aggregation,21 antioxidant22 and antitumor.23 Some advances have been achieved on the chemical components of S. miltiorrhiza. For example, Gao et al. reported that the well-known anti-diabetic formula TZQ-F containing Danshen root (total polyphenols fraction) possessed the blood glucose lowering effects, possibly by inhibiting intestinal α-glucosidase.24 Ma et al. reported several natural products isolated from S. miltiorrhiza with α-glucosidase inhibitory activity.25 However, studies on the interactions between S. miltiorrhiza components and α-glucosidase have thus far been inadequate. And the relationship of them is still not clear. Hence, most chemicals, including salvianolic acids and tanshinones still require further investigation of the interaction mechanisms when binding to α-glucosidase to discover the potential α-glucosidase inhibitors from S. miltiorrhiza.
Computational methods, relying on theoretical calculation, have accelerated the discovery of drug leads due to some advantages, such as time and cost efficiency, high-throughput screening and providing useful information to guide drug design.26,27 Molecular docking is an important technique to investigate the protein–drug system, which has been integrated with in vitro and in vivo experiments to explore the interaction mechanisms of ligands binding to target.28,29
In this study, a comprehensive list of small-molecule compounds found in S. miltiorrhiza was extracted from the literature30 and used to explore the binding affinities of the compounds to α-glucosidase by molecular docking simulations. Subsequently, a small amount of available ingredients, including 2 active and 11 inactive compounds from computational analysis, were determined by α-glucosidase inhibitory activity assay in vitro to validate their potential interactions when binding to α-glucosidase.
2. Materials and methods
2.1 Chemicals and reagents
A small amount of the reference standards including lithospermic acid (LA), salvianolic acid B (SAB), tanshinone IIA (TS-IIA), cryptotanshinone (CTS), rosmarinic acid (RA), salvianolic acid C (SAC), caffeic acid (CA), tanshinone IIB (TS-IIB), salvianolic acid A (SAA), isoferulic acid (IA), miltirone (MT), protocatechuic aldehyde (PAH), ursolic acid (UA) and quercetin were obtained from the National Institute for the Control of Pharmaceutical and Biological Products (Beijing, China) (purity > 98%). α-Glucosidase (isolated from Saccharomyces cerevisiae, EC 3.2.1.20), 4-nitrophenyl-α-D-glucopyranoside (4-NPGP) and acarbose were purchased from Sigma-Aldrich Chemical Co. (St. Louis Missouri, USA).2.2 Molecular docking simulations
Molecular modelling is widely used to illustrate the potential interaction modes of the active inhibitors binding to the protein target. In this work, molecular docking simulations were conducted by the Surflex-dock module of SYBYL X-2.0 (Tripos, L.P.). The X-ray co-crystal structure of α-glucosidase-α-D-glucose complex from Saccharomyces cerevisiae (PDB code: 3 A4A, resolution of 1.6 Å) was retrieved from RCSB protein database bank and applied to the following study. In the docking experiment, the original ligand (α-D-glucose) was firstly extracted from the active site of α-glucosidase, and then re-docked into the binding pocket of the protein to evaluate the docking reliability of generated Surflex-dock protocol.The docking process was conducted according to the following steps. Firstly, the 3D structures of all the selected compounds were drawn by Chem3D Pro 14.0 (PerkinElmer, Inc.). The standard Tripos force field was used to minimize the energy of all compounds with an energy gradient convergence criterion of 0.005 kcal mol−1. The max iteration was selected as 10![[thin space (1/6-em)]](https://www.rsc.org/images/entities/char_2009.gif) 000 for the energy minimization, and the Gasteiger–HÜckel method was applied to calculate partial atomic charges. The prepared ligands were used as the input files for the docking study. Secondly, the protein was prepared by repairing the missing and terminal residues of polypeptide chains, deleting waters and adding hydrogen atoms. The energy minimization of the protein was performed based on MMFF94s force field. The energy gradient convergence criterion and the max iteration were set as 0.05 kcal mol−1 and 100, respectively. The prepared protein was used as the receptor for the docking experiment. The other parameters were set as default.
000 for the energy minimization, and the Gasteiger–HÜckel method was applied to calculate partial atomic charges. The prepared ligands were used as the input files for the docking study. Secondly, the protein was prepared by repairing the missing and terminal residues of polypeptide chains, deleting waters and adding hydrogen atoms. The energy minimization of the protein was performed based on MMFF94s force field. The energy gradient convergence criterion and the max iteration were set as 0.05 kcal mol−1 and 100, respectively. The prepared protein was used as the receptor for the docking experiment. The other parameters were set as default.
Based on the prepared ligands and protein, the interaction modes of the small molecules binding to the active pocket of α-glucosidase were predicted. On the basis of the structures of α-glucosidase, all the minimized compounds were manually docked into the active site with the created protomol derived from the co-crystallized ligand to generate the proposal binding pose of ligands in S. cerevisiae α-glucosidase, respectively. In the Surflex-Dock assay, general parameters including additional starting conformations per molecule, angstroms to expand search grid, max conformations per fragment and max number of rotatable bonds per molecule were set as 0, 6, 20 and 100, respectively. Soft grid treatment and activating spin alignment method were performed. Density of search and number of spins per alignment were set as 3.00 and 12, respectively. Additionally, the co-crystallized ligand α-D-glucose was set as the reference molecule during the docking simulations. The Surflex-Dock scoring function is a weighted sum of non-linear functions involving van der Waals surface distances between the appropriate pairs of exposed protein and ligand atoms. It includes the following items: hydrophobic, polar, entropic, repulsive, solvation and crash. Surflex-Dock scores are expressed in −log10(Kd) units to represent binding affinities between the docking ligand and the receptor.31 The ligand–receptor complex with the highest total score was considered as the most stable binding conformation, which was selected to further explore the possible binding mechanisms relying on several key factors, such as hydrogen bonds, hydrophobic interactions, pi–pi stacking and root mean-square deviation (RMSD) values by SYBYL applications.
2.3 Preparation of stock solutions
Appropriate amounts of α-glucosidase and 4-NPGP (the substrate) were dissolved in 75 mM phosphate buffer solution (PB, pH 7.4) to prepare 10 U mL−1 and 20 mM of stock solutions, respectively. All the available compounds including TS-IIA, CA, CTS, TS-IIB, MT, LA, SAC, RA, SAA, IA, SAB, PAH, UA, quercetin and acarbose were prepared at 100 mM of stock solutions dissolving in DMSO, which were diluted to the required concentrations for the inhibition evaluation of α-glucosidase.2.4 Inhibition assay of α-glucosidase activity
The α-glucosidase inhibitory assay was performed relying on the developed method. PB (75 mM, pH 7.4), α-glucosidase and 4-NPGP stock solutions were prepared and stored on an ice-bath. The test compounds were diluted to the required concentrations with PB. In this assay, the blank control was prepared without the test compounds to determine the quantity of 4-nitrophenol released from 4-NPGP. Quercetin and acarbose were used as the positive control. Each concentration was set in 3 replicates. Briefly, the reaction mixture, comprising 100 μL of the test compound at various concentrations (0–200 μM), was equilibrated with 50 μL of 0.1 U mL−1 α-glucosidase in 96-well microplates. Following incubation at 37 °C for 10 min, 50 μL of 1 mM 4-NPGP solution was added to initiate the enzyme reaction. Then, the plate was incubated at 37 °C for another 30 min. The absorbance was monitored by a microplate spectrophotometer (Thermo Fisher Scientific, Inc., USA) at 405 nm. Percent α-glucosidase inhibition was calculated as follows:| Inhibition rate (%) = [(C30 − C0) − (S30 − S0)]/(C30 − C0) × 100 | (1) |
2.5 Kinetics involved in the inhibition of α-glucosidase
Steady-state kinetic analysis was performed to determine the inhibition mode of the active inhibitors SAC and SAA. Lineweaver–Burk plots were measured using the increasing concentration of the substrate 4-NPGP (50–200 μM) in the absence or presence of various concentrations of SAC and SAA. The samples were premixed with α-glucosidase solution (the final concentration of 0.025 U mL−1) at 37 °C for 10 min. Then, the substrate was added to initiate the reaction. The absorbance was spectrophotometrically monitored by measuring the quantity of 4-nitrophenol every 30 s for 10 min at 405 nm. The Lineweaver–Burk plots were depicted based on the obtained data by MS Excel 2013. Meanwhile, the secondary plot analysis of Lineweaver–Burk plots was used to determine the competitive inhibition constant (Ki) and uncompetitive inhibition constant Ki represents the equilibrium constant of the inhibitor binding to α-glucosidase, whereas
  refers to the equilibrium constant for the binding between the compound and the 4-NPGP-α-glucosidase complex. The initial velocity was expressed as the absorbance rate per min (ΔA per min) at 405 nm.
3. Results and discussion
3.1 Molecular docking studies
Owing to the excellent clinical efficacy of S. miltiorrhiza, intensive research on the chemical characterization of the herb has been carried out. More than 100 compounds have been isolated and identified from this traditional herb (see ESI Table A1† for the complete list of the compounds used in this study). Molecular docking studies are widely used to explore the proposed binding mechanism between bioactive small molecule and protein. Saccharomyces cerevisiae contains two α-glucosidases, namely, α-1,4-glucosidase (maltase) and oligo-1,6-glucosidase (isomaltase). Both are classified as a member of the retaining glycoside hydrolase (GH) family 13, also called the α-amylase family. They are composed of three domains, namely, A, B and C.32 The crystal structure of isomaltase (PDB ID: 3 A4A) from baker's yeast was chosen to perform the docking simulations since it shared 71% identity and 84% similarity with Saccharomyces cerevisiae α-glucosidase. In this study, the crystal structure of α-glucosidase coupled with the original ligand was firstly re-docked. A group of known α-glucosidase inhibitors binding to the receptor was then established as a calibration set for the docking analysis.As shown in Fig. S1 (ESI†), the original ligand α-D-glucose was re-docked into α-glucosidase, which yielded a root mean square deviation (RMSD) of 0.624 Å. It can be recognized that the re-docking conformation and the original ligand of the crystal structure are almost completely superimposed together and their rotational tendencies are basically similar. Several key amino acid residues, such as Asp69, Tyr72, His112, Phe159, Gln182, Asp215, Val216, Glu277, Gln279, His351, Asp352, Glu411 and Arg442 interact with the inhibitor. The residues Gln182, Asp215, Gln279, His351, Asp352 and Arg442 interact with the ligand by generating 7 hydrogen bonds. Moreover, each reported inhibitor in the calibration set was manually docked into the active pocket of α-glucosidase. The detailed docking results were summarized in Table 1. The docking results suggested that the interaction with the active pocket constructed by the residues Asp69, Tyr72, His112, Phe159, Gln182, Val216, Glu277, Gln279, His351, Asp352, Glu411 and Arg442 seemed to contribute affinity to α-glucosidase. The docking model created to visualize this interaction and validated their conclusions. All obtained results suggest that the rationality of the program and the docking results are reliable. The total score value of 6.50 was thus taken as a relative filtering criteria in selecting bioactive compounds of α-glucosidase for further in vitro experimental validation. Meanwhile, the physiochemical property and the relative content of the compound identified in S. miltiorrhiza were also considered when conducing the selection.
| Known inhibitor | Structure | Total score | Interactions | IC50 (μM) | |
|---|---|---|---|---|---|
| H-bonds | Key residues | ||||
| Voglibose | 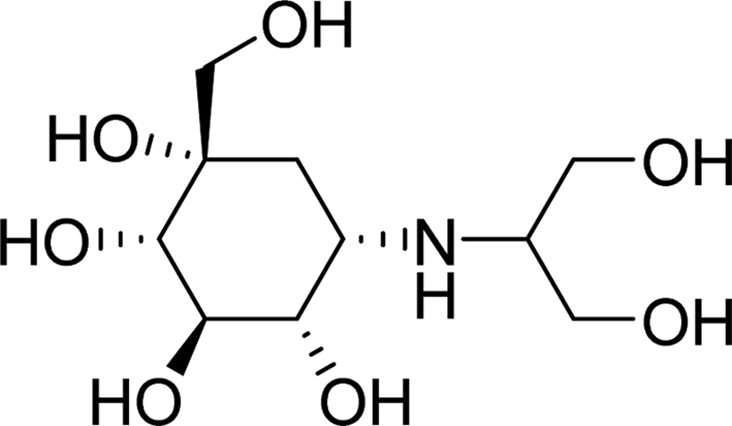 |
9.2304 | Asp69, His112, Gln182, Glu277, Gln279, His351, Asp352, Glu411, Arg442 | Asp69, Tyr72, His112, Phe159, Gln182, Val216, Glu277, Gln279, His351, Asp352, Glu411, Arg442 | 0.25 |
| Miglitol |  |
8.9406 | Asp69, Gln182, Asp215, Glu277, His351, Asp352, Arg442 | Asp69, Tyr72, Phe159, Gln182, Asp215, Val216, Glu277, His351, Asp352, Arg442 | 2.43 |
| DNJ | 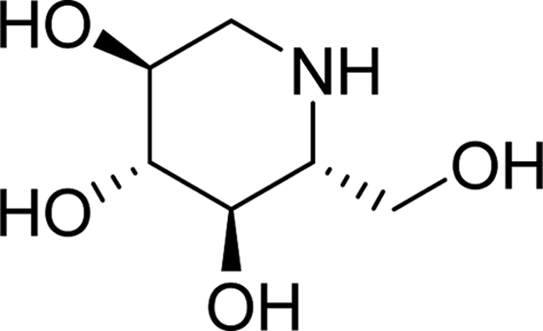 |
7.0843 | Asp69, Glu277, His351, Asp352, Arg442 | Asp69, Tyr72, Phe159, Gln182, Arg213, Val216, Glu277, His351, Asp352, Arg442 | 1.8 |
| Curcumin | 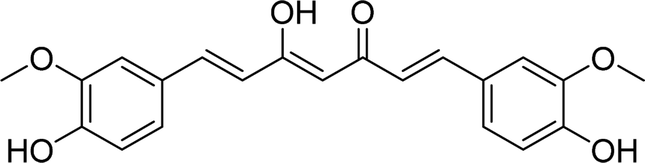 |
7.0368 | Asp215, Thr306, Asn350, Glu411 | Asp69, Tyr72, His112, Phe159, Asp215, Phe303, Thr306, Asn350, Gln353, Glu411, Arg442 | 9.08 |
| Quercetin |  |
6.9021 | Asp215, Gln279, His280, Asp352, Arg442 | Tyr72, Phe178, Asp215, Val216, Gln279, His280, Phe303, Asp352, Arg442 | 6.6 |
| Resveratrol | 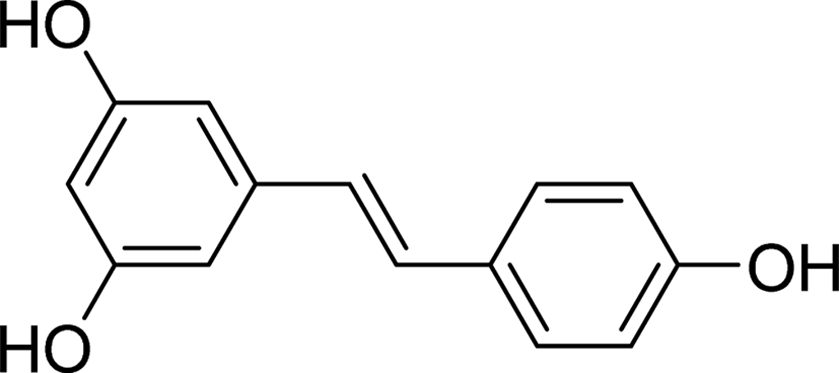 |
6.5283 | His112, Gln182, Gln353, Glu411 | Tyr72, His112, Phe178, Gln182, Val216, Glu277, Phe303, Gln353, Glu411, Arg442 | 31.1 |
| Acarbose |  |
5.9797 | Asp69, His112, Gln182, Glu277, Thr306, His351, Asp352, Gln353, Glu411, Arg442 | Asp69, Tyr72, His112, Tyr158, Phe159, Phe178, Gln182, Val216, Glu277, Phe303, Thr306, His351, Asp352, Gln353, Glu411, Arg442 | 360.2 |
To predict possible ingredients in S. miltiorrhiza with high binding affinity to the active site of α-glucosidase, the docking simulations of the interaction were conducted between all selected compounds and α-glucosidase (the complete list of docking results for all selected compounds is shown in the ESI Table A1†). As shown in Table 2, the docking scores and interaction profiles of the 13 selected compounds including 9 salvianolic acids and 4 lipid-soluble components were presented. Most drug preparations of S. miltiorrhiza were carried out by water extraction process. Thus, these hydrophilic phenolic acids were considered as predominant species inside, and more compounds of this group were chosen for further analysis. Several compounds, such as SAB and UA, were predicted computationally as inactive compounds for the active pocket of α-glucosidase; however, these compounds were purposely included in the experimental validation to verify the reliability of docking analysis.
| Compound | Structure | Total score | Interactions | |
|---|---|---|---|---|
| H-bonds | Key residues | |||
| SAA | 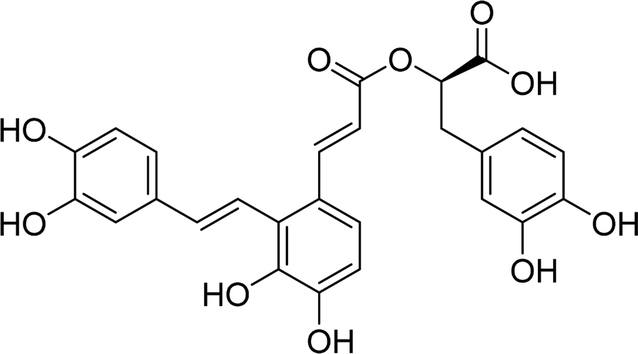 |
8.0625 | Asp215, Glu277, Gln279, Thr306, Gln353, Glu411 | Tyr72, Tyr158, Phe178, Asp215, Val216, Glu277, Gln279, Phe301, Phe303, Thr306, Asn350, His351, Asp352, Gln353, Glu411, Arg442 |
| SAC |  |
7.781 | Asp215, Glu277, Gln279, Asp307, Asn350 | His112, Tyr158, Phe159, Phe178, Asp215, Val216, Glu277, Gln279, His280, Phe303, Asp307, Tyr316, Asn350, Arg442 |
| LA |  |
7.4909 | Arg213, Asp215, Asp352, Gln353, Glu411, Arg442 | Tyr72, Phe178, Arg213, Asp215, Phe301, Phe303, Asn350, Asp352, Gln353, Glu411, Arg442 |
| TS-IIB | 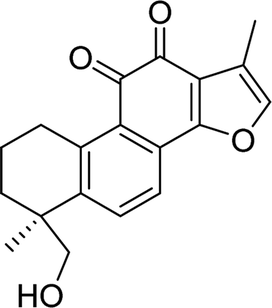 |
6.4413 | Arg213, Asp215 | Phe159, Phe178, Arg213, Asp215, Val216, Glu277, Gln279, Phe303, Asn350, His351, Asp352, Arg442 |
| RA |  |
5.6697 | Asp215, Gln279, His351, Asp352, Gln353 | Tyr72, Phe159, Phe178, Asp215, Val216, Glu277, Gln279, Phe303, His351, Asp352, Gln353, Arg442 |
| CA |  |
4.8035 | Asp215, Asn350 | Tyr72, Phe178, Arg213, Asp215, Val216, Glu277, Asn350, Asp352, Arg442 |
| IA | 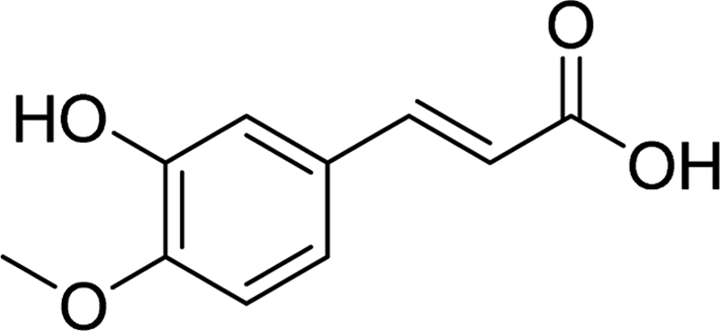 |
4.8188 | Gln182, Asp352 | Phe159, Phe178, Gln182, Val216, Glu277, Phe303, Asp352, Arg442 |
| PAH | 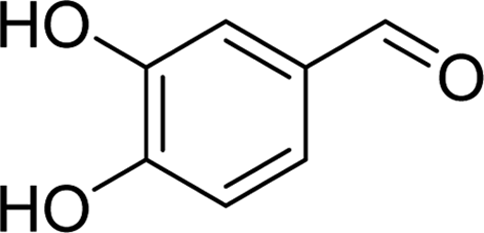 |
4.1276 | Asp215, Arg442 | Tyr72, Phe159, Phe178, Asp215, Val216, Glu277, Asp352, Arg442 |
| MT |  |
3.7842 | — | Tyr72, Phe159, Phe178, Val216, Glu277, Phe303, Asp352, Arg442 |
| SAB |  |
−2.7032 | Asp69, Ser157, Thr306, Arg442 | Tyr72, Trp58, Asp69, Ser157, Tyr158, His280, Phe303, Thr306, His351, Arg442 |
| UA |  |
−5.6972 | — | Tyr72, Tyr158, Phe159, Asp215, Val216, Glu277, Gln279, Arg442 |
According to the docking results, two active compounds including SAC, SAA and one inactive compound UA were selected to illustrate the potential interaction mechanisms when binding to α-glucosidase. As shown in Fig. 2, the docking conformations of SAC, SAA and UA, and the interactions with key residues surrounding the active pocket of α-glucosidase were presented. The docking results suggested that compounds SAA and SAC bound into the similar position of α-glucosidase, in which the key residues Tyr72, Tyr158, Phe159, Gln182, Asp215, Val216, Glu277, Gln279, Phe303, Asn350, Asp352 and Arg442 constructed the binding pocket and interacted with the inhibitors (Fig. 2A and B). Meanwhile, a series of non-polar contacts with aromatic and aliphatic rings existed to stabilize the conformations of the ligand–receptor complex by analyzing the docking results. In addition, pi-stacking interactions (face-to-face with Phe303 and face-to-edge with Phe159, Phe178 and Phe301) were maintained by SAC and SAA. Other hydrophobic interactions were also observed with the residues, such as Tyr72, Phe159, Phe178, Val216, Phe301, Phe303, Asp352 and Arg442.
 | ||
| Fig. 2 Molecular docking results of compounds SAC (A), SAA (B) and UA (C) binding to α-glucosidase (PDB code: 3 A4A). View of superimposed docking conformations for the molecules binding to the active pocket of α-glucosidase (D). Key residues are shown as stick models, and hydrogen bonds are labeled as red dashed lines. Compounds SAC, SAA and UA are colored as red, blue and cyan, respectively. | ||
Three catalytic acidic residues are existed in the active site of α-glucosidase, which are Asp215, Glu277 and Asp352, respectively.32 Both binding models of compounds SAC and SAA presented that residues Asp215 and Glu277 were involved in the interactions between the inhibitors and enzyme. In a competitive inhibitor maltose binding model, eight key residues, such as Arg213, Asp215, Glu277 and Asp352 formed nine hydrogen bond interactions with maltose. In addition to the catalytic acidic residues, Asp69, His112, His351 and Arg442 were shown to interact with maltose.32 Herein, the hydrogen bonds were different for the two inhibitors. For SAC, the hydroxyl and carbonyl groups of the molecule formed seven hydrogen bonds with the residues Asp215, Glu277, Gln279, Asp307 and Asn350. For the compound SAA, six residues including Asp215, Glu277, Gln279, Thr306, Gln353 and Glu411 generated nine hydrogen bonds with the inhibitor.
However, as shown in Fig. 2C, it could not observe the non-polar contacts with aliphatic rings. And pi–pi interaction was not also maintained for compound UA due to the chemical structure. Moreover, there were no hydrogen bond generated for UA when binding to the protein. Importantly, it could be observed that the core scaffold of compounds SAC and SAA both stretched into the innermost hydrophobic region of the α-glucosidase active pocket, whereas the compound UA interacted with α-glucosidase in a distinct way and located near the pocket mouth region. Thus, comparing to compound SAC and SAA, the lack of important hydrophobic interactions and hydrogen bond may lead to the weak affinity binding to α-glucosidase, which are responsible for the relative low docking score and the conformation stability of the docking complex.
Surflex-Dock scores are expressed in −log10(Kd) units to represent binding affinities between the docking ligand and the receptor,31 which suggests that compound with more potent inhibitory activity possesses higher total score and stronger binding affinity against the receptor. According to the docking results, the total scores of compounds SAC, SAA and UA were 7.781, 8.0625 and −5.6972, respectively. The inhibitors SAC and SAA presented the relative high docking scores with better affinities towards α-glucosidase, which was ascribed to the strong hydrophobic interactions and created hydrogen bonds. On the contrary, compound UA showed the weak affinity binding to α-glucosidase without such interactions, which resulted in the low total score.
Therefore, according to the above results, it could be inferred that compounds SAC and SAA exhibited similar binding properties with α-glucosidase, and shared the same active pocket of the protein due to the approximate binding orientations and key residues surrounding the ligand–receptor complex. The aforementioned results also demonstrate that the key catalytic acidic residues (Asp215, Glu277 and Asp352), hydrophobic interactions and hydrogen bonds play an important role in maintaining the stability of docking conformation for the ligand binding to the protein. Moreover, other active phenolic acids in this herb exhibited similar binding characters as SAA and SAC in the active domain of α-glucosidase. This similarity suggests that a common interaction mode may be maintained by the series of hydrophilic compounds (data not shown).
3.2 Validation of α-glucosidase inhibitory activity in vitro
To validate the predictive results by molecular docking simulations, a small amount of available compounds were evaluated for their α-glucosidase inhibitory activities in vitro according to the developed procedures. For the accuracy and reliability of the experimental analysis, herein, the reported inhibitors quercetin and acarbose were selected as the positive control. The IC50 values, indicating the strength of α-glucosidase inhibition of the selected compounds were calculated and summarized in Table 3.| Compound | IC50a (μM) | Inhibition mode |
|---|---|---|
| a IC50 values represent as mean ± S.D. of three determinations.b N.D., not detected.c Reported IC50 = 6.6 μM.16 | ||
| SAC | 4.31 ± 0.42 | Mixed-competitive |
| SAA | 19.29 ± 0.89 | Competitive |
| RA | >200 | — |
| CA | >100 | — |
| LA | >100 | — |
| PAH | >100 | — |
| IA | >100 | — |
| SAB | >100 | — |
| TS-IIA | >100 | — |
| TS-IIB | >100 | — |
| CTS | >100 | — |
| MT | >100 | — |
| UA | >200 | — |
| Quercetin | 8.84 ± 0.57c | N.D.b |
| Acarbose | 820 ± 5.87 | N.D. |
As shown in Fig. 3, the two salvianolic acids SAC and SAA showed potent α-glucosidase inhibitory activity with IC50 values of 4.31 and 19.29 μM, respectively. These values were consistent with the relatively high total scores generated by the docking analysis. However, as shown in Table 3, for the other compounds such as IA, SAB, TS-IIB and UA, the inhibitory ratio of all applied concentrations almost remained constant even at the highest tested concentration (100 μM), suggesting that they presented a weak inhibitory activity against α-glucosidase. This result was in accordance with our docking prediction that they did not efficiently interact with α-glucosidase due to the relatively low affinity and docking total scores.
 | ||
| Fig. 3 Inhibitory effects of SAA, SAC, quercetin and acarbose on α-glucosidase. Each point indicates the average ± S.D. of triplicate measurements. | ||
According to the described results, among the 13 selected compounds in this study, the docking total score of SAC was not the highest one. However, SAC presented a strong affinity to the active domain of α-glucosidase, as determined by in vitro enzyme inhibitory assay. In addition, compound LA had a relatively high docking score, whereas it showed weak inhibitory effect.
Compared to SAC, compound LA presented the extremely opposite result between its docking score and the determined IC50 value. The difference may be ascribed to three possible factors. (1) For SAC, a large conjugated system is formed by the scaffold of 2-arylbenzo[b]furan ring and one chiral center exists. However, the introduction of the carboxyl group of LA breaks the generation of the conjugated system, and the molecule possesses three chiral centers. (2) According to the docking modes of SAC and LA binding to α-glucosidase (shown in ESI Fig. 2S†), it could be observed that 2-arylbenzo[b]furan ring located around the pocket mouth of the α-glucosidase active pocket and the 3,4-dihydroxyl-phenylpropionic acid stretched into innermost hydrophobic region. On the contrary, for compound LA, benzo[b]furan ring stretched into the inner of the active pocket, and 3,4-dihydroxyl-phenylpropionic acid located at the outside of the active pocket. Thus, the two molecules presented the extremely different conformations when binding to α-glucosidase, which mainly contributed to the different docking scores and results. (3) In addition, on basis of the docking modes, the hydrogen bonds and pi–pi interactions were also different for compounds SAC and LA.
Therefore, it is important to note that the relative correlation between the docking score and in vitro experimental affinity, which emphasizes the necessity of the further experimental validation and usefulness of the integrated approach applied to screen the bioactive compounds from complex natural products in this study.
3.3 Kinetic mode of α-glucosidase inhibition
Inhibition kinetic studies of the bioactive components identified in S. miltiorrhiza were carried out using Lineweaver–Burk plot analysis with the compound SAC and SAA. As shown in Fig. 4, the x-axis shows the various concentrations of the substrate 4-NPGP, whereas the y-axis shows the 1/V obtained from the absorbance rate per min (ΔA per min). The results suggested that compound SAC belonged to the mixed-type competitive mode inhibitor with respect to 4-NPGP for binding to α-glucosidase, which could be inferred by the fact that the plots did not intersect either the x or y-axis and cross to the left of the y-axis but above the 1/[4-NPGP]-axis. With such mode, the molecule SAC could bind to not only the protein α-glucosidase but also the 4-NPGP-α-glucosidase complex. Moreover, the competitive and uncompetitive inhibition constant Ki and were directly calculated based on the Lineweaver–Burk plot. Consequently, SAA exhibited competitive inhibition, suggesting it only bound to the active center of α-glucosidase with a Ki value of 21.2 μM. The Ki and
  values of the inhibitor SAC were determined as 1.5 and 8.8 μM, respectively. The Ki value was smaller (6-fold) than the
  value, indicating that the binding affinity of the inhibitor-α-glucosidase exceeded that of the inhibitor–enzyme–substrate complex.
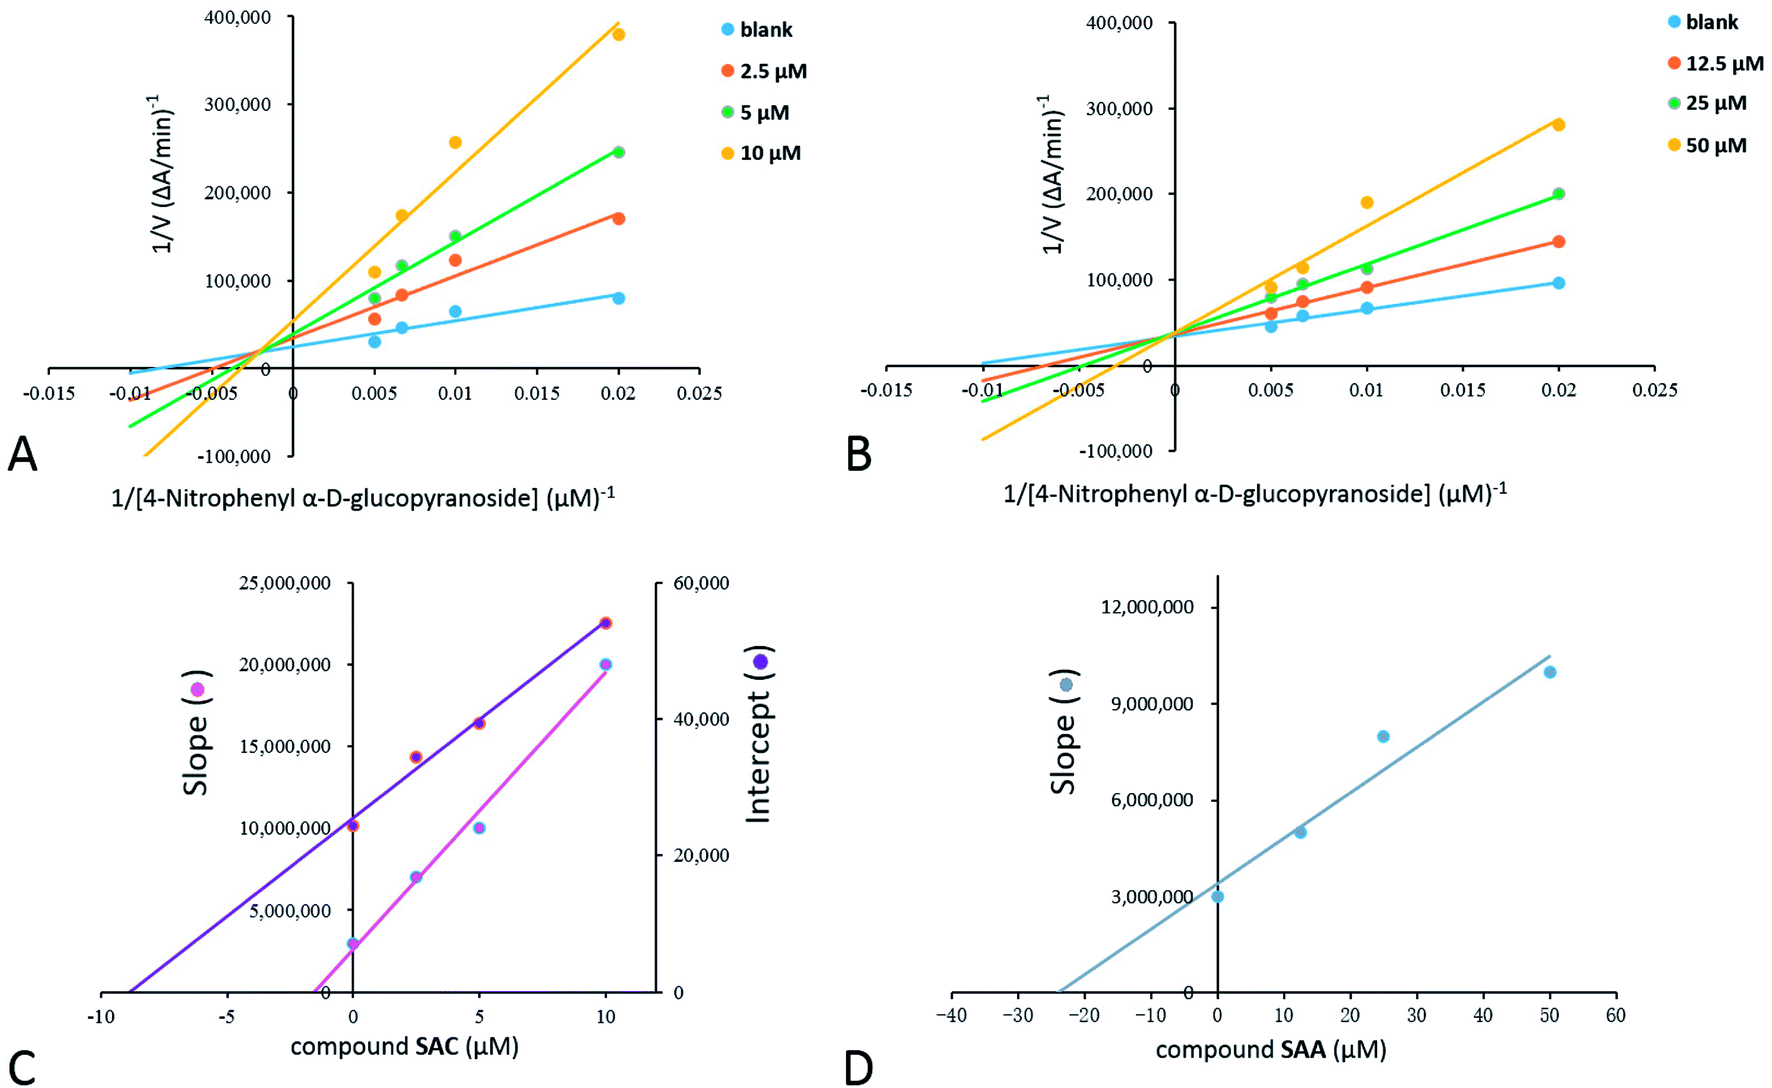 | ||
Fig. 4 Steady-state kinetic analysis of α-glucosidase by compounds SAC (A and C) and SAA (B and D). Lineweaver–Burk plots in the absence of compounds or at the different concentrations of compounds. Inset, Ki and  values were obtained from secondary plots of the slopes of the Lineweaver–Burk plots and the apparent 1/Vmax versus the inhibitor concentrations, respectively. Each point indicates the average value from three independent experiments. values were obtained from secondary plots of the slopes of the Lineweaver–Burk plots and the apparent 1/Vmax versus the inhibitor concentrations, respectively. Each point indicates the average value from three independent experiments. | ||
4. Conclusions
In this study, a combination of computational methods and experimental studies was adopted to investigate the interaction between S. miltiorrhiza and α-glucosidase. Molecular docking studies were performed to elucidate the proposed binding mechanisms of the chemicals identified in S. miltiorrhiza when interacting with α-glucosidase. The findings suggested that several key residues, hydrophobic interactions as well as hydrogen bonds played critical roles in maintaining the stability of the docking complex, such as Tyr72, Phe159, Asp215, Val216, Glu277, Gln279, Phe301, Asp352, Glu411 and Arg442. The obtained results were further validated by performing in vitro enzyme inhibitory assay. Consequently, two compounds including SAC and SAA were screened to exhibit potent α-glucosidase inhibitory activity. Moreover, the active molecule, SAC exhibited a mixed-competitive interaction mode when binding to α-glucosidase. Such conclusions may provide more insights into understanding the interactions between the reported therapeutic effects of the traditional Chinese medicine and various diseases. Likewise, the experimental data obtained in this work can provide an important indication of the usefulness of our integrated approach for this scenario.Conflicts of interest
There are no conflicts to declare.Acknowledgements
This work was financially supported by the National Natural Science Foundation of China (No. 31471615) and the Introduction of Talent Research Start-up Fund of Anhui Polytechnic University (No. 2017YQQ017).References
- U. F. Ezuruike and J. M. Prieto, J. Ethnopharmacol., 2014, 155, 857–924 CrossRef PubMed.
- M. Kalousova, T. Zima, V. Tesar, S. Stipek and S. Sulkova, Kidney Blood Pressure Res., 2004, 27, 18–28 CrossRef PubMed.
- S. W. Leong, F. Abas, K. W. Lam and K. Yusoff, Bioorg. Med. Chem. Lett., 2017, 28, 302–309 CrossRef PubMed.
- H. Rasouli, S. M. B. Hosseini-Ghazvini, H. Adibi and R. Khodarahmi, Food Funct., 2017, 8, 1942–1954 RSC.
- J. F. Hsieh, W. J. Lin, K. F. Huang, J. H. Liao, M. J. Don, C. C. Shen, Y. J. Shiao and W. T. Li, Eur. J. Med. Chem., 2015, 93, 443–451 CrossRef PubMed.
- S. R. Park, J. H. Kim, H. D. Jang, S. Y. Yang and Y. H. Kim, Food Chem., 2018, 257, 128–134 CrossRef PubMed.
- M. Taha, S. A. A. Shah, M. Afifi, S. Imran, S. Sultan, F. Rahim and K. M. Khan, Bioorg. Chem., 2018, 77, 586–592 CrossRef PubMed.
- G. Wang, M. Chen, J. Qiu, Z. Xie and A. Cao, Bioorg. Med. Chem. Lett., 2018, 28, 113–116 CrossRef PubMed.
- M. Taha, F. Rahim, S. Imran, N. H. Ismail, H. Ullah, M. Selvaraj, M. T. Javid, U. Salar, M. Ali and K. M. Khan, Bioorg. Chem., 2017, 74, 30–40 CrossRef PubMed.
- Z. Liu and S. Ma, ChemMedChem, 2017, 12, 819–829 CrossRef PubMed.
- U. Ghani, Eur. J. Med. Chem., 2015, 103, 133–162 CrossRef PubMed.
- P. Gupta, M. Bala, S. Gupta, A. Dua, R. Dabur, E. Injeti and A. Mittal, Pharmacol. Res., 2016, 113, 636–674 CrossRef PubMed.
- K. C. Morrison and P. J. Hergenrother, Nat. Prod. Rep., 2014, 31, 6–14 RSC.
- D. A. Dias, S. Urban and U. Roessner, Metabolites, 2012, 2, 303–336 CrossRef PubMed.
- L. Ouyang, Y. Luo, M. Tian, S. Y. Zhang, R. Lu, J. H. Wang, R. Kasimu and X. Li, Cell Proliferation, 2014, 47, 506–515 CrossRef PubMed.
- J. F. Hsieh, W. J. Lin, K. F. Huang, J. H. Liao, M. J. Don, C. C. Shen, Y. J. Shiao and W. T. Li, Eur. J. Med. Chem., 2015, 93, 443–451 CrossRef PubMed.
- Z. Y. Du, R. R. Liu, W. Y. Shao, X. P. Mao, L. Ma, L. Q. Gu, Z. S. Huang and A. S. C. Chan, Eur. J. Med. Chem., 2006, 41, 213–218 CrossRef PubMed.
- T. Hu and C. H. Cho, Biomol. Res. Ther., 2013, 2, 1000110 Search PubMed.
- L. M. Zhou, Z. Zuo and M. S. S. Chow, J. Clin. Pharmacol., 2005, 45, 1345–1359 CrossRef PubMed.
- Y. R. Lu and L. Y. Foo, Phytochemistry, 2002, 59, 117–140 CrossRef PubMed.
- J. W. Park, S. H. Lee, M. K. Yang, J. J. Lee, M. J. Song, S. Y. Ryu, H. J. Chung, H. S. Won, C. S. Lee, S. H. Kwon, Y. P. Yun, W. S. Choi and H. S. Shin, Arch. Pharmacal Res., 2008, 31, 47–53 CrossRef.
- K. W. Chan and W. S. Ho, Oncol. Rep., 2015, 34, 673–680 CrossRef PubMed.
- Y. Q. Ge, B. Yang, Z. Chen and R. B. Cheng, Mol. Med. Rep., 2015, 12, 7782–7788 CrossRef PubMed.
- T. Wang, D. Q. Zhang, Y. H. Li, H. Liu, Z. B. Liu, C. F. Zhao, L. M. Hu and X. M. Gao, J. Ethnopharmacol., 2010, 128, 575–582 CrossRef PubMed.
- H. Y. Ma, H. Y. Gao, L. Sun, J. Huang, X. M. Xu and L. J. Wu, J. Nat. Med., 2011, 65, 37–42 CrossRef PubMed.
- S. J. Y. Macalino, V. Gosu, S. Hong and S. Choi, Arch. Pharmacal Res., 2015, 38, 1686–1701 CrossRef PubMed.
- C. L. Hung and C. C. Chen, Drug Dev. Res., 2014, 75, 412–418 CrossRef PubMed.
- L. G. Ferreira, R. N. Dos Santos, G. Oliva and A. D. Andricopulo, Molecules, 2015, 20, 13384–13421 CrossRef PubMed.
- E. Yuriev, J. Holien and P. A. Ramsland, J. Mol. Recognit., 2015, 28, 581–604 CrossRef PubMed.
- C. Y. Su, Q. L. Ming, K. Rahman, T. Han and L. P. Qin, Chin. J. Nat. Med., 2015, 13, 163–182 Search PubMed.
- A. N. Jain, J. Comput.–Aided Mol. Des., 1996, 10, 427–440 CrossRef PubMed.
- K. Yamamoto, H. Miyake, M. Kusunoki and S. Osaki, FEBS J., 2010, 277, 4205–4214 CrossRef PubMed.
Footnote |
| † Electronic supplementary information (ESI) available. See DOI: 10.1039/c8ra04772c |
| This journal is © The Royal Society of Chemistry 2018 |