
 Open Access Article
 This Open Access Article is licensed under a Creative Commons Attribution-Non Commercial 3.0 Unported Licence
Preparation and characterization of petroleum-based mesophase pitch by thermal condensation with in-process hydrogenation
Ming Li†
 a,
Yadong Zhang†b,
Shitao Yu*a,
Congxia Xiea,
Dong Liub,
Shiwei Liua,
Ruiyang Zhaoa and
Bing Biana
a,
Yadong Zhang†b,
Shitao Yu*a,
Congxia Xiea,
Dong Liub,
Shiwei Liua,
Ruiyang Zhaoa and
Bing Biana
aCollege of Chemical Engineering, Qingdao University of Science and Technology, Qingdao, China 266042. E-mail: yushitaoqust@126.com; Fax: +86-0532-84022782; Tel: +86-0532-84022782
bState Key Laboratory of Heavy Oil Processing, China University of Petroleum, Qingdao, China 266580
First published on 29th August 2018
Abstract
A petroleum aromatic-rich component was used to prepare mesophase pitch by thermal condensation. In-process hydrogenation method was employed to achieve the hydrogenation reaction of intermediates generated during the thermal reaction using tetrahydronaphthalene (THN) as a hydrogen donor. Impacts of in-process hydrogenation on the properties of intermediates and mesophase pitches were investigated. It was found that the in-process hydrogenation was conducive to the generation of hydrogenated intermediates with concentrated extracted component distribution, uniform molecular structure and abundant naphthenic structures. The characterizations of mesophase pitches showed that the in-process hydrogenation contributed to the preparation of mesophase pitch with concentrated extracted component distribution, low softening point, large domain structure and ordered crystal structure. This was due to the increasing contents of naphthenic structures in intermediates. Moreover, the increase of methylene bridges in the product was the critical reason for improving the product's properties.
1. Introduction
The petroleum-based mesophase pitch has been widely used for preparing carbon materials due to its outstanding performance, good processability, high carbon yield, low price, etc.1–3 As the by-product of heavy oil refining, the FCC slurry oil is generally applied to preparing aromatic plasticizers, oil additives, heat transfer oils, rubber additives, etc., which resulted in environmental problems and waste of resources.4 The polycyclic aromatic compound in FCC slurry oil with low H/C atomic ratio is theoretically the ideal material for the generation of mesophase pitch.5,6 As a result, the formation and reaction mechanism of the petroleum-based mesophase pitch are the research priorities for high-value utilization of heavy oil and production of carbon materials.7,8Numerous research studies have been performed to study the effects of molecular structure and composition of raw material on the rheological properties, polarized structure and liquid-crystal structure of the carbonized product.9–11 Menéndez et al.11 have suggested that the molecular composition of feedstock had an important influence on the properties of mesophase product by investigating the structural relationship of petroleum pitches and their condensation products. Korai et al.12 have explored the role of alkyl groups played on the properties of carbonized products, and they found that the present of methyl and methylene structures in mesophase molecules is benefit for the stacking and arrangement of mesogenic molecules. Shin et al.13 also suggested that the optical textures and crystal structures of mesophase pitches varied with the contents of alky groups in feedstock. Hydrogenation of feedstock or mesophase precursor is one of the effective and widely used methods for regulating the properties of mesophase pitch.14,15 After studying the impacts of alkyl groups on mesophase development during the hydrogenation of mesophase precursor, Miyake et al.15 proposed that the optical texture, molecular and crystal structures of mesophase pitch became better with raising the degree of hydrogenation. Machnikowski et al.16–18 have also stressed the importance of hydrogenation of coal-tar pitch during the generation of mesophase product.
The mesophase pitch was traditionally prepared by direct thermal condensation method19–21 which had some advantages, such as simple process and operation. However, it had special requirement on feedstock's structure and equipment material.22 Therefore, many studies have focused on the modification of feedstock and process. It was proved that the hydrogenation was an effective method to improve the quality of mesophase pitch.23 The in-process hydrogenation means that a hydrogen donor is used to react with condensation intermediates generated during the formation of mesophase product. This method was generally used in the hydrovisbreaking process of residual oil, aiming to lower the viscosity and improve the rheology of reaction system.24–26 Theoretically, the in-process hydrogenation is conductive to the generation of improved mesophase pitch. Guo et al.26 have investigated the roles of in-process hydrogenation played on the properties of residue during the hydrovisbreaking process. They found that the present of hydrogen donor was able to slow down the reaction rate, reduce the viscosity of reaction system and prolong the coking-induction period. Dehkissia27 and Hidalgo-Herrador et al.28,29 have also noted that the hydrogen donor used in the hydrovisbreaking process could inhibit the formation of coke and improve the systematic rheological property.
As reported in our previous work,30 the in-process hydrogenation was first used in the preparation of mesophase pitch. Tetrahydronaphthalene was selected as hydrogen donor to treat the intermediates generated during the thermal reaction. The study proposed that the optical structure of mesophase became better after in-process hydrogenation. However, the impacts of in-process hydrogenation on molecular and crystal structures of product have not been explored in the above researches. This work focused on the preparation of mesophase pitch with low softening point and ordered crystal structure through the thermal condensation with one-stage and two-stage in-process hydrogenations. The effects of in-process hydrogenation on the structural composition of intermediates and the properties of mesophase pitches were investigated.
2. Material and method
2.1 Material
The feedstock petroleum aromatic-rich component provided by CNOOC Company was named F. The elemental distribution, average molecular weight (M), SARA (including four components: saturates, aromatics, resin and asphaltene) and carbon residue of F are summarized in Table 1. The F has abundant carbon and little nitrogen, sulphur and oxygen. Besides, the aromatics component was enriched in F, while the asphaltene component was not found.| a The margins of error were obtained by calculating the average values of three parallel determination results. | |
|---|---|
| Sample | F |
| Elemental composition/wt% | |
| C | 89.05 ± 0.06 |
| H | 10.87 ± 0.05 |
| N | 0.02 ± 0.01 |
| S | 0.03 ± 0.01 |
| O | 0.03 ± 0.01 |
| M | 372.19 ± 0.07 |
| SARA/wt% | |
| Saturates | 14.47 |
| Aromatics | 56.40 |
| Resin | 30.15 |
| Asphaltene | 0 |
| Carbon residue/wt% | 9.61 ± 0.05 |
Chemical agents used in this work, such as tetrahydronaphthalene (C10H12, ≥ 97.0%), n-heptane (C7H16, ≥ 99.0%), toluene (C6H5CH3, ≥ 99.5%), quinolone (C9H7N, ≥ 98.0%) and pyridine (C5H5N, ≥ 99.5%) were all purchased from Sinopharm Chemical Reagent Co., Ltd.
2.2 Thermal condensation and in-process hydrogenation
The preparation process of mesophase pitches through thermal condensation with in-process hydrogenation was presented in Fig. 1. The thermal reaction of F was run in a 100 ml autoclave at 430 °C under 2 MPa. The intermediate generated at 2.0 h was named I. Then I was treated by 6 wt% of tetrahydronaphthalene (THN) at 390 °C under 8 MPa for 45 min and the hydrogenated intermediate was labeled as I2, while the intermediate without treatment using THN was hydrogen donor was named I1. This was the one-stage in-process hydrogenation. Subsequently, the I2 was treated at 430 °C under 2 MPa for 2.0 h, and the resultant intermediate was called N. Then the two-stage in-process hydrogenation process was conducted. The intermediate N was treated by 6 wt% of THN at 390 °C under 8 MPa for 45 min and the resultant hydrogenated intermediate was named N3, while the intermediate without the second hydrogenation was named N2. Meanwhile, I1 was treated without hydrogen donor under the same reaction condition as that of I2, and the resultant unhydrogenated intermediate was named N1. After that, the thermal condensation of intermediates N1, N2 and N3 were carried out at 430 °C under 2 MPa for 2 h. The final products were labeled as N1-MP, N2-MP and N3-MP. | ||
| Fig. 1 Preparation scheme of mesophase pitches. | ||
2.3 Characterization
A Cario EL elemental analyzer (made by Elementar Company) was used to analyze the elemental composition of sample.The average molecular weight of feedstock was characterized on a JJG 877-2011 vapor pressure osmometer using benzyl as standard substance and calculated according to VPO method.31
The volatiles of intermediates were tested according to the SH/T 0026-90 standard.
The carbon residues of feedstock and intermediates were analyzed in accordance with ASTM D4530 standard.
The SARA of feedstock was characterized according to the SH/T 0509-98 standard.
The solubility of sample was analyzed by the contents of sample's four solvent extracted components,32 including heptane-soluble component (HS), heptane-insoluble/toluene-soluble component (HI-TS), toluene-insoluble/quinoline-soluble component (TI-QS) and quinoline-insoluble component (QI).
The condensation intermediates and mesophase pitches' pyridine-soluble (PS) components were characterized by a Varian AS600 NMR spectrometer with tetramethylsilane as internal standard and deuterated pyridine as solvent.
The softening points (SP) of intermediate and mesophase pitch were measured by the ring-and-ball method (ASTM D3461standard) and penetrometer method.33
The polarized structures of products were obtained on a XP-1500 polarizing microscope made by the Milite Company.
The products were characterized by an inVia Raman spectrometer (Renishaw Company) at 75 mW laser power with Ar monochromatic light source as excitation source (λ = 633 nm).
The crystal structures of products were determined by a D/MAX/2500PC X-ray diffractometer made by Rigaku Corporation.
3. Results and discussion
3.1 Characterization of intermediates
| a The margins of error were obtained by calculating the average values of three parallel determination results. | |||
|---|---|---|---|
| Sample | N1 | N2 | N3 |
| Elemental composition/wt% | |||
| C | 93.56 ± 0.03 | 93.03 ± 0.02 | 92.41 ± 0.04 |
| H | 6.36 ± 0.04 | 6.91 ± 0.03 | 7.53 ± 0.04 |
| N | 0.02 ± 0.01 | 0.02 ± 0.01 | 0.02 ± 0.01 |
| S | 0.03 ± 0.01 | 0.02 ± 0.01 | 0.02 ± 0.01 |
| O | 0.03 ± 0.01 | 0.02 ± 0.01 | 0.02 ± 0.01 |
| SP/°C | 118 ± 3 | 93 ± 2 | 87 ± 2 |
| Extracted component/wt% | |||
| HS | 31.64 ± 0.05 | 27.15 ± 0.02 | 26.51 ± 0.06 |
| HI-TS | 26.26 ± 0.03 | 31.89 ± 0.04 | 38.28 ± 0.02 |
| TI-QS | 31.43 ± 0.04 | 34.13 ± 0.03 | 31.05 ± 0.05 |
| QI | 10.67 ± 0.06 | 6.83 ± 0.03 | 4.16 ± 0.03 |
| Volatiles/wt% | 20.57 ± 0.08 | 22.46 ± 0.05 | 23.84 ± 0.07 |
| Carbon residue/wt% | 31.27 ± 0.05 | 28.19 ± 0.07 | 25.70 ± 0.06 |
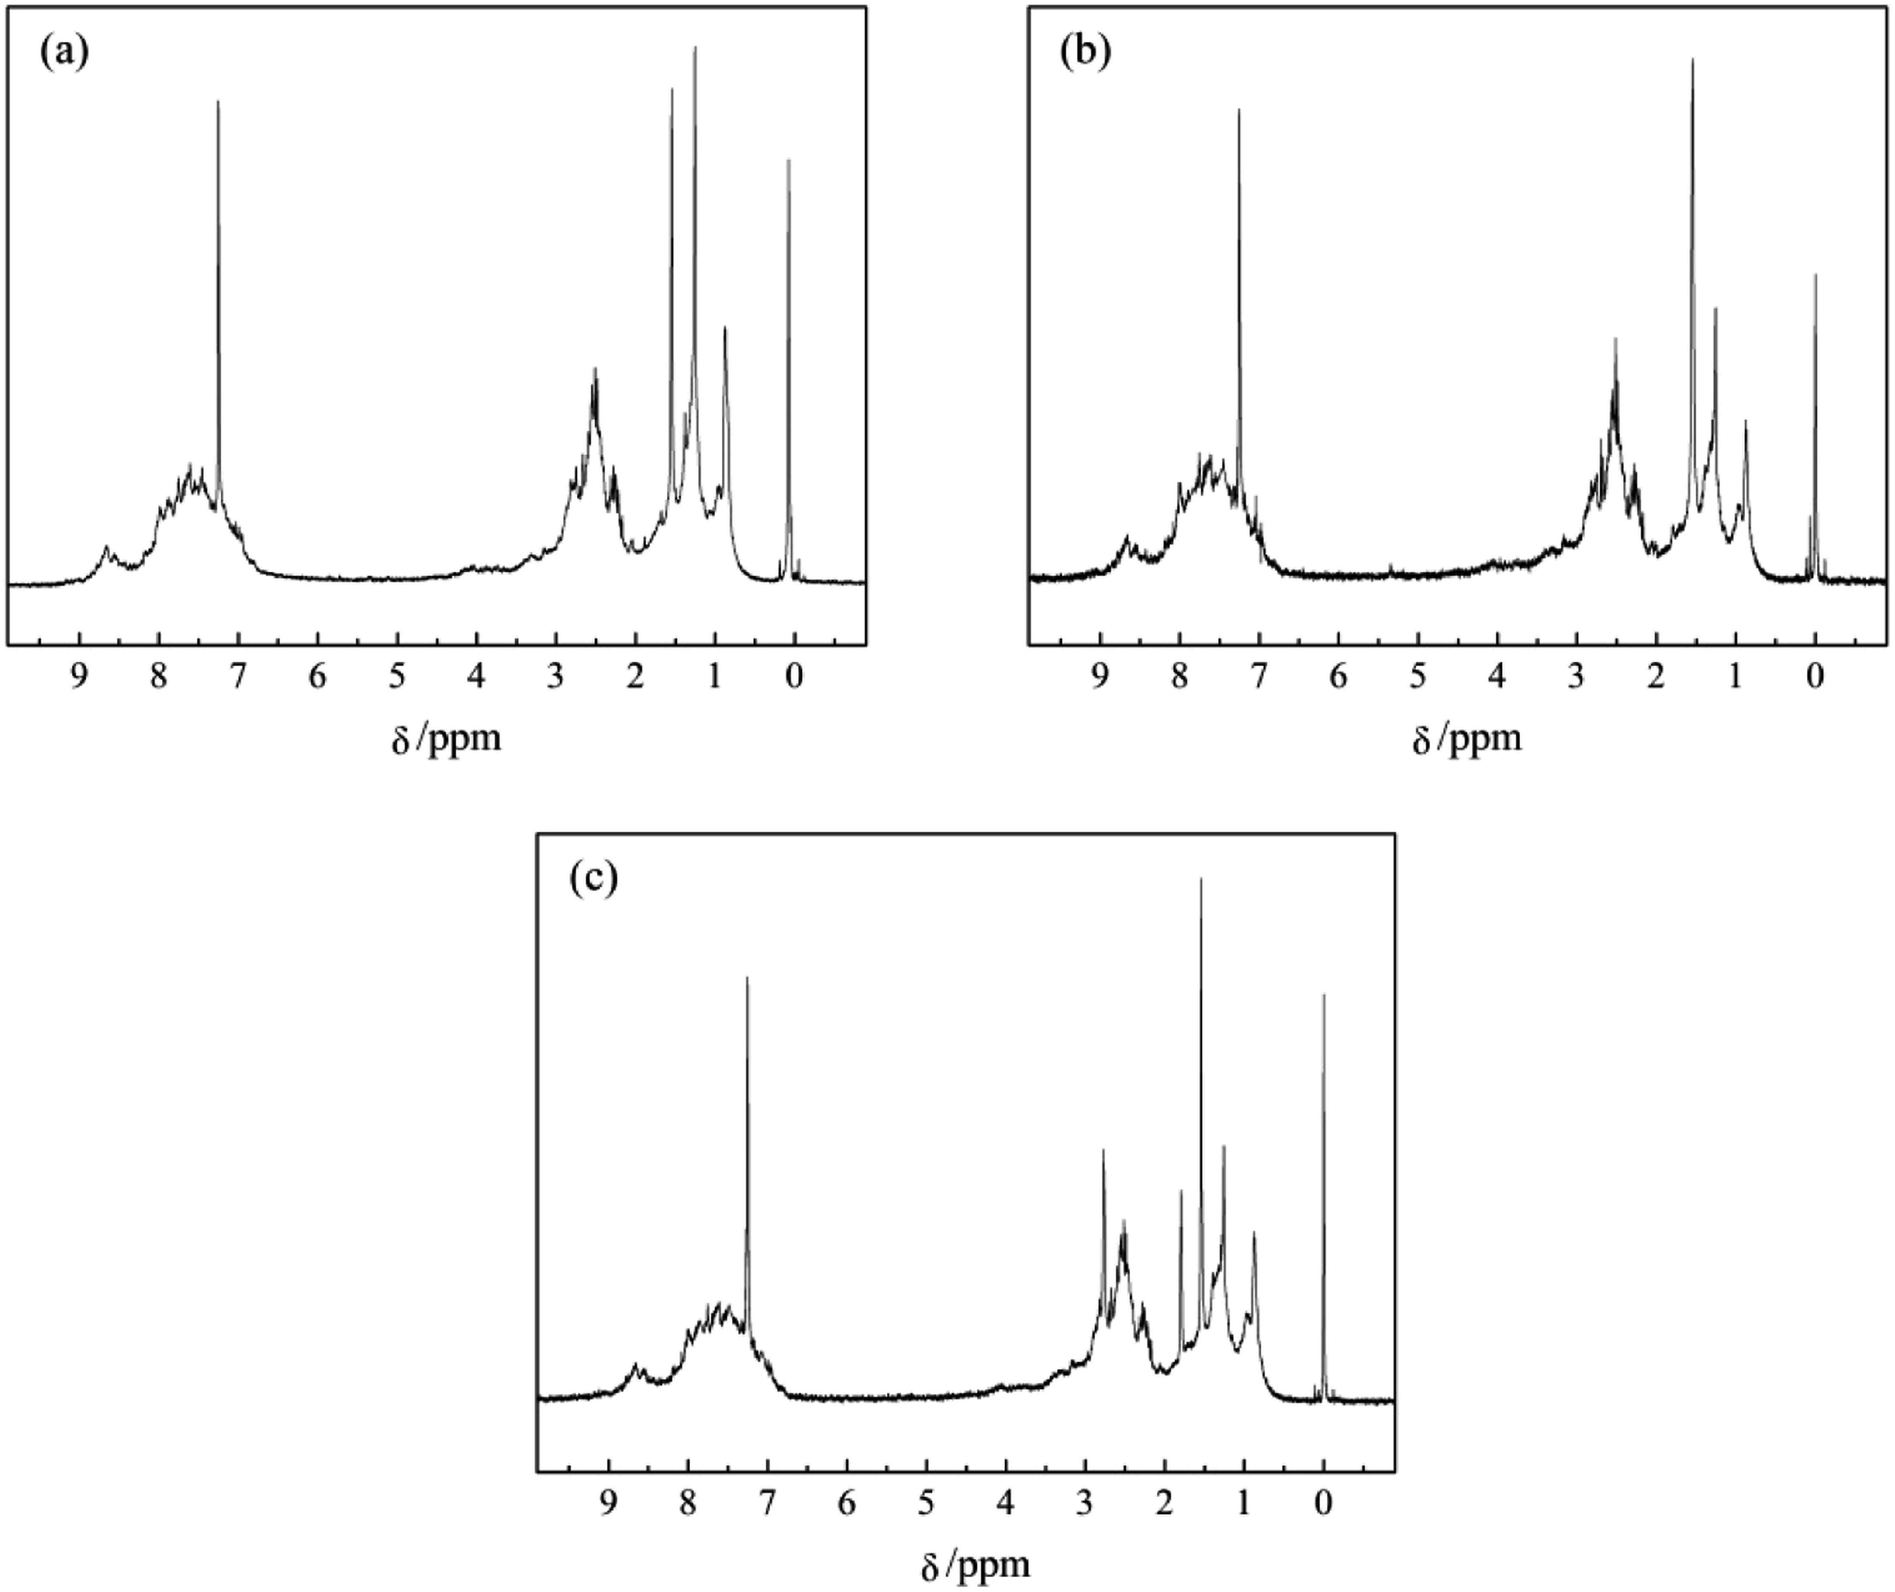 | ||
| Fig. 2 1H NMR spectra of (a) N1, (b) N2 and (c) N3. | ||
| Sample | Hydrogen contents/% | |||||
|---|---|---|---|---|---|---|
| Har | HF | Hα | Hβ | Hγ | HN | |
| a Har, aromatic hydrogen (9.0–6.0 ppm); HF, methylene bridge (4.5–3.3 ppm); HN, naphthenic hydrogen (2.0–1.4 ppm); Hα+β+γ, aliphatic hydrogen in α-, β- and γ-position (3.3–2.0, 1.4–1.0 and 1.0–0.5 ppm).16,17 | ||||||
| N1 | 59.97 | 0.91 | 21.52 | 11.06 | 4.47 | 2.07 |
| N2 | 55.03 | 0.93 | 22.57 | 10.39 | 4.84 | 6.24 |
| N3 | 52.46 | 0.98 | 22.33 | 10.18 | 5.08 | 8.97 |
The contents of Har hydrogens in the three intermediates N1, N2, and N3 decreased gradually (shown in Table 3), implying the decreasing condensation degrees of the intermediates and the increasing alkyl structures in the intermediates.16 The contents of Hα, Hβ, Hγ and HF in the three intermediates varied little, while the contents of HN increased significantly. This indicated that the contents of alkyl chains and methylene bridges in the three intermediates were similar, but the contents of naphthenic structures increased significantly with the rising degree of the in-process hydrogenation.30,35 To sum up, the in-process hydrogenation was conductive to the decrease of intermediates' condensation degrees and the increase of intermediates' naphthenic structures. Given the solubility and hydrogen distribution analyses of intermediates, the increase of the naphthenic structures in intermediate was the reason for the change of the intermediates' molecular structures and extracted component distributions.
3.2 Solubility and SP analyses of products
The extracted component distributions and SP of mesophase pitches N1-MP, N2-MP and N3-MP are summarized in Table 4. The contents of HS and QI components in N1-MP, N2-MP and N3-MP decreased successively, while the contents of the two middle components HI-TS and TI-QS increased obviously. This implied that the concentration degree of the extracted component distribution increased with the rising degree of the in-process hydrogenation. In addition, the SP of the three mesophase pitches decreased in sequence.| Sample | Extracted component/wt% | SP/°C | |||
|---|---|---|---|---|---|
| HS | HI-TS | TI-QS | QI | ||
| a The margins of error were obtained by calculating the average values of three parallel determination results. | |||||
| N1-MP | 9.28 ± 0.04 | 13.77 ± 0.06 | 23.59 ± 0.07 | 53.36 ± 0.03 | 297 ± 3 |
| N2-MP | 6.10 ± 0.03 | 15.92 ± 0.06 | 30.12 ± 0.05 | 47.86 ± 0.04 | 253 ± 4 |
| N3-MP | 4.37 ± 0.07 | 16.76 ± 0.04 | 36.54 ± 0.06 | 42.33 ± 0.05 | 239 ± 2 |
During the in-process hydrogenation, the hydrogen donor THN gave preference to provide hydrogen for the polycyclic aromatic compounds with high condensation degree,26 which could reduce the condensation degree of aromatic compounds and restrain the formation of coke at some extent. So the content of QI component in mesophase pitch decreased with the rising degree of the in-process hydrogenation. Additionally, the decrease of aromatic compounds with high condensation degree was conductive to the maintenance of low systematic viscosity,34 which could promote the conversion of HS component to HI component sufficiently. Therefore, the content of HS component in mesophase pitch also decreased with raising the degree of the in-process hydrogenation. Naturally, molecules in mesophase products were increasing concentrated in the middle extracted components. As mentioned above, the hydrogen-transfer reactions trigged by the abundant naphthenic groups in the intermediates (N2 and N3) were benefit for the improvement of the mesophase pitches' rheological property. This could prevent the excessive reaction and prolong the coking-induction period.26,30 So the softening points of N2-MP and N3-MP were lower than that of N1-MP. The above demonstrated that in-process hydrogenation method contributed to the preparation of mesophase product with concentrated extracted component distribution and low softening point.
3.3 Optical structure analysis of products
The polarized micrographs of mesophase pitches N1-MP, N2-MP and N3-MP are presented in Fig. 3. The mesophase pitch N1-MP possessed medium domain structure, while N2-MP and N3-MP had large domain structure. Compared with N2-MP, the size of the anisotropic structure of N3-MP was larger. This was attributed to the differences of extracted component distributions and molecular structures among their intermediates N1, N2 and N3. During the thermal treatments of intermediates, the present of QI component with polycyclic aromatic compounds was able to promote the formation of anisotropic phase as initial nucleus at the initial stage of thermal reaction.4,26 Then the system viscosity increased fast and the macromolecular layers were not able to move directionally and be orientated rearranged.33 Hence, the high content of QI in intermediate N1 resulted in a coarse mosaic structure formed in N1-MP. In addition, the abundant naphthenic structures in intermediates N2 and N3 was the reason for the formation of large domain structure in N2-MP and N3-MP. During the preparation of N2-MP and N3-MP, the existence of naphthenic structures in N2 and N3 could effectively alleviate the carbonization, decrease the viscosity of reaction system and improve the systematic rheological property though hydrogen-transfer reactions.9,10 This contributed to the rearrangement of mesophase molecular layers. As a result, the large domain structure was naturally formed in mesophase pitches N2-MP and N3-MP. Furthermore, compared with N2-MP, N3-MP possessed more ordered domain structure due to its higher content of naphthenic structures. The above indicated that the optical structure of mesophase product was improved by the in-process hydrogenation via decreasing the QI component content and increasing naphthenic structure content of intermediate.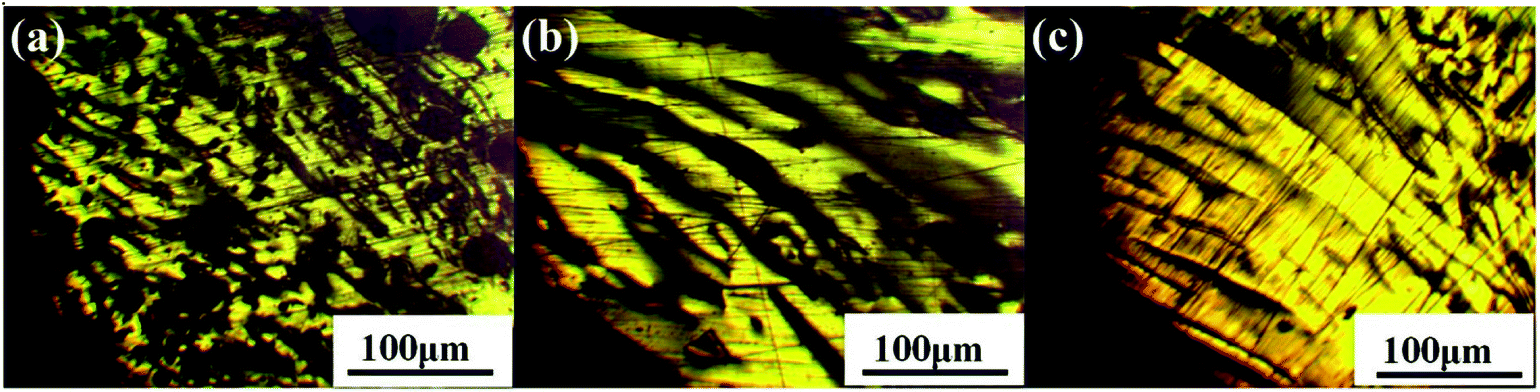 | ||
| Fig. 3 Polarized micrographs of mesophase products: (a) N1-MP, (b) N2-MP and (c) N3-MP. | ||
3.4 1H NMR analysis of products
Fig. 4 illustrates the 1H NMR spectra of PS component of N1-MP, N2-MP and N3-MP (labeled as N1-MP-PS, N2-MP-PS and N3-MP-PS, separately). Table 5 listed the corresponding hydrogen distributions.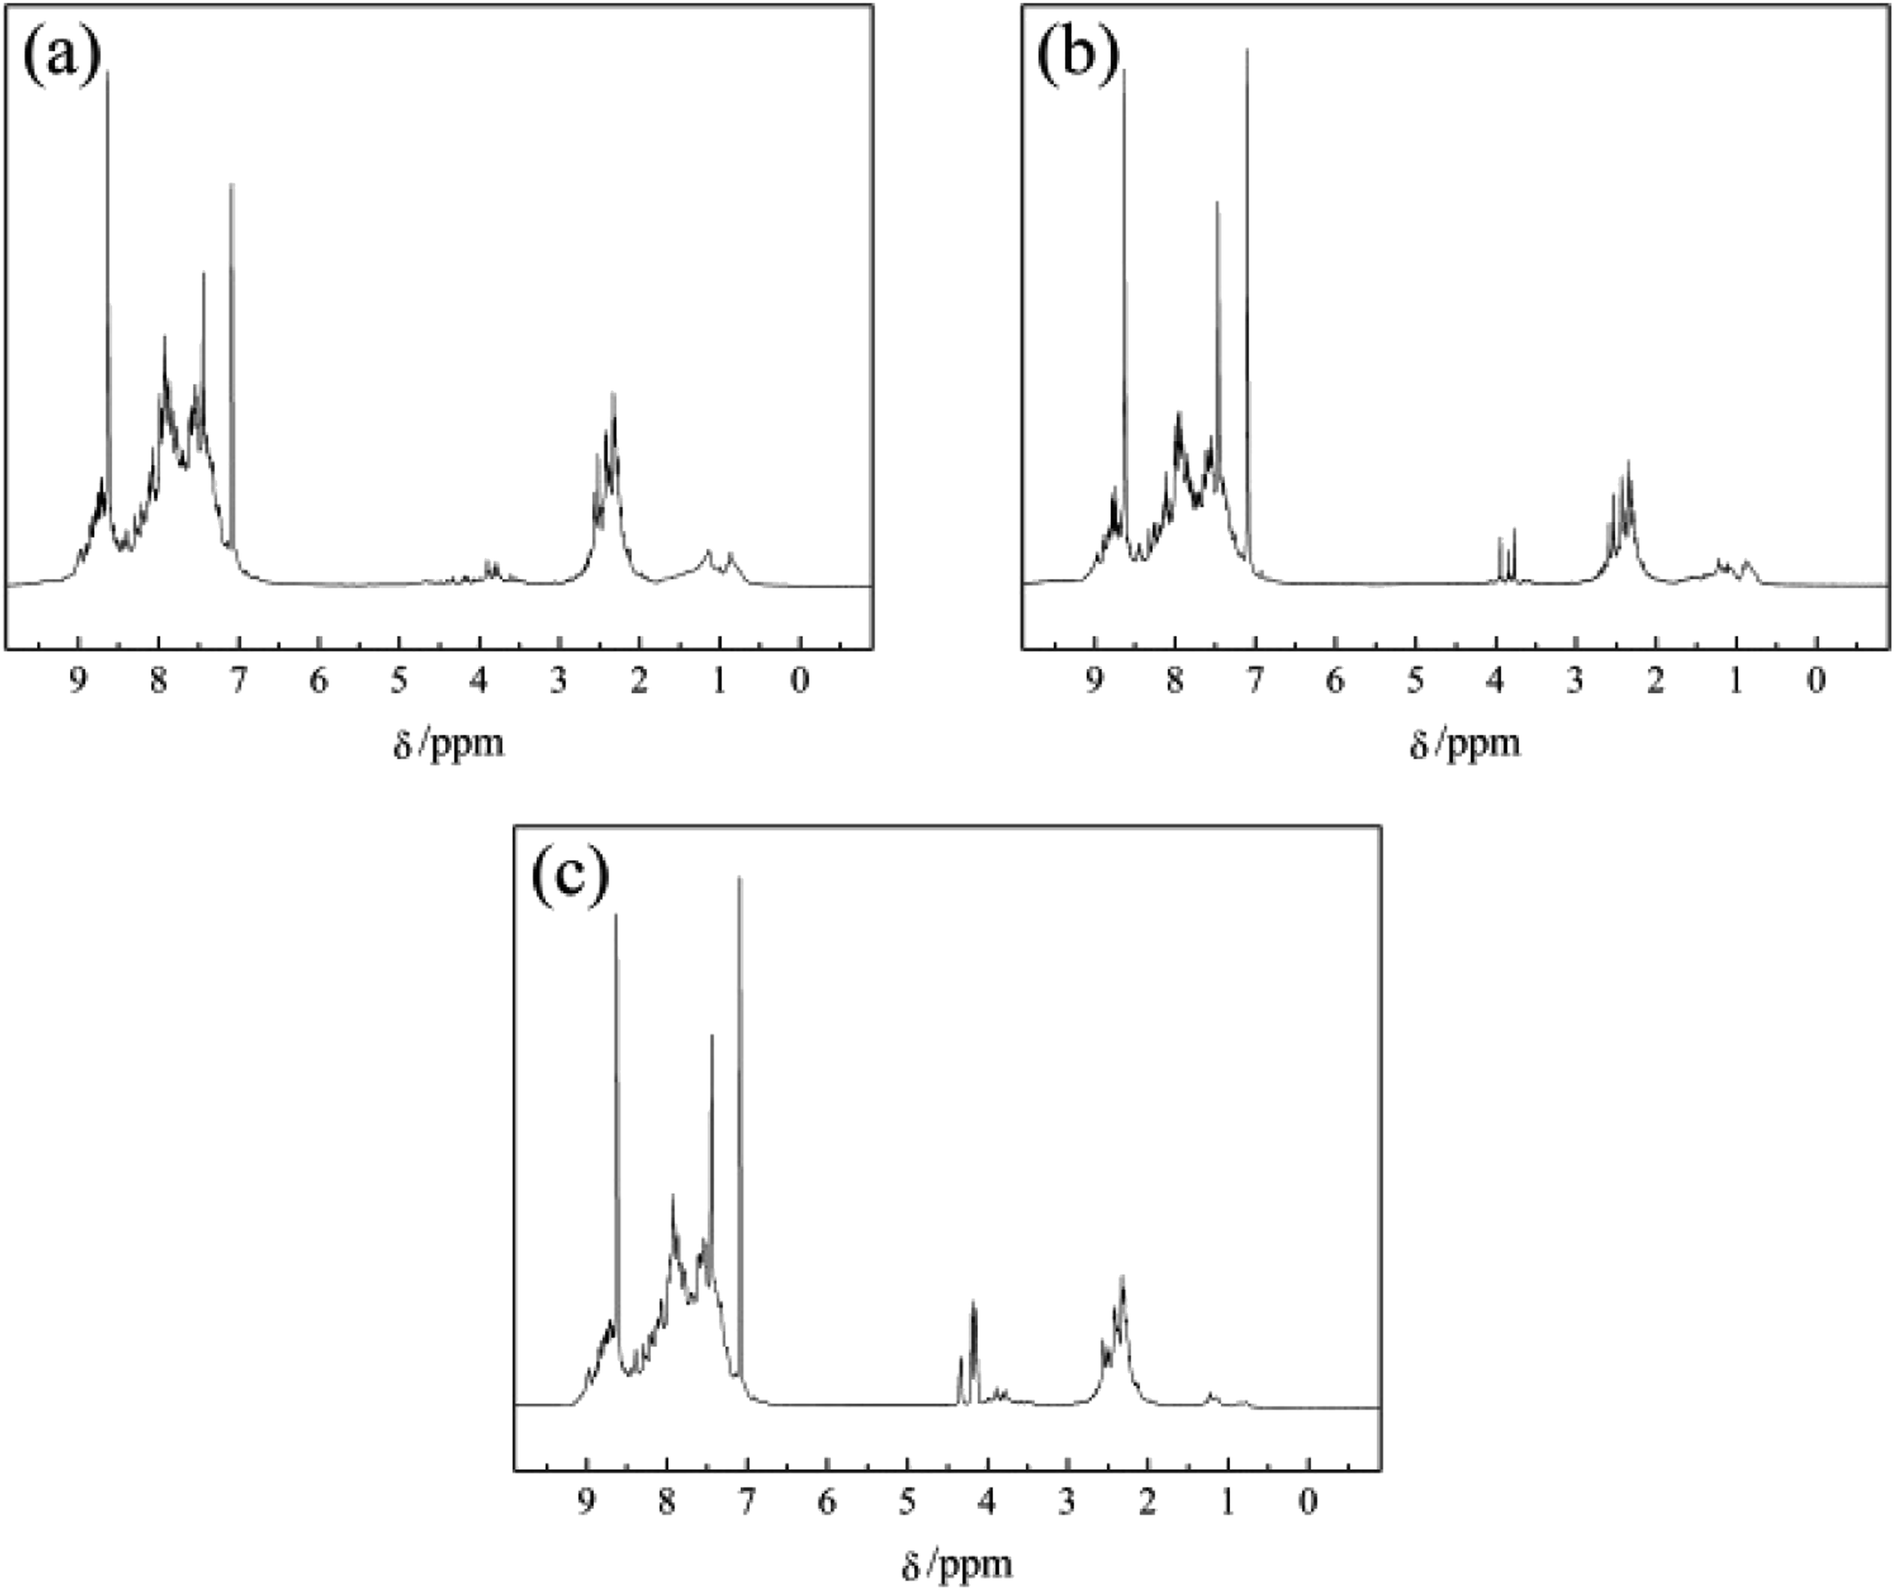 | ||
| Fig. 4 1H NMR spectra of (a) N1-MP-PS, (b) N2-MP-PS and (c) N3-MP-PS. | ||
| Sample | Hydrogen contents/% | |||||
|---|---|---|---|---|---|---|
| Har | HF | Hα | Hβ | Hγ | HN | |
| N1-MP-PS | 78.97 | 1.12 | 14.26 | 2.29 | 3.21 | 0.15 |
| N2-MP-PS | 74.98 | 5.86 | 13.95 | 2.15 | 2.89 | 0.17 |
| N3-MP-PS | 72.06 | 9.97 | 13.71 | 1.86 | 2.24 | 0.16 |
The content of Har in N1-MP-PS, N2-MP-PS and N3-MP-PS decreased respectively (shown in Table 5), indicating the increasing contents of alkyl structures in the three mesophase products. The contents of Hα, Hβ, Hγ and HN hydrogens in the three PS components changed little, while the content of HF increased obviously. This implied that the proportions of alkyl chains and naphthenic structures in the three products were similar, but the contents of methylene bridges increased notably.35 Given the optical structure and 1H NMR spectra analyses of mesophase products, the increase of the methylene bridges in products was the critical reason for improving the product's properties.
3.5 Raman analysis of product
Fig. 5 presents the Raman spectra of products N1-MP, N2-MP and N3-MP. The Raman parameters are shown in Table 6.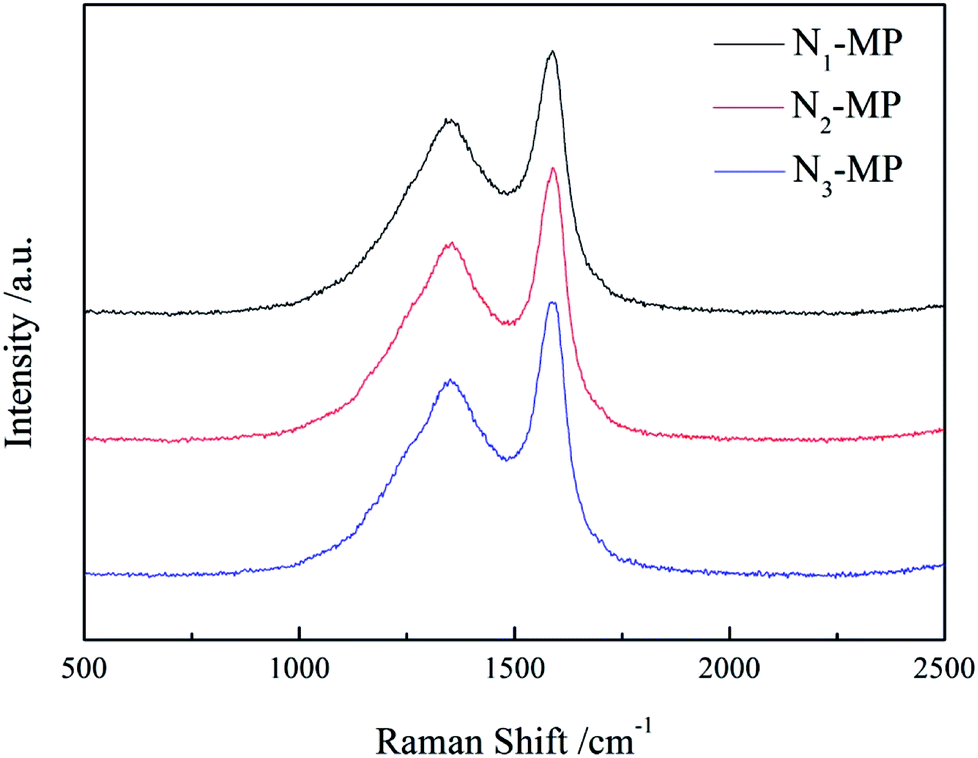 | ||
| Fig. 5 Raman spectra of N1-MP, N2-MP and N3-MP. | ||
| Sample | ID/IG | WD/cm | La (×10−2) |
|---|---|---|---|
| a ID/IG, the intensity ratio of D peak to G peak; WD, the full width at half-maximum (FWHM) of D peak; La, the crystal size. | |||
| N1-MP | 0.437 | 57 | 1.259 |
| N2-MP | 0.405 | 54 | 1.358 |
| N3-MP | 0.384 | 49 | 1.432 |
The D and G peaks (near 1350 and 1580 cm−1 in Fig. 5), illustrated in the spectra of the three mesophase products, denoted the carbon with defective structure and the highly oriented graphite crystalline.33 The intensity ratio of D peak to G peak (ID/IG) was on behalf of the degree of crystal defect. The crystal sizes (La) which represented the incipient graphitization degrees of products were calculated according to the Shuker–Gammon equation. As shown in Table 6, the ID/IG ratios and WD of the three products increased as N3-MP < N2-MP < N1-MP, while the La decreased in this order. This indicated that the incipient graphitization degrees of N2-MP and N3-MP were superior to those of N1-MP. This was ascribed to the abundant naphthenic structures in the intermediates N2 and N3. As previously explained, the increased naphthenic structures in hydrogenated intermediates could reduce the viscosity of reaction system and improve the systematic rheological property. This was benefit for the movement and be rearrangement of mesophase molecular layers. So the mesophase products N2-MP and N3-MP possessed more oriented crystal structures than N1-MP. In this sense, the crystal structure of product was able to be improved by in-process hydrogenation method via changing the naphthenic structure content in intermediate.
3.6 XRD analysis of products
Fig. 6 illustrates the XRD patterns of products N1-MP, N2-MP and N3-MP, and Table 7 listed the corresponding crystalline parameters.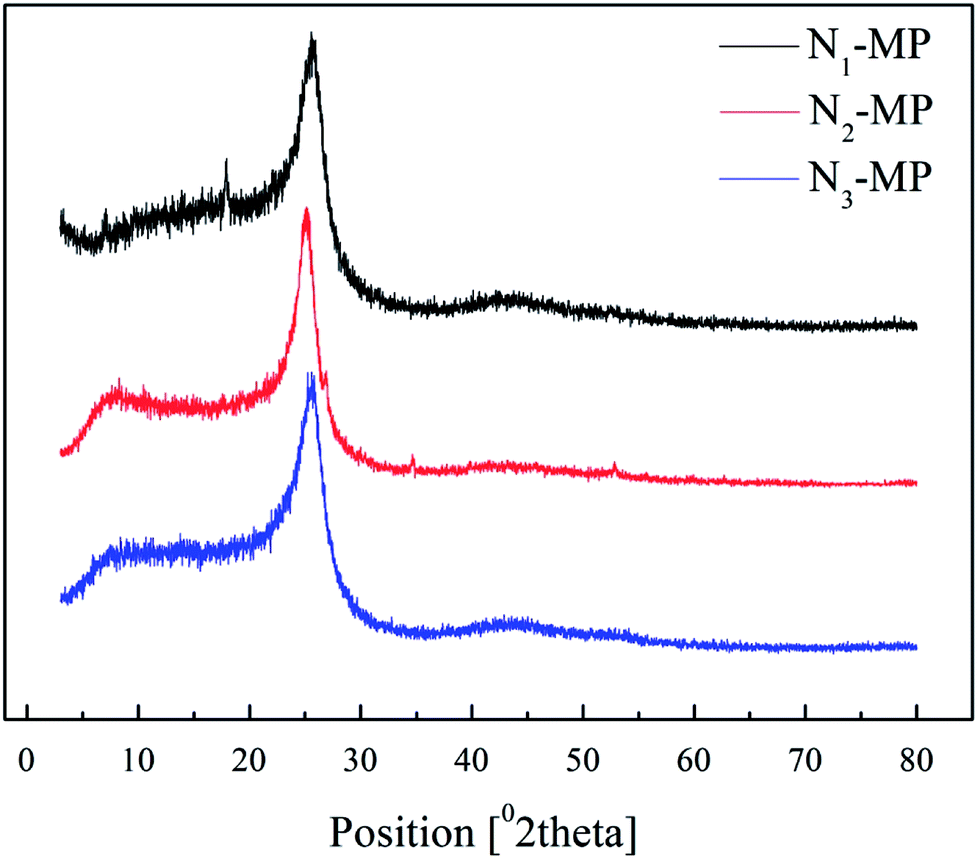 | ||
| Fig. 6 XRD spectra of N1-MP, N2-MP and N3-MP. | ||
| Sample | d002/Å | Lc/nm | Me | Og |
|---|---|---|---|---|
| a d002, interlayer spacing; Lc, stacking height; Me, layer number; Og, orientation degree. | ||||
| N1-MP | 3.75 | 2.36 | 7.29 | 0.895 |
| N2-MP | 3.52 | 2.78 | 8.90 | 0.946 |
| N3-MP | 3.46 | 3.09 | 9.93 | 0.972 |
As illustrated in Fig. 6, the diffraction peaks (near 25.6 and 43.0), represented aromatic layer and crystal plane, were all displayed in spectra of N1-MP, N2-MP and N3-MP. This demonstrated that the three products all possessed initial crystal forms.33,35 The parameters Lc, Me and Og of the three products increased in the order: N1-MP < N2-MP < N3-MP, while the d002 increased in the reverse order (presented in Table 7). This suggested that crystal structures of the three products were increasingly improved. It meant that the present of naphthenic structures in intermediates was benefit for the generation of mesophase product with ordered crystal structure. This was accordant with the analysis results of mesophase pitches' polarized structures and Raman spectra.
To sum up, the in-process hydrogenation method contributed to the generation of mesophase product with concentrated extracted component distribution, low softening point, large domain structure and ordered crystal structure. Furthermore, the properties of mesophase product were improved by the in-process hydrogenation via increasing the naphthenic structure content in intermediate.
4. Conclusion
The in-process hydrogenation was a new method to prepare mesophase pitch, and proved to have obvious promoting effect on the formation and development of mesophase pitch with high quality. The molecular structures of feedstock have an important influence on the formation and development of mesophase pitch. The impacts of in-process hydrogenation method on the properties of intermediates and products were discussed. It was found that in-process hydrogenation contributed to the generation of intermediates with concentrated extracted component distribution and uniform molecular structure. This was ascribed to the increased naphthenic structures in hydrogenated intermediates. The characterizations of mesophase pitches showed that in-process hydrogenation method was benefit for the preparation of product with concentrated extracted component distribution, low softening point, large domain structure and ordered crystal structure. The properties of mesophase pitch were improved by the in-process hydrogenation via increasing the naphthenic structure content in intermediate. Moreover, the increase of methylene bridges in the product was the critical reason for improving the product's properties.Conflicts of interest
There are no conflicts to declare.Acknowledgements
This work has been supported by the Key R&D Project of Shandong (2016GGX107001, 2016GGX102017 and 2017GGX40106), the Postdoctoral Foundation of Qingdao (210/04000635), the Taishan Scholars Projects of Shandong (ts201511033) and the National Natural Science Foundation (31370570 and 51703112).References
- H. Zhu, X. Li, Z. Dong, G. Ma, F. Han, Y. Cong, G. Yuan, Z. Cui and A. Westwood, Effect of carbon fiber crystallite size on the formation of hafnium carbide coating and the mechanism of the reaction of hafnium with carbon fibers, Carbon, 2017, 115, 640–648 CrossRef.
- D. Barreda, A. M. Pérez-Mas, A. Silvestre-Albero, M. E. Casco, S. Rudić, C. Herdes, E. A. Müller, C. Blanco, R. Santamaria and J. Silvestre-Albero, Unusual flexibility of mesophase pitch-derived carbon materials: An approach to the synthesis of graphene, Carbon, 2017, 115, 539–545 CrossRef.
- B. Fan, Y. Liu, D. He and J. Bai, Enhanced thermal conductivity for mesophase pitch-based carbon fiber/modified boron nitride/epoxy composites, Polymer, 2017, 122, 71–76 CrossRef.
- M. Liang, S. Liu, W. Fan, X. Xin, H. Luo and B. Xing, Rheological and chemical characterization of deoiled asphalt modified with FCC slurry, Mater. Struct., 2016, 49, 3607–3617 CrossRef.
- W. Fan, Z. Zhai, Y. Yao, G. Nan, M. Liang and H. Luo, Research of effect and mechanism of FCC slurry on the aging resistance of asphalt, J. China Univ. Pet., 2017, 41, 156–163 Search PubMed.
- X. Yang, Q. Zha, Y. Guo and Y. Zhang, Preparation of mesophase pitch carbon foam from FCC slurry oil, China Pet. Process. Petrochem. Technol., 2012, 43, 16–19 Search PubMed.
- S. Kumar and M. Srivastava, Meliorate optical textures and mesophase contents by promising approach of deasphalting of petroleum residues, J. Ind. Eng. Chem., 2017, 48, 133–141 CrossRef.
- S. Gao, B. S. Villacorta, L. Ge, K. Steel, T. E. Rufford and Z. Zhu, Effect of rheological properties of mesophase pitch and coal mixtures on pore development in activated carbon discs with high compressive strength, Fuel Process. Technol., 2018, 219–227 CrossRef.
- I. Mochida, Y. Korai, C. H. Ku, F. Watanabe and Y. Sakai, Chemistry of synthesis, structure, preparation and application of aromatic-derived mesophase pitch, Carbon, 2000, 38, 305–328 CrossRef.
- D. H. Lee, J. Choi, Y. S. Oh and Y. J. Kim, Catalytic hydrogenation-assisted preparation of melt spinnable pitches from petroleum residue for making mesophase pitch based carbon fibers, Carbon Lett., 2017, 24, 28–35 Search PubMed.
- R. Menéndez, M. Granda and J. Bermejo, Relationships between pitch composition and optical texture of cokes, Carbon, 1997, 35, 555–562 CrossRef.
- Y. Korai and I. Mochida, Molecular assembly of mesophase and isotropic pitches at their fused states, Carbon, 1992, 30, 1019–1024 CrossRef.
- S. Shin, J. Jang, S. H. Yoon and I. Mochida, A study on the effect of heat treatment on functional groups of pitch based activated carbon fiber using FTIR, Carbon, 1997, 35, 1739–1743 CrossRef.
- W. Xia, J. Chen, S. Xin, Y. Yao, A. Liu and Y. Dong, The technological conditions of preparation of mesophase pitch by simultaneous hydrogenation-thermal condensation, J. Funct. Biomater., 2012, 43, 367–370+374 Search PubMed.
- M. Miyake, T. Ida, H. Yoshida, S. Wakisaka, M. Nomure and T. Nishizawa, Effects of reductively introduced alkyl groups and hydrogen to mesophase pitch on carbonization properties, Carbon, 1993, 31, 705–714 CrossRef.
- J. Machnikowski, H. Kaczmarska, A. Leszczyńska, P. Rutkowski, M. A. DíEz, R. Álvarez and R. García, Hydrogen-transfer ability of extrographic fractions of coal-tar pitch, Fuel Process. Technol., 2001, 69, 107–126 CrossRef.
- J. Machnikowski, H. Kaczmarska, I. Gerus-Piasecka, M. A. DíEz, R. Alvarez and R. GarcíA, Structural modification of coal-tar pitch fractions during mild oxidation-relevance to carbonization behavior, Carbon, 2002, 40, 1937–1947 CrossRef.
- A. Arami-Niya, T. E. Rufford and Z. Zhu, Activated carbon monoliths with hierarchical pore structure from tar pitch and coal powder for the adsorption of CO2, CH4 and N2, Carbon, 2016, 103, 115–124 CrossRef.
- D. Liu, B. Lou, M. Li, F. Qu, R. Yu, Y. Yang and C. Wu, Study on the preparation of mesophase pitch from modified naphthenic vacuum residue by direct thermal treatment, Energy Fuels, 2016, 30, 4609–4618 CrossRef.
- P. Álvarez, J. Sutil, R. Santamaría, C. Blanco, R. Menéndez and M. Granda, Mesophase from Anthracene Oil-Based Pitches, Energy Fuels, 2008, 22, 4146–4150 CrossRef.
- S. Eser and R. G. Jenkins, Carbonization of petroleum feedstocks I: Relationships between chemical constitution of the feedstocks and mesophase development, Carbon, 1989, 27, 877–887 CrossRef.
- I. C. Lewis, Thermal polymerization of aromatic hydrocarbons, Carbon, 1980, 18, 191–196 CrossRef.
- M. Li, D. Liu, B. Lou, Y. Zhang, S. Yu and J. Ding, Hydroalkylation modification of naphthene-based aromatic-rich fraction and its influences on mesophase development, RSC Adv., 2018, 8, 3750–3759 RSC.
- M. F. Menoufy, H. S. Ahmed, M. A. Betiha and M. A. Sayed, A comparative study on hydrocracking and hydrovisbreaking combination for heavy vacuum residue conversion, Fuel, 2014, 119, 106–110 CrossRef.
- A. N. Sawarkar, A. B. Pandit, S. D. Samant and J. B. Joshi, Petroleum residue upgrading via delayed coking: a review, Can. J. Chem. Eng., 2007, 85, 1–24 CrossRef.
- L. Guo, Hydro-donated hydrovisbreaking of interior vacuum residue, China University of Petroleum, China, 2014 Search PubMed.
- S. Dehkissia, F. Larachi, D. Rodrigue and E. Chornet, Lowering the viscosity of Doba-Chad heavy crude oil for pipeline transportation: the hydrovisbreaking approach, Energy Fuels, 2004, 18, 1156–1168 CrossRef.
- J. M. Hidalgo-Herrador, A. Vráblík, R. Černý, P. Jíša and J. Hamerníková, Effect of waste tires addition on a low-temperature hydrovisbreaking 1 process of vacuum residue, Chem. Pap., 2017, 71, 1–8 CrossRef.
- J. M. Hidalgo-Herrador, A. Vráblík, P. Jíša, R. Černý and J. Hamerníková, Hydrovisbreaking of vacuum residue from russian export blend: influence of brown coal, light cycle oil, or naphtha addition, Chem. Pap., 2015, 69, 1075–1083 Search PubMed.
- M. Li, Y. Zhang, S. Yu, J. Ding, B. Bian and D. Liu, Effects of in-process hydrogenation on mesophase development during the thermal condensation of petroleum aromatic-rich fraction, Energy Fuels, 2018, 32, 5659–5663 CrossRef.
- H. Li, W. Yan and H. Zheng, Determination of molecular weight in petroleum products by VPO method, Chemical Engineer, 2011, 195, 29–30 Search PubMed.
- M. Li, D. Liu, R. Lv, J. Ye and H. Du, Preparation of the mesophase pitch by hydrocracking tail oil from a naphthenic vacuum residue, Energy Fuels, 2015, 29, 4193–4200 CrossRef.
- X. Cheng, Modified Characteristics of Mesophase Pitch by Co-carbonization with Waste Polystyrene, China University of Petroleum, China, 2009 Search PubMed.
- W. Liang, G. Que, C. Liu and Q. Yang, Petroleum Chemistry, China University of Petroleum Press, China, 2009, pp. 58–78, 304–310 Search PubMed.
- X. Cheng, Q. Zha, X. Li and X. Yang, Modified characteristics of mesophase pitch prepared from coal tar pitch by adding waste polystyrene, Fuel Process. Technol., 2008, 89, 1436–1441 CrossRef.
Footnote |
| † These authors contributed equally to this work. |
| This journal is © The Royal Society of Chemistry 2018 |