
 Open Access Article
 This Open Access Article is licensed under a Creative Commons Attribution-Non Commercial 3.0 Unported Licence
Capacity detection of electric vehicle lithium-ion batteries based on X-ray computed tomography
Lifu Li and
Junwei Hou *
*
School of Mechanical and Automotive Engineering, South China University of Technology, Guangzhou 510640, China. E-mail: junweihou@foxmail.com
First published on 16th July 2018
Abstract
It is difficult to use conventional capacity detection methods to determine nondestructively and rapidly the capacity of lithium-ion (Li-ion) batteries used in electric vehicles. To resolve this problem, lithium iron phosphate (LFP) batteries are regarded as research objects for studying the relationship between their electrochemical performances and the structural parameters of their active materials based on Faraday's law. Therefore, a capacity detection method based on X-ray computed tomography is proposed; it combines the battery's electrochemical performance testing techniques and tomographic measurement techniques to measure the electrochemical properties and structural parameters of active materials of Li-ion batteries. The results show that (1) the capacity of a Li-ion battery is a function of the structural parameters of active materials and working condition; (2) the influence of the working condition on the capacity gradually changes with the change in the structural parameters of the active material; and (3) the loss of strong active materials of a Li-ion battery in the negative cross-section is more than that in the positive cross-section when the capacity decays. Owing to its advantages of being nondestructive and rapid, this method is superior compared with conventional methods.
1. Introduction
For electric vehicles, lithium-ion (Li-ion) batteries are the leading candidates1–3 mainly due to their characteristics of high energy, high power density, wide temperature range, good lifecycle performance, and low self-discharge rate;4–9 these represent the main requirements in the design of electric vehicles10 that are characterized by high performance in terms of acceleration and driving range.11 As an important parameter of Li-ion batteries, capacity is an essential indicator for calculating both the state of health and the remaining electric driving range,12 which directly affect the consistency of batteries inside the battery pack and the performance of electric vehicles. Therefore, accurately determining the capacity can ensure efficient operation and optimized performances of Li-ion batteries; it is of great significance for the application, design, and manufacturing process of Li-ion batteries.Nowadays, the most common way to determine the battery capacity is to perform a discharge test until the cut-off voltage is reached following the manufacturer's specifications; this test relies on lifecycle testing using a defined procedure and protocol such as those proposed by the U.S. Advanced Battery Consortium (USABC) Electric Vehicle Battery Test Procedures Manual13 and Chinese Automobile Standard QC/T 743-2006.14 The capacity (denoted as Q = ∑iκtκ) of a Li-ion battery is obtained by measuring the constant discharge current (denoted as iκ) and discharge time (denoted as tκ) under the lifecycle testing procedure. In this test, the operating voltage of the Li-ion battery is assumed to be the threshold. However, the capacity of a Li-ion battery for electric vehicles is difficult to determine using battery management systems, especially in the common Li-ion chemistry, where lithium iron phosphate (LFP) exhibits an extremely flat reaction plateau. The minimal changes in voltage over a cycle complicate the determination of capacity.15 As a result, it is difficult to study the gradual change in the capacity of a Li-ion battery as its working condition changes. In addition, these standardized procedures require a lot of time, and their results only represent the capacity of the Li-ion battery in controlled environments. Therefore, these results are not useful to provide sufficient knowledge regarding the capacities of Li-ion batteries in practical applications.16 Besides, these standardized procedures change the state of the Li-ion battery, which leads to an increase in the cycle number and an increase in capacity decay.
Furthermore, to determine battery capacity, several groups have attempted to utilize empirical aging models, which are based on mathematical functions obtained from extended aging tests.17–19 Although the empirical modeling approaches have been used in many applications, the significant drawback of these approaches is that they need to identify the model and its parameters; for example, numerous time-consuming durability tests are required. In addition, some researchers estimate the battery capacity via analyzing the characteristics of the voltage curve. Two techniques, i.e., incremental capacity analysis (ICA)20,21 and differential voltage analysis (DVA)22,23 are adopted to analyze the differentiation of charge throughput over the terminal voltage (dQ/dV) and vice versa (dV/dQ). The peaks of ICA and DVA curves are associated with the chemical properties of the electrodes, which can be used to identify the capacity and its fade. However, the limitation for applying these methods is the prerequisite that a low constant current phase must exist where one dV/dQ peak is detected, and the peak change must be significant during the lifetime for battery chemistry. Differentiating measurements amplify the noise in the signal, due to which it very difficult to use the resulting data for processing, which is especially problematic in practical applications. Meanwhile, researchers have developed a variety of models and control techniques for capacity estimation. The model-based approaches, which can be divided into electrical model-based24,25 and electrochemical model-based approaches,26,27 can explain the aging mechanism of Li-ion batteries profoundly and in detail. However, the complexity of model implementation and parameterization of the physico-chemical process are the major obstacles in their real-life applications. In addition, all these methods require complex signal analyses specific to the battery chemistry or configuration, which can be time-consuming; these methods also lack visual confirmation.
X-ray computed tomography (CT) is a non-destructive tool used to visually inspect and quantitatively analyze the structural properties of materials, which are important with regard to Li-ion batteries not only for performance monitoring, but also for manufacturer quality control. This technique has been utilized for the characterizations of composites and electrodes of batteries,28–30 and it is an effective diagnostic tool for Li-ion batteries.15,31 Furthermore, the technique has been used to observe catastrophic battery failure or thermal runaway initiated by battery heating tests.32,33 Herein, we utilize X-ray CT for the first time to detect the capacity of a Li-ion battery under different working conditions.
Herein, we analyze the relationship between the electrochemical performances and the structural parameters of the active materials of Li-ion batteries based on Faraday's law, which reflects the relationship between the capacity and the mass of active materials of a battery. By virtue of the X-ray CT technology, we propose a method to detect the capacity of Li-ion batteries. This method combines the battery's electrochemical performance testing techniques and the tomographic measurement techniques to measure the electrochemical properties and structural parameters of the active materials of a Li-ion battery. By analyzing the relationship between the structural parameters, i.e., quantity and distribution of strong active materials, the working conditions, i.e., cycle, discharge current, depth-of-discharge, and temperature as well as the actual capacity of a Li-ion battery can be obtained.
2. Theory and methods
2.1 The detection theory
According to the electrochemical principle,34 a Li-ion battery undergoes an electrochemical oxidation–reduction reaction during charging and discharging periods. This type of reaction involves the transfer of electrons from one type of a material to another. For the Li-ion battery system, the theoretical capacity Q can be determined by Faraday's law.35
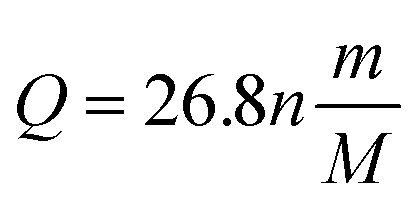 | (1) |
Li-ion batteries comprise cells that employ lithium intercalation compounds as the positive and negative materials.34,36 Thus, a Li-ion battery should comprise L cells that are numbered i, where i = 1, 2,…, L. A cell consists of a positive and negative electrode separated by a microporous separator with a thickness ranging from 16 μm to 25 μm. Positive electrodes consist of an Al foil (10–25 μm) coated with the active material. Negative electrodes typically include a Cu foil (10–20 μm) coated with an active carbonaceous material. When the active material of the j electrode (“P” denotes positive and “N” denotes negative) is uniformly coated on thin metal foils, the mass, mi,j, of the active material is expressed as follows:
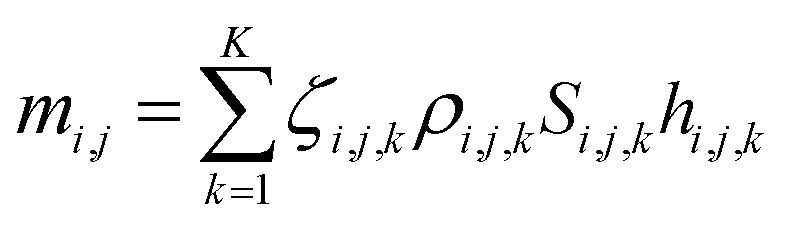 | (2) |
According to the values of the activity coefficients, the active materials can be divided into two classes, i.e., strong active materials and weak active materials. The densities of the strong active materials and weak active materials are ρi,j,1, ρi,j,2,…, ρi,j,ε and ρi,j,ε+1, ρi,j,ε+2,…, ρi,j,k, respectively. Therefore, eqn (2) needs to be modified as
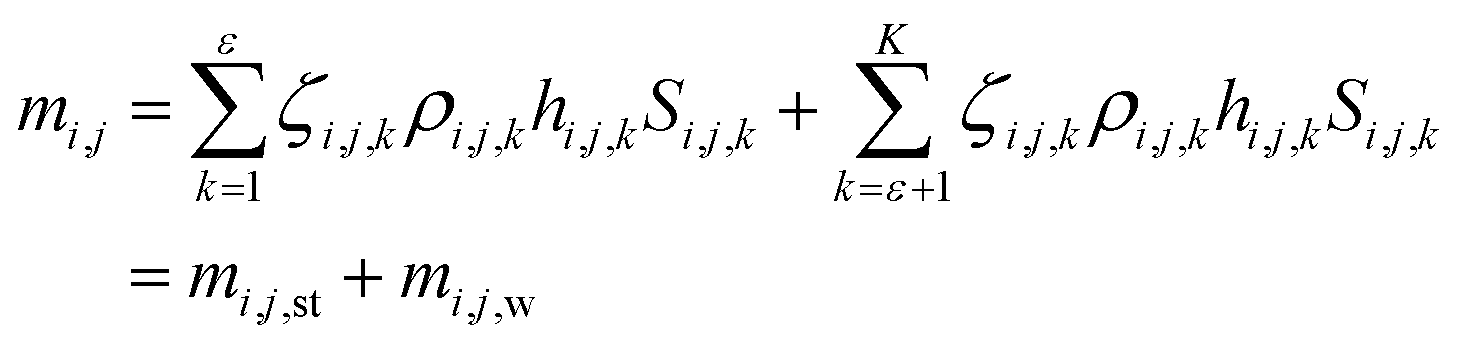 | (3) |
 | (4) |
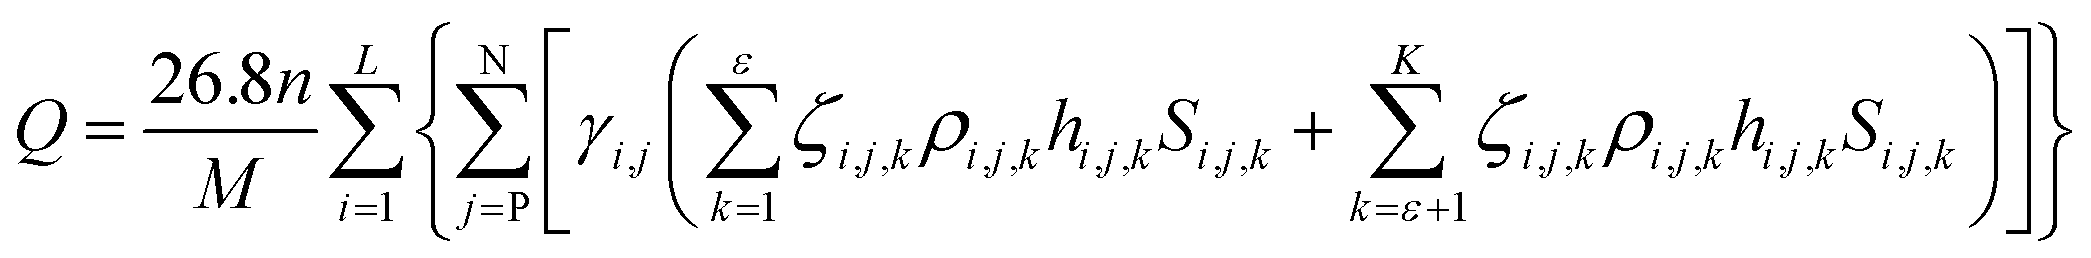
Again, as noted previously, the conventional capacity detection method cannot correctly determine the actual capacity of the Li-ion battery as the influence of the structural parameters of the active material on the capacity is ignored.
2.2 The detection method
According to the principle of image and morphology,37,38 a digital image can be used as a representation of an object, which reflects its geometry and properties. Therefore, in the matrix or pixel list representation of the active material of a Li-ion battery, the analysis of the location and number of pixels can be used to identify the structural characteristics of the active materials and obtain their structural parameters.To obtain the structural parameters of active materials that are nondestructively sealed in a confined space in real time, a method is proposed to detect the capacity of a Li-ion battery by tomographic imaging based on the principle of X-ray CT. This method is referred to as the tomographic image detection method for battery capacity, and the schematic representation of the method principle is shown in Fig. 1.
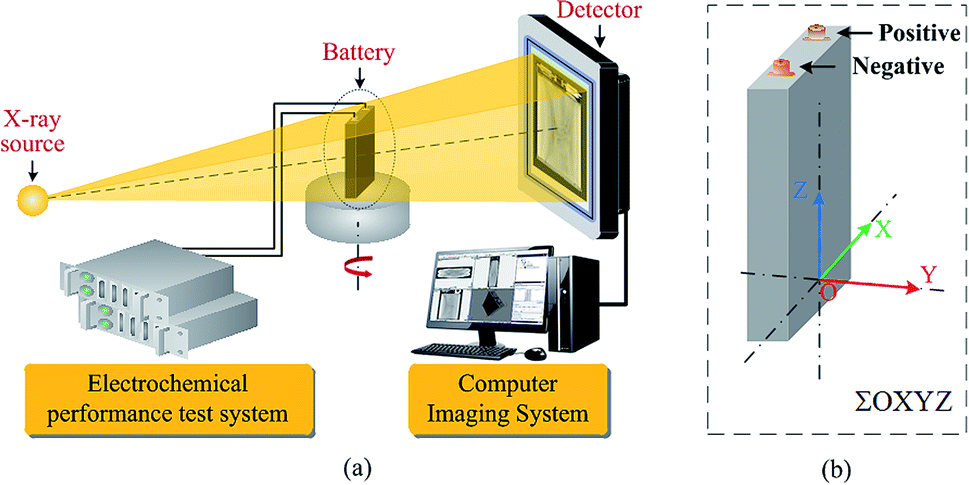 | ||
| Fig. 1 (a) Schematic representation of the tomographic image detection method for battery capacity. (b) The coordinate system for battery. | ||
When an X-ray beam passes through the active materials of a Li-ion battery that has been charged and discharged by an electrochemical performance system, as shown in Fig. 1, there are three dominant physical processes responsible for the attenuation of the X-ray signal: photoelectric absorption, Compton scattering, and pair production.39 The basic equation for attenuation of a monoenergetic beam through a homogeneous material is expressed by Lambert–Beer's law:40
I = I0![[thin space (1/6-em)]](https://www.rsc.org/images/entities/char_2009.gif) exp(−μL) exp(−μL)
| (5) |
 | (6) |
 | (7) |
When the outgoing X-ray beam carrying the morphological information of the active materials of a Li-ion battery penetrates the battery and reaches the detectors, the detectors measure the intensity of the beam as it arrives at the screen and sends the results as a digital signal to the computer imaging system. After preprocessing (data conditioning and calibration), image reconstruction, and post-processing (artifact reduction, image filtering, and image reformation), a three-dimensional image of the Li-ion battery can be obtained,41 as shown in Fig. 2(a); it is composed of a sequence of tomographic cross-sectional images, as shown in Fig. 2(b), which are referred to as the tomographic images. The tomographic images are denoted as E(x,y,z), where x ∈ R, y ∈ R, and z ∈ R are the coordinate values in the coordinate system, as shown in Fig. 1.
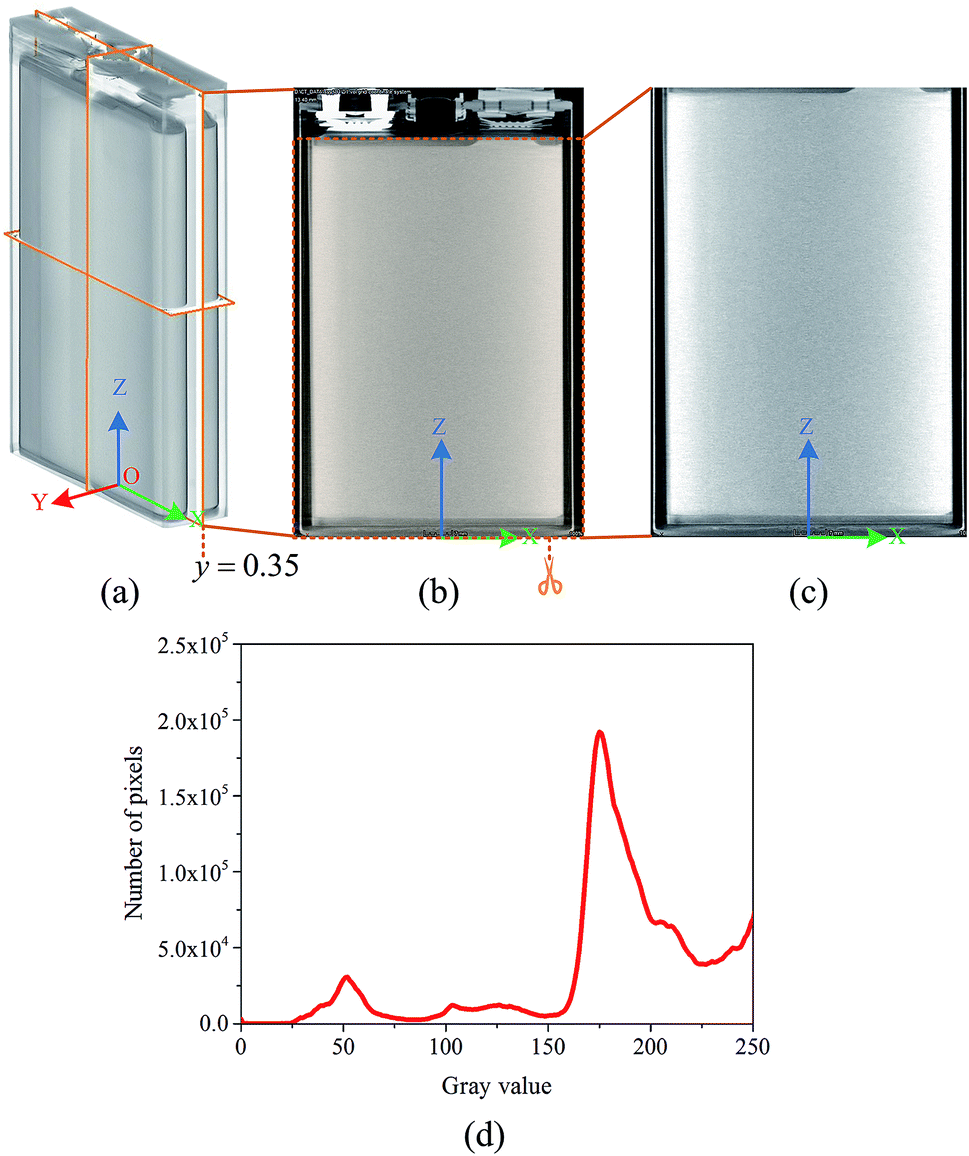 | ||
| Fig. 2 (a) The three-dimensional image of a Li-ion battery. (b) Tomographic image E(x,y,z), where y = 0.35 mm. (c) Cell image G(x,y,z), where y = 0.35 mm. (d) The relation between gray value and the number of pixels in G(x,y,z). | ||
Then, the tomographic images are processed to obtain the cell images, which are denoted as G(x,y,z), as shown in Fig. 2(c). According to eqn (5) and (6), the density of the strong active material is a function of the attenuation coefficient, and the attenuation coefficient is usually represented as the gray value in X-ray CT.40 By analyzing the gray value and the distribution of pixels in the cell images, as shown in Fig. 2(d), both positive cross-sectional images and negative cross-sectional images are obtained, which are denoted as G(x,yPi,z)P and G(x,yNi,z)N, respectively, where i = 1, 2,…, L. According to the gray value of the pixels, the number of pixels of the strong active material in both the positive cross-sectional images and negative cross-sectional images is counted; they are denoted as S(x,yPi,z)P and S(x,yNi,z)N, respectively. Then, the density of the strong active material is calculated by its gray value in the cross-sectional images, and the area of the strong active material is calculated by the number of pixels; the height of the strong active material is calculated by the distribution of the pixels in the immediate neighbouring cross-sectional images. Finally, the capacity of the Li-ion battery can be calculated by using eqn (4).
Similarly, when the working condition of a Li-ion battery is denoted as φκ, its capacity, Q(φκ), can be obtained by virtue of the tomographic image detection method for battery capacity. The working condition consists of the cycle number, temperature, discharge current, and depth-of-discharge (DOD) of the Li-ion battery, which can be expressed as follows:
| φκ = {nκ,Tκ,iκ,DODκ} | (8) |
3. Experimental
3.1 Materials and equipment
To verify the feasibility of the tomographic image detection method for battery capacity, a tomographic image detection system for battery capacity is designed and developed, and it consists of the electrochemical performance subsystem and tomographic imaging subsystem, as shown in Fig. 1. The electrochemical performance data of the batteries were obtained by the electrochemical performance subsystem (HT-V5C100D100-16, Kinte Industrial Inc., Guangzhou, China). The subsystem had a voltage measurement range from 0 V to 5 V; the currents ranged from 0.1 A to 100 A, and the measuring accuracy was ±(0.1% FS + 0.1% RD). Tomographic imaging experiments were carried out by the tomographic imaging subsystem (Phoenix NDT|analyzer, GE Inspection Technologies, Hürth, Germany). This machine was equipped with a high-power X-ray micro-focus tube (180–225 kV and 200–250 μA) with a spatial resolution of 1 μm and density resolution of 0.5%.3.2 Electrochemical experiment
Four 10 A h commercial LFP-based Li-ion batteries with thickness of ∼17 mm, width of ∼67 mm, and length of ∼107 mm, were denoted as “battery L1,” “battery L2,” “battery L3,” and “battery L4,” and they were used in this study. These batteries selected from the same batch were collectively referred to as the investigated batteries. The standard deviation between the initial capacities of the four investigated batteries was less than 0.88%.First, the investigated batteries were subjected to the lifecycle tests that were derived from the USABC Electric Vehicle Battery Test Procedures Manual by using the electrochemical performance subsystem. The regimen used in the lifecycle tests began with a charge regime that used a constant current (CC) at C/2 step to 3.65 V, followed by a constant voltage (CV) step at 3.65 V until the termination current of C/50 was reached, following the manufacturer's specification; this was followed by a 1/2 hour rest and then a 3C discharge regime to assess the capacity of the investigated batteries. The discharge cutoff voltage was 2.5 V, following the manufacturer's specification. In the lifecycle tests, battery L1, battery L2, battery L3, and battery L4 were subjected to 2 cycles at 100% DOD, 120 cycles at 100% DOD, 164 cycles at 100% DOD, and 59 cycles at 100% DOD of C/2 charge and 3C discharge regime, respectively; the temperatures at which the investigated batteries were discharged were 25 °C, 55 °C, 25 °C, and 55 °C, respectively. Therefore, the working conditions of the investigated batteries after being cycled were φ1, φ2, φ3, and φ4, and they can be expressed as follows:
| φ1 = {2, 25, 3C, 100%} | (9) |
| φ2 = {120, 55, 3C, 100%} | (10) |
| φ3 = {164, 25, 3C, 100%} | (11) |
| φ4 = {59, 55, 3C, 100%} | (12) |
After the lifecycle test, the investigated batteries were characterized by a reference performance test (RPT) to determine their actual capacities. The regimen used in the RPT began with a CC–CV charge regime, followed by 1 hour of rest, and then a C/2 discharge regime to assess the actual capacity of the investigated battery. The actual capacities of the investigated batteries were denoted as Q′(φκ), where φκ is the working condition and subscript κ = 1, 2, 3, 4.
3.3 Tomographic imaging experiment
After the RPT test, the investigated batteries having working conditions φκ, where κ = 1, 2, 3, 4, were subjected to tomographic imaging experiments by using the tomographic imaging subsystem. For all the investigated batteries, the scanning parameters were as follows: the X-ray source was operated at a voltage of 200 kV and a current of 200 μA with the rotational speed of the turntable set at 4.518 × 10⁻³ rad s−1 and the imaging frequency of 3 Hz (333 ms). The X-ray CT technique completely reconstructed the three-dimensional images of all the investigated batteries. The three-dimensional image of an investigated battery was composed of 180 tomographic images E(x,y,z)φκ, where y ∈ [−8.4,8.4] and κ = 1, 2, 3, 4. The tomographic images E(x,y,z)φκ were cropped into the cell images G(x,y,z)φκ for obtaining the structural parameters of the active materials. The positive cross-sectional images and the negative cross-sectional images
  were obtained, where i = 1, 2,…, I and i′ = 1, 2,…, I′.
In this paper, all these images were analyzed by using the open-source Fiji/ImageJ software, which is a public domain Java image processing program.42
4. Results and discussion
4.1 Electrochemical characterization
Fig. 3(a) presents the evolution of the capacities of the investigated batteries over the 3C cycle discharge regime. Fig. 3(a) shows that discharge occurs at the same current drain but at a progressively increasing cycle number for battery L2 and battery L3, although the temperatures of battery L2 and battery L3 are different. At 55 °C, at the 3C rate and after 120 cycles, battery L2 delivers 10.417 A h, which is 95.49% of its initial capacity. For comparison, we can observe that battery L3 cycled at the 3C rate at 25 °C delivers 10.339 A h after 168 cycles, which is 94.77% of its initial capacity. Battery L2 and battery L3 exhibit decays of 4.51% and 5.23% from their initial capacities, respectively. This shows that the working condition of the investigated battery has a pronounced effect on its capacity characteristic. With the increase in the number of cycles of the investigated battery, the actual capacity decays.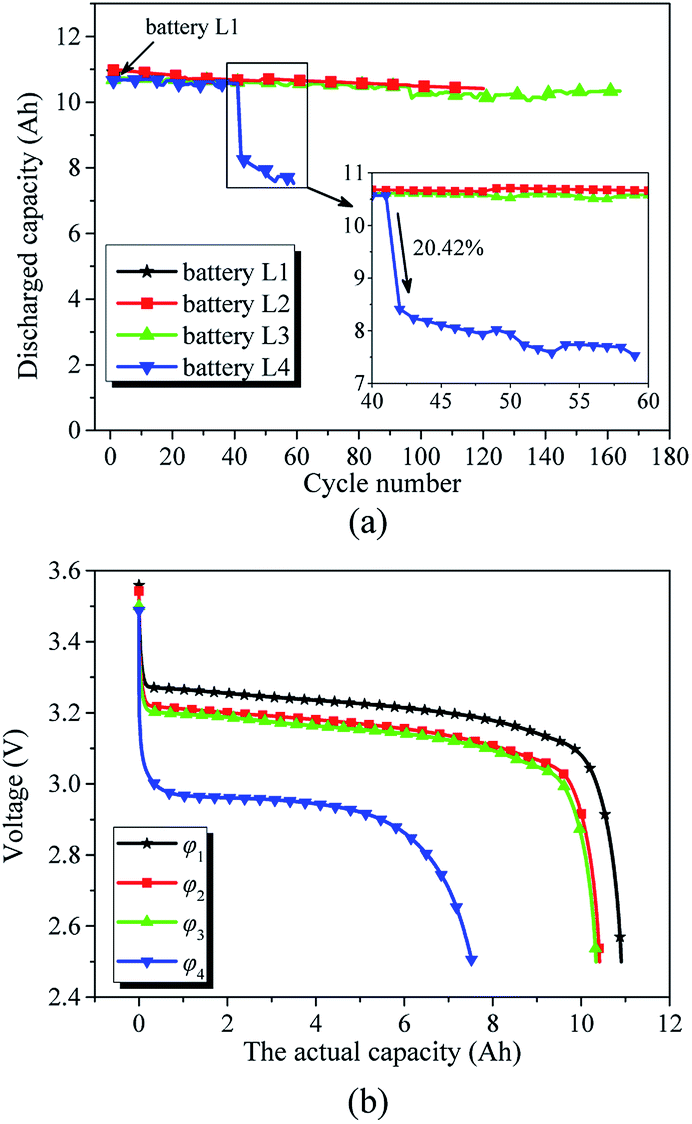 | ||
| Fig. 3 (a) Evolution of the discharge capacity versus cycle number. (b) Discharge profiles of investigated batteries having working conditions φκ, where κ = 1, 2, 3, 4. | ||
However, battery L4 cycled at the 3C rate at 55 °C delivered 7.53 A h after 59 cycles, i.e., battery L4 decayed 30.97% from its initial capacity. Furthermore, at the 42nd cycle, the discharge capacity of battery L4 decayed 20.42% of that at the 41st cycle. According to eqn (1), we believe that the reason for this substantial decrease in the capacity of battery L4 at the 42nd cycle was the loss of its active materials. The conventional capacity detection method, which only considers the influence of the working condition on the actual capacity, cannot accurately determine the actual capacity of the 42nd cycle of battery L4 through the capacities of previous 41 cycles.
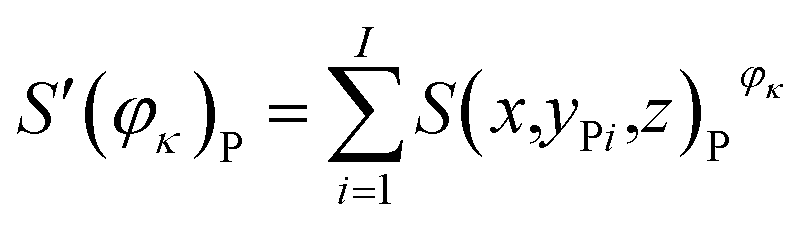
Fig. 3(b) displays the discharge curves of the investigated batteries having working conditions φκ, where κ = 1, 2, 3, 4. We assumed that φ1 is the initial condition of the investigated batteries. In condition φ1, both the actual capacity and structural parameters of the active materials of the investigated battery are at the initial states. Therefore, we can infer that the actual capacity, Q′(φκ), of the investigated battery decreases with an increase in κ of the working condition φκ, i.e., Q′(φ1), Q′(φ2), Q′(φ3), and Q′(φ4) gradually decrease.
The cycle number of condition φ2 is smaller than that of condition φ3, and the temperature of condition φ2 is higher than that of condition φ3; furthermore, the actual capacity Q′(φ2) is higher than Q′(φ3). It is shown that the actual capacity is the result of the interaction of various factors in the working condition.43 In addition, the cycle number of condition φ2 is larger than that of condition φ4, the temperature of condition φ2 is equal to that of condition φ4, and the actual capacity Q′(φ2) is higher that Q′(φ4). According to the ageing mechanisms in Li-ion batteries,18 capacity decay is strongly affected by the cycle number and temperature, and the material parameters have an impact on the battery lifetime and performance.43 It is shown that the working condition, which consists of cycle number, temperature, discharge current, and DOD, is not the only factor that affects the actual capacity of the investigated battery.
4.2 Structural characterization
Fig. 4 presents the working condition versus the actual capacity and the number of pixels of strong active materials in the positive and negative cross-sectional images of the investigated batteries. The numbers of pixels of strong active materials in the positive and negative cross-sectional images are denoted as S′(φκ)N and S′(φκ)P, respectively. The sum of the number of pixels of strong active materials in both the positive and negative cross-sectional images is denoted as S(φκ). S′(φκ)N, S′(φκ)P, and S(φκ) are expressed as follows:
 | (13) |
 | (14) |
| S(φκ) = S′(φκ)N + S′(φκ)P | (15) |
 is the number of pixels of strong active materials in the positive cross-sectional image
  , where i = 1, 2,…, I, and
  is the number of pixels of strong active materials in the negative cross-sectional image
  , where i′ = 1, 2,…, I′.
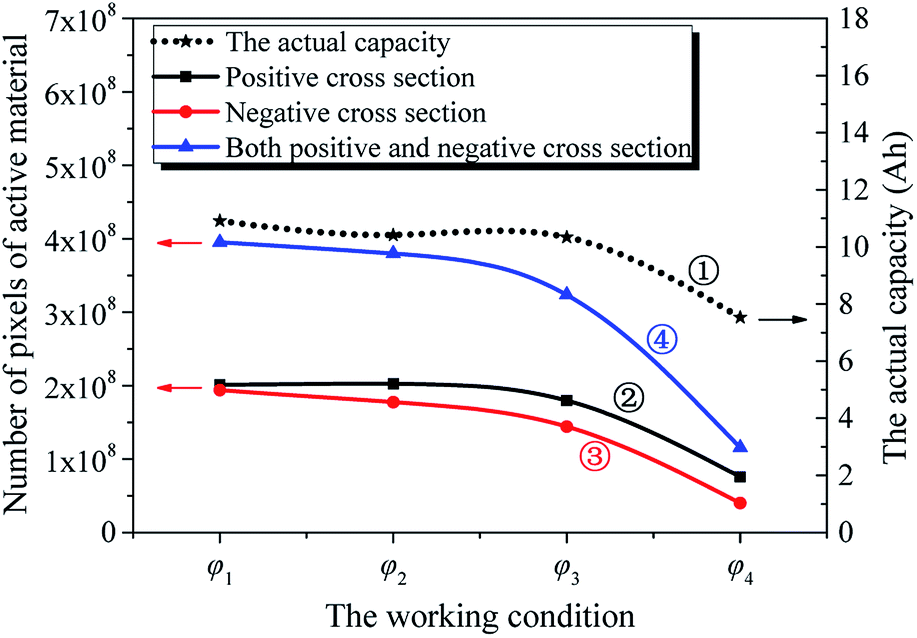 | ||
| Fig. 4 Effects of the working condition on the actual capacity Q′(φκ) (curve ①), the number of pixels, S′(φκ)P, of strong active materials in the positive cross-sectional images (curve ②), the number of pixels, S′(φκ)N, of strong active materials in the negative cross-sectional images (curve ③), and the sum of S′(φκ)P and S′(φκ)N (curve ④). | ||
As shown in Fig. 4, with the increase in κ of the working condition φκ of the investigated batteries, S′(φκ)N, S′(φκ)P, and S(φκ) gradually decrease, and the S′(φκ)N and S′(φκ)P curves are similar. At the same time, the actual capacity of the investigated battery gradually decreases. This shows that the trends of S′(φκ)N, S′(φκ)P, and S(φκ) and that of the actual capacity decrease with a change in the working condition of the investigated battery. Furthermore, it is shown that the actual capacity decay is accompanied by a change in the structural parameters of the active materials of the electrodes of the battery upon cycling.44
We can derive that the actual capacity of a Li-ion battery is determined not only by its working condition, i.e., cycle number, temperature, discharge current, and DOD, but also by its structural parameters, i.e., the number of pixels of strong active material in the positive and negative cross-sectional images. We assumed S(φκ) as the structural parameter of the investigated battery, and its actual capacity Q′(φκ) can be expressed as follows:
| Q′(φκ) = Qfull − [1 + λS(φκ)]QfullQloss(φκ) | (16) |
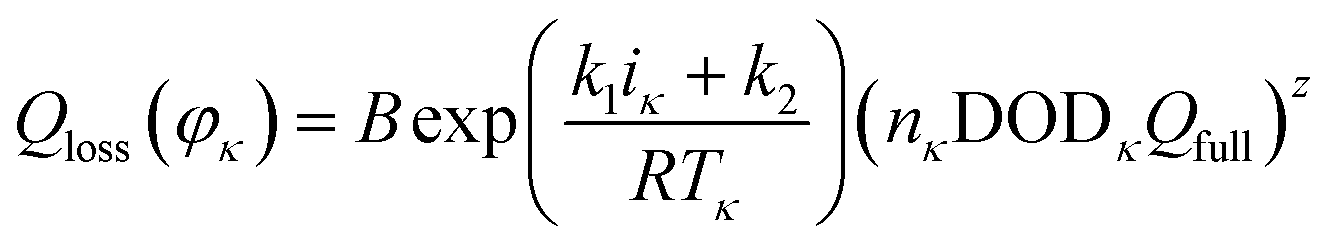 | (17) |
From eqn (9)–(12), we can obtain the following equations:
| i1 = i2 = i3 = i4 | (18) |
| DOD1 = DOD2 = DOD3 = DOD4 | (19) |
| Qfull = Q′(φ1) | (20) |
By substituting eqn (17)–(20) in (16), the actual capacity of the investigated battery may be rewritten as
 | (21) |
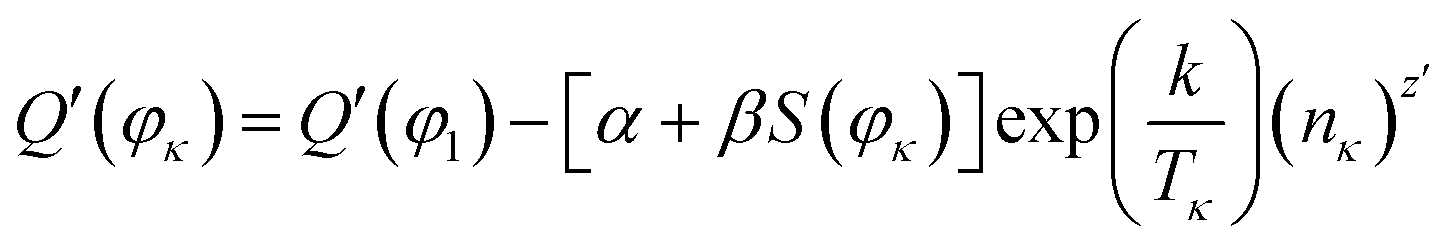
According to the system identification method and the least squares method,45,46 we use the MATLAB/Simulink software and values of Q′(φκ), S(φκ) (Fig. 4), Tκ, and nκ to identify the parameters, i.e., α, β, k, and z′ of eqn (21), and the expression for Q′(φκ) is as follows:
 | (22) |
As shown in eqn (22), the actual capacity is a function of S(φκ), temperature, and cycle number of the investigated batteries. Therefore, the value of the actual capacity of the investigated battery can be determined by measuring the number of pixels of strong active materials in its positive and negative cross-sectional images and by combining its working condition and eqn (22).
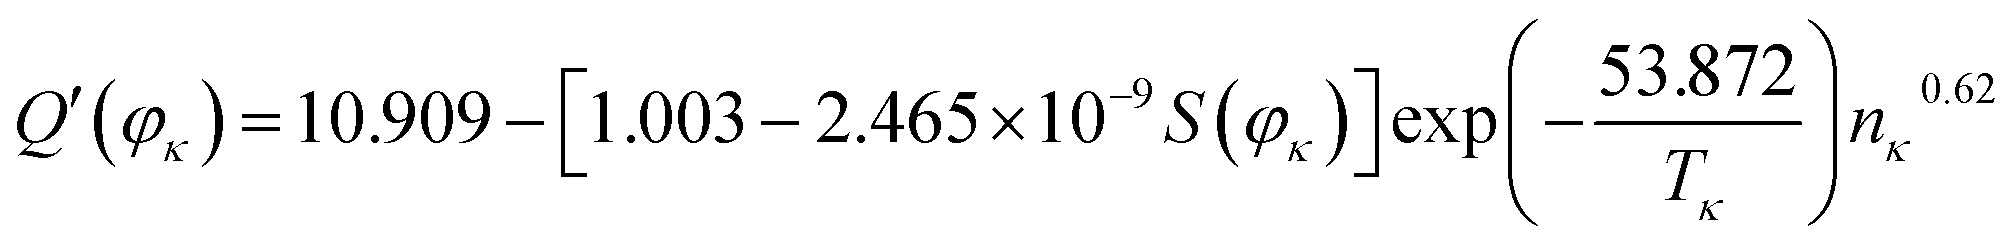
In accordance with eqn (22), the simulation of the actual capacity versus S(φκ), Tκ, and nκ of the investigated batteries is shown in Fig. 5.
 | ||
| Fig. 5 (a) Simulation of actual capacity versus cycle number and temperature in multiple structural parameters of S(φ1), S(φ2), S(φ3), and S(φ4). (b) Simulation of actual capacity versus cycle number at multiple temperatures of 25 °C, 35 °C, 45 °C, and 55 °C in the structural parameter of S(φ1). (c) Simulation of actual capacity versus cycle number in multiple structural parameters of S(φ1), S(φ2), S(φ3), and S(φ4) at 25 °C. | ||
As shown in Fig. 5(a), the actual capacity of the investigated battery with structural parameter S(φκ) changes as the working condition changes. As both the cycle number and temperature increase, the actual capacity of the investigated battery decreases.
Fig. 5(b) shows the effect of cycle number and temperature on the actual capacity of the investigated batteries. At ambient temperature (curve ①), as shown by the slope of the curves, the actual capacity is approximately a linear function of the cycle number. With the increasing temperature (curves ②–④), the actual capacity decreases, the slope of the curve becomes more pronounced, and the loss of actual capacity for unit cycle number increases. This explains the influence of the cycle number on the actual capacity, which gradually increases with the increasing temperature when the structural parameter of the active materials is constant.
Fig. 5(c) shows the effects of cycle number and structural parameters of the active materials on the actual capacity of the investigated batteries at ambient temperatures. With the increase in the structural parameter (curves ⑤–⑦), the actual capacity decreases, the curve becomes steeper, and the loss of actual capacity for unit cycle number increases. This explains the influence of cycle number on the actual capacity, which gradually increases with the increase in the structural parameter of the active materials when the temperature is constant. In other words, the influence of the working condition on the actual capacity of the investigated battery changes as the structural parameter of the active materials changes.
In addition, as shown in Fig. 5(a), when the working condition of the investigated battery is determined, the actual capacity decreases as the sum of the number of pixels of the strong active materials in both the positive and negative cross-sectional images decreases.
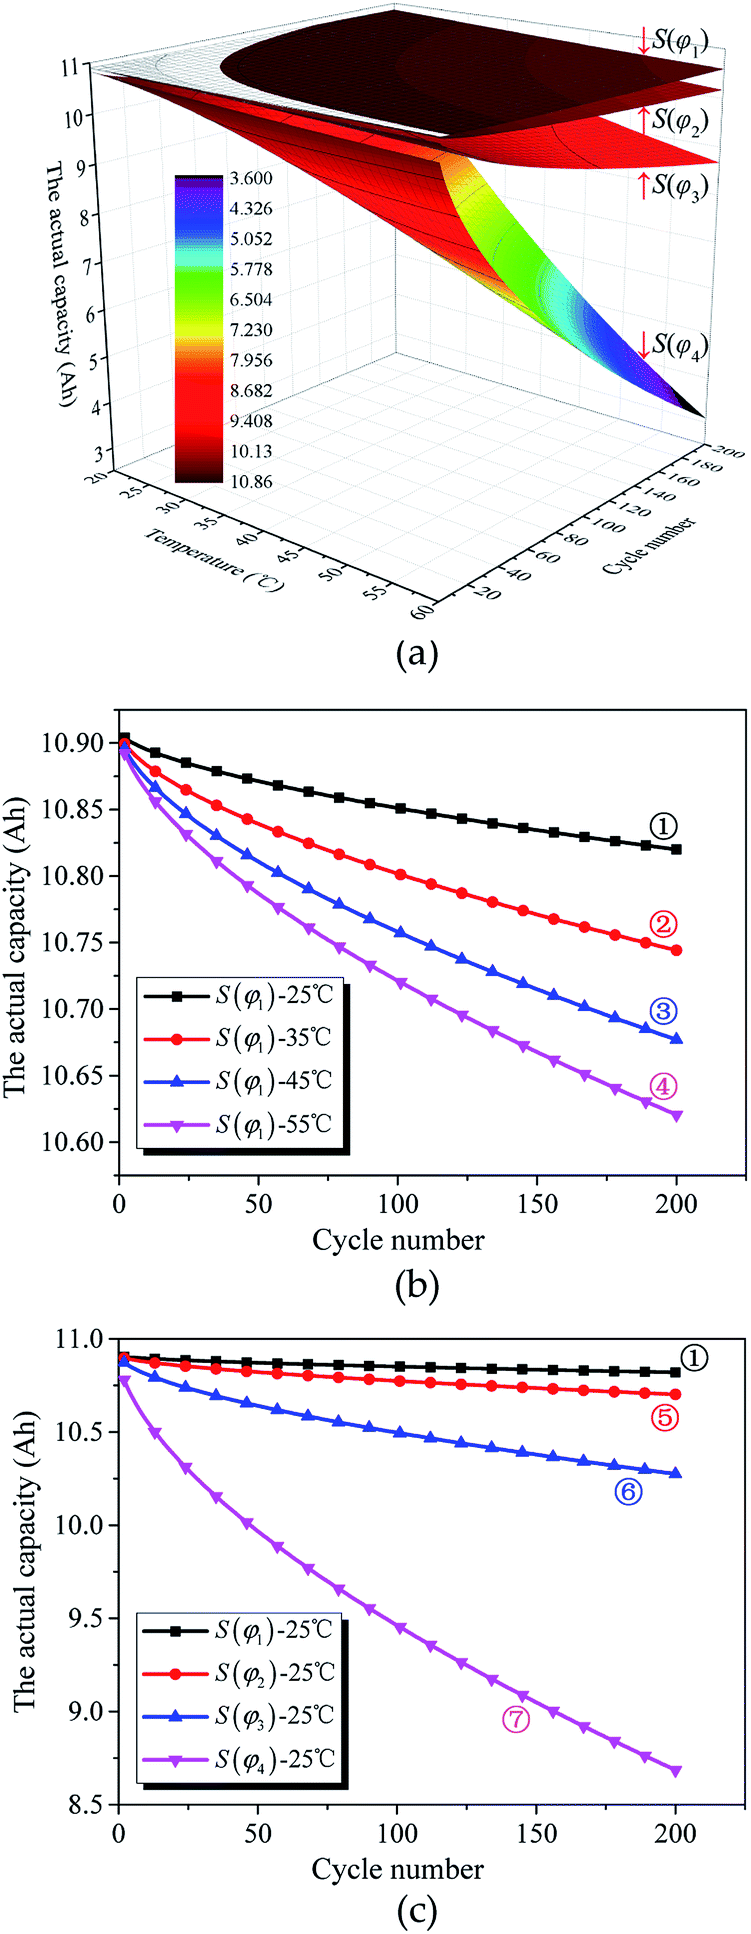
As noted previously, the actual capacity of the investigated battery is related to its structural parameter and working condition. Fig. 6(a)–(c) show the structural characteristics of strong active materials of the investigated battery in its negative cross-sectional images  , where yN1 = 7.14 mm and κ = 1, 2, 3, 4.
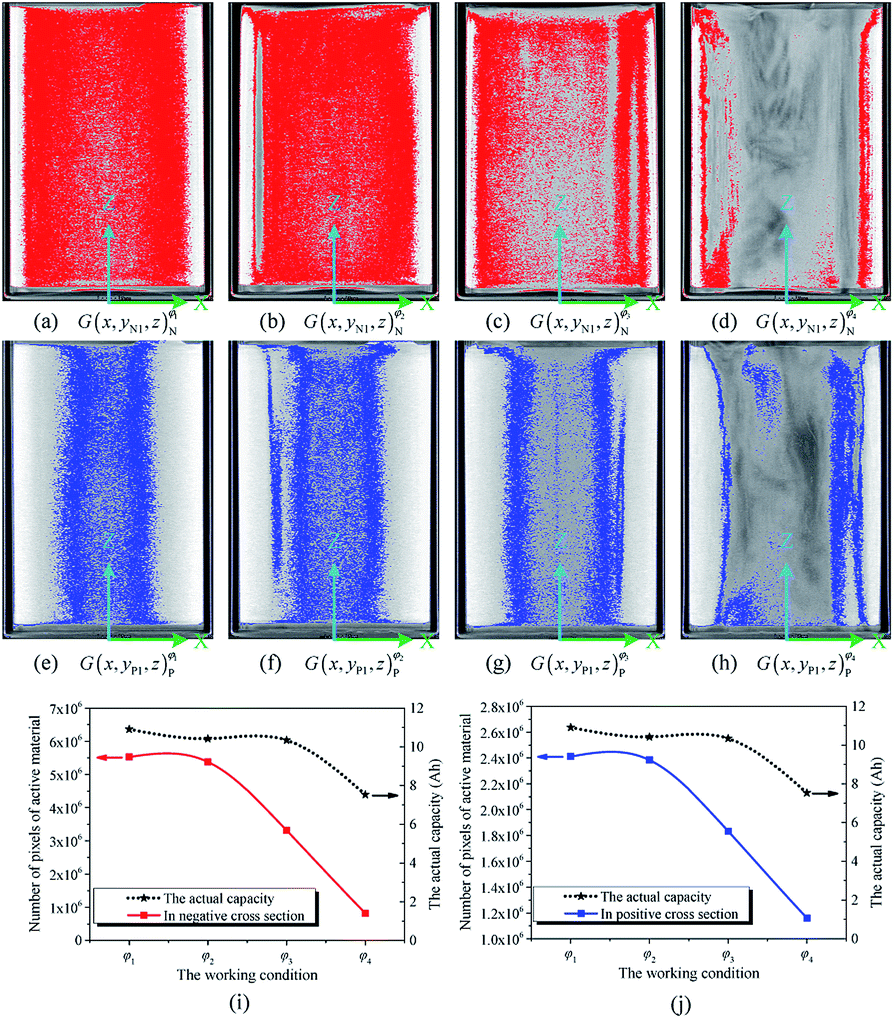 | ||
Fig. 6 (a)–(d) Structural characteristics of strong active materials in the negative cross-sectional images  , where yN1 = 7.14 mm and κ = 1, 2, 3, 4. (c)–(h) Structural characteristics of strong active materials in the positive cross-sectional images , where yN1 = 7.14 mm and κ = 1, 2, 3, 4. (c)–(h) Structural characteristics of strong active materials in the positive cross-sectional images  , where yP1 = 0.82 mm and κ = 1, 2, 3, 4. (i) Effect of working condition on the number of pixels of strong active materials in , where yP1 = 0.82 mm and κ = 1, 2, 3, 4. (i) Effect of working condition on the number of pixels of strong active materials in  . (j) Effect of working condition on the number of pixels of strong active materials in . (j) Effect of working condition on the number of pixels of strong active materials in  . . | ||
The red pixels represent strong active materials in the negative cross-sectional images. As the working condition of the investigated battery changes, its actual capacity gradually decreases, and the number of red pixels also gradually decreases, as shown in Fig. 6(i).
Similarly, Fig. 6(e)–(h) show the structural characteristics of strong active materials of the investigated battery in its positive cross-sectional images  , where yP1 = 0.82 mm and κ = 1, 2, 3, 4. The blue pixels represent strong active materials in the positive cross-sectional images. Compared with the number of red pixels, the number of blue pixels also decreases with the decrease in actual capacity, as shown in Fig. 6(j). This indicates that the amounts of strong active materials in both the negative and positive cross-sections of the investigated battery gradually decrease with the decrease in its actual capacity.
As shown in Fig. 6(i) and (j), when the actual capacity of the investigated battery decays, the reduction rate of the number of pixels of strong active materials in the negative cross-sectional images is larger than that of the number of pixels of strong active materials in the positive cross-sectional images. This indicates that the loss of negative electrode is the main reason for battery capacity decay; this result is consistent with previously reported results.47,48
In addition, the pixels of strong active materials are unevenly distributed in both the negative and positive cross-sectional images, as shown in Fig. 6. Fig. 7(a) and (b) show the distribution of the number of pixels of strong active materials along the X axis in the negative cross-sectional images  and that in the positive cross-sectional images
  , respectively.
 | ||
Fig. 7 Distribution of the number of pixels of strong active materials (a) in the negative cross-sectional images  and (b) in the positive cross-sectional images and (b) in the positive cross-sectional images  , where yN1 = 7.14 mm, yP1 = 0.82 mm, and κ = 1, 2, 3, 4. , where yN1 = 7.14 mm, yP1 = 0.82 mm, and κ = 1, 2, 3, 4. | ||
With an increase in κ of the working condition, φκ, of the investigated battery, the uneven distribution of pixels of strong active materials becomes more pronounced, and the number of pixels of strong active materials in the central area x ∈ [−1,1] of the negative cross-sectional image gradually decreases, as shown in Fig. 7(a). Similarly, as shown in Fig. 7(b), the number of pixels of strong active materials in the central area x ∈ [−1,1] of the positive cross-sectional image gradually decreases. It can be inferred that as the actual capacity of the investigated battery decreases, the strong active materials in both the central areas of the positive and negative cross-sections are lost first; this result is consistent with previously reported conclusions,44 i.e., the inhomogeneity in the electrode structure may lead to inhomogeneous degradation of the electrode.
5. Conclusions
By analyzing the relationship between the capacity and structural parameters of the active materials of a Li-ion battery based on Faraday's law, we found that the capacity is closely related to the structural parameters of active materials. Considering the requirements of accurate, nondestructive, and rapid capacity detection of Li-ion batteries used in electric vehicles, we established a method to detect the capacity of Li-ion batteries based on X-ray computed tomography. By virtue of the battery's electrochemical performance testing techniques and tomographic measurement techniques, we constructed a capacity detection system and carried out an electrochemical experiment and a tomographic imaging experiment on a batch of four 10 A h LFP batteries. The results reveal the following conclusions:(1) The actual capacity of a Li-ion battery is a function of the structural parameters of the active materials and the working condition, and it can be obtained by the number of pixels of strong active materials both in the positive and negative cross-sectional images, cycle number, and temperature of the battery.
(2) With a change in the structural parameter of the active materials, the influence of the working condition of a Li-ion battery on the actual capacity gradually changes. The influence of cycle number on the actual capacity gradually increases with an increase in temperature.
(3) When the actual capacity of a Li-ion battery decays due to a change in its working condition, the loss of strong active materials in the negative cross-sectional image is more than that in the positive cross-sectional image. Furthermore, the strong active materials in the central area of the positive and negative cross-sections are lost first.
These results are not only consistent with the experimental data of the electrochemical performances of the investigated batteries, but also with the corresponding conclusions drawn from the existing literature, which prove the feasibility of the capacity detection method. In addition, this detection method is also suitable for other types of Li-ion batteries, the working principle of which should be in accordance with Faraday's law.
Conflicts of interest
There are no conflicts to declare.Acknowledgements
This research was supported by the Guangdong Province Collaborative Innovation and Platform Environment Construction Grant (Contract No. 2014B090901054), and Guangdong Province Public Welfare Research and Capacity Building Grant (Contract No. 2014B010106004).References
- X. L. Huang, R. Z. Wang, D. Xu, Z. L. Wang, H. G. Wang, J. J. Xu, Z. Wu, Q. C. Liu, Y. Zhang and X. B. Zhang, Adv. Funct. Mater., 2013, 23, 4345–4353 CrossRef.
- Z. L. Wang, D. Xu, L. M. Wang and X. B. Zhang, Chempluschem, 2012, 77, 124–128 CrossRef.
- D. L. Ma, Z. Y. Cao, H. G. Wang, X. L. Huang, L. M. Wang and X. B. Zhang, Energy Environ. Sci., 2012, 5, 8538–8542 RSC.
- P. Liu, J. Wang, J. Hicks-Garner, E. Sherman, S. Soukiazian, M. Verbrugge, H. Tataria, J. Musser and P. Finamore, J. Electrochem. Soc., 2010, 157, A499–A507 CrossRef.
- C. Capasso and O. Veneri, Appl. Energy, 2014, 136, 921–930 CrossRef.
- B. Scrosati and J. Garche, J. Power Sources, 2010, 195, 2419–2430 CrossRef.
- T. Sun, Z. j. Li, H. g. Wang, D. Bao, F. l. Meng and X. b. Zhang, Angew. Chem., 2016, 128, 10820–10824 CrossRef.
- X. L. Huang, D. Xu, S. Yuan, D. L. Ma, S. Wang, H. Y. Zheng and X. B. Zhang, Adv. Mater., 2014, 26, 7264–7270 CrossRef PubMed.
- J. Wang, H. X. Zhong, Y. L. Qin and X. B. Zhang, Angew. Chem., Int. Ed., 2013, 52, 5248–5253 CrossRef PubMed.
- H. G. Wang, S. Yuan, D. L. Ma, X. B. Zhang and J. M. Yan, Energy Environ. Sci., 2015, 8, 1660–1681 RSC.
- Y. H. Hung and C. H. Wu, Appl. Energy, 2012, 98, 479–490 CrossRef.
- E. Samadani, M. Mastali, S. Farhad, R. A. Fraser and M. Fowler, Int. J. Energy, 2016, 40, 379–392 CrossRef.
- BTP (Battery Test Procedure) Working Group, Electric Vehicle Battery Test Procedures Manual Revision 2, U.S Advanced Battery Consortium and U.S. Department of Energy, 2nd edn, 1996 Search PubMed.
- National Development and Reform Committee of the People's Republic of China, Lithium-ion Batteries for Electric Vehicles, Auto Industry Standard QC/T 743-2006, China Plan Publishing Company, 2006 Search PubMed.
- R. Carter, B. Huhman, C. T. Love and I. V. Zenyuk, J. Power Sources, 2018, 381, 46–55 CrossRef.
- M. Dubarry and B. Y. Liaw, J. Power Sources, 2009, 194, 541–549 CrossRef.
- M. G. Ouyang, X. N. Feng, X. B. Han, L. G. Lu, Z. Li and X. M. He, Appl. Energy, 2016, 165, 48–59 CrossRef.
- J. Wang, P. Liu, J. Hicks-Garner, E. Sherman, S. Soukiazian, M. Verbrugge, H. Tataria, J. Musser and P. Finamore, J. Power Sources, 2011, 196, 3942–3948 CrossRef.
- S. Käbitz, J. B. Gerschler, M. Ecker, Y. Yurdagel, B. Emmermacher, D. André, T. Mitsch and D. U. Sauer, J. Power Sources, 2013, 239, 572–583 CrossRef.
- M. Dubarry, B. Y. Liaw, M. S. Chen, S. S. Chyan, K. C. Han, W. T. Sie and S. H. Wu, J. Power Sources, 2011, 196, 3420–3425 CrossRef.
- M. Dubarry, C. Truchot, B. V. Liaw, K. Gering, S. Sazhin, D. Jamison and C. Michelbacher, J. Power Sources, 2011, 196, 10336–10343 CrossRef.
- P. Keil, S. F. Schuster, J. Wilhelm, J. Travi, A. Hauser, R. C. Karl and A. Jossen, J. Electrochem. Soc., 2016, 163, A1872–A1880 CrossRef.
- I. Bloom, J. Christophersen and K. Gering, J. Power Sources, 2005, 139, 304–313 CrossRef.
- B. Y. Liaw, R. G. Jungst, G. Nagasubramanian, H. L. Case and D. H. Doughty, J. Power Sources, 2005, 140, 157–161 CrossRef.
- C. Blanco, L. Sánchez, M. Gonzalez, J. C. Anton, V. Garcia and J. C. Viera, IEEE Trans. Veh. Technol., 2014, 63, 3592–3599 Search PubMed.
- T. R. Ashwin, Y. M. Chung and J. H. Wang, J. Power Sources, 2016, 328, 586–598 CrossRef.
- M. Safari, M. Morcrette, A. Teyssot and C. Delacourt, J. Electrochem. Soc., 2009, 156, A145–A153 CrossRef.
- K. M. O. Jensen, X. H. Yang, J. V. Laveda, W. G. Zeier, K. A. See, M. Di Michiel, B. C. Melot, S. A. Corr and S. J. L. Billinge, J. Electrochem. Soc., 2015, 162, A1310–A1314 CrossRef.
- P. R. Shearing, L. E. Howard, P. S. Jorgensen, N. P. Brandon and S. J. Harris, Electrochem. Commun., 2010, 12, 374–377 CrossRef.
- P. Pietsch, D. Westhoff, J. Feinauer, J. Eller, F. Marone, M. Stampanoni, V. Schmidt and V. Wood, Nat. Commun., 2016, 7, 1–11 Search PubMed.
- V. Yufit, P. Shearing, R. W. Hamilton, P. D. Lee, M. Wu and N. P. Brandon, Electrochem. Commun., 2011, 13, 608–610 CrossRef.
- D. P. Finegan, M. Scheel, J. B. Robinson, B. Tjaden, M. Di Michiel, G. Hinds, D. J. L. Brett and P. R. Shearing, Phys. Chem. Chem. Phys., 2016, 18, 30912–30919 RSC.
- D. P. Finegan, M. Scheel, J. B. Robinson, B. Tjaden, I. Hunt, T. J. Mason, J. Millichamp, M. Di Michiel, G. J. Offer, G. Hinds, D. J. L. Brett and P. R. Shearing, Nat. Commun., 2015, 6, 1–10 Search PubMed.
- D. Linden and T. B. Reddy, Handbook of Batteries, McGraw-Hill, New York, 3rd edn, 2002 Search PubMed.
- C. Julien, A. Mauger, A. K. Vijh and K. Zaghib, Lithium batteries: science and technology, Springer, Cham, 2016 Search PubMed.
- M. Yoshio, R. J. Brodd and A. Kozawa, Lithium-ion batteries: science and technologies, Springer, New York, 2009 Search PubMed.
- W. Burger and M. J. Burge, Principles of digital image processing: core algorithms, Springer, London, 2009 Search PubMed.
- J. Serra and P. Soille, Mathematical morphology and its applications to image processing, Springer, New York, 2012 Search PubMed.
- R. A. Ketcham and W. D. Carlson, Comput. Geosci., 2001, 27, 381–400 CrossRef.
- T. M. Buzug, Computed tomography: from photon statistics to modern cone-beam CT, Springer, Heidelberg, 2008 Search PubMed.
- J. Hsieh, Computed tomography: principles, design, artifacts, and recent advances, SPIE Bellingham, Washington, 2nd edn, 2009 Search PubMed.
- C. A. Schneider, W. S. Rasband and K. W. Eliceiri, Nat. Methods, 2012, 9, 671–675 CrossRef PubMed.
- J. Vetter, P. Novák, M. R. Wagner, C. Veit, K. C. MöllerbJ, J. O. Besenhard, M. Winter, M. Wohlfahrt-Mehrens, C. Vogler and A. Hammouche, J. Power Sources, 2005, 147, 269–281 CrossRef.
- C. R. Birkl, M. R. Roberts, E. McTurk, P. G. Bruce and D. A. Howey, J. Power Sources, 2017, 341, 373–386 CrossRef.
- T. Hsia, IEEE Trans. Autom. Control, 1976, 21, 104–108 CrossRef.
- P. Ma, F. Ding, A. Alsaedi and T. Hayat, Multidim. Syst. Sign. P., 2018, 29, 1135–1152 CrossRef.
- C. Xu, L. Lu, D. Ren, F. Jiang and M. Ouyang, Qiche Gongcheng/Automotive Engineering, 2017, 39, 1141–1144 Search PubMed.
- M. Dubarry, C. Truchot and B. Y. Liaw, J. Power Sources, 2012, 219, 204–216 CrossRef.
| This journal is © The Royal Society of Chemistry 2018 |