 Open Access Article
Low temperature fabrication of Fe2O3 nanorod film coated with ultra-thin g-C3N4 for a direct z-scheme exerting photocatalytic activities†
Suhee Kang a,
Joonyoung Janga,
Rajendra C. Pawar
 b,
Sung-Hoon Ahn
 c and
Caroline Sunyong Lee
 *a
*a
aDepartment of Materials and Chemical Engineering, Hanyang University, Ansan, Gyeonggi-do 15588, South Korea. E-mail: sunyonglee@hanyang.ac.kr
bDepartment of Energy Engineering, Hanyang University, Seoul, 04763, South Korea
cDepartment of Mechanical and Aerospace Engineering, Seoul National University, Seoul, 08826, South Korea
First published on 1st October 2018
Abstract
We engineered high aspect ratio Fe2O3 nanorods (with an aspect ratio of 17![[thin space (1/6-em)]](https://www.rsc.org/images/entities/char_2009.gif) :
:![[thin space (1/6-em)]](https://www.rsc.org/images/entities/char_2009.gif) 1) coated with g-C3N4 using a sequential solvothermal method at very low temperature followed by a thermal evaporation method. Here, the high aspect ratio Fe2O3 nanorods were directly grown onto the FTO substrate under relatively low pressure conditions. The g-C3N4 was coated onto a uniform Fe2O3 nanorod film as the heterostructure, exhibiting rational band conduction and a valence band that engaged in surface photoredox reactions by a direct z-scheme mechanism. The heterostructures, particularly 0.75g-C3N4@Fe2O3 nanorods, exhibited outstanding photocatalytic activities compared to those of bare Fe2O3 nanorods. In terms of 4-nitrophenol degradation, 0.75g-C3N4@Fe2O3 nanorods degraded all of the organic pollutant within 6 h under visible irradiation at a kinetic constant of 12.71 × 10⁻³ min−1, about 15-fold more rapidly than bare Fe2O3. Further, the hydrogen evolution rate was 37.06 μmol h−1 g−1, 39-fold higher than that of bare Fe2O3. We suggest that electron and hole pairs are efficiently separated in g-C3N4@Fe2O3 nanorods, thus accelerating surface photoreaction via a direct z-scheme under visible illumination.
1) coated with g-C3N4 using a sequential solvothermal method at very low temperature followed by a thermal evaporation method. Here, the high aspect ratio Fe2O3 nanorods were directly grown onto the FTO substrate under relatively low pressure conditions. The g-C3N4 was coated onto a uniform Fe2O3 nanorod film as the heterostructure, exhibiting rational band conduction and a valence band that engaged in surface photoredox reactions by a direct z-scheme mechanism. The heterostructures, particularly 0.75g-C3N4@Fe2O3 nanorods, exhibited outstanding photocatalytic activities compared to those of bare Fe2O3 nanorods. In terms of 4-nitrophenol degradation, 0.75g-C3N4@Fe2O3 nanorods degraded all of the organic pollutant within 6 h under visible irradiation at a kinetic constant of 12.71 × 10⁻³ min−1, about 15-fold more rapidly than bare Fe2O3. Further, the hydrogen evolution rate was 37.06 μmol h−1 g−1, 39-fold higher than that of bare Fe2O3. We suggest that electron and hole pairs are efficiently separated in g-C3N4@Fe2O3 nanorods, thus accelerating surface photoreaction via a direct z-scheme under visible illumination.
1. Introduction
Efforts to replace traditional fossil fuels are increasing because of the energy crisis and environmental contamination.1,2 One of the many fascinating green technologies is photocatalytic degradation of organic pollutants and sustainable hydrogen production employing solar energy.3–5 Many inorganic,6 organic,7 metal,8 metal oxide,9–13 and non-metal14 materials have been used to reduce wastewater pollution and generate sustainable energy. However, the rapid recombination rates of charge carriers on catalytic surfaces reduce the photocatalytic efficiencies of single-component catalysts. Thus, semiconductor-based photocatalysts have received considerable attention; heterostructures of many materials afford reasonable band levels, maximizing rapid photocatalysis.15–18 As the conduction and valence band levels differ, electron/hole pairs created using solar energy do not readily combine, improving photocatalytic performance. Nevertheless, heterostructure photo-oxidation/reduction reactions are compromised by the short energy bands of heterostructures compared to single-phase materials.19The direct z-scheme, which recombines weaker oxidative holes and reductive electrons from semiconductors, has emerged as a major research area because the scheme may improve surface charge transfer and separation.20–22 Various direct z-scheme photocatalysts have been studied, including g-C3N4/Ag3PO4,23 Fe2O3/Cu2O,24 and Bi2O3/g-C3N4.25 However, these heterostructures lack stability when exposed to sunlight and are difficult to synthesize. Useful heterostructures would be simply synthesized and exhibit excellent stability.
Recently, graphitic carbon nitride (g-C3N4), a polymeric non-metallic semiconductor, has been widely studied as a photocatalyst. Fabrication is inexpensive and simple, the material is carbon/nitrogen-rich and is non-toxic.26 Furthermore, g-C3N4 exhibits a band gap of 2.6 eV, which is eminently suitable in terms of pollutant degradation and hydrogen evolution.27–29 However, pure g-C3N4 exhibits rapid recombination of photogenerated electron/hole pairs, severely compromising photocatalytic activity. To reduce the recombination rate, heterostructures using different conduction and valence bands to host (reducing) electrons and (oxidizing) holes are required.30–34
The transition metal oxide Fe2O3 can utilize solar light of wavelengths up to 600 nm; the band gap is ∼2.1 eV. Thus, Fe2O3 exhibits great potential because of its low cost, abundance, and good chemical stability.35 Moreover, Fe2O3 has a 2.38 eV valence band that can be exploited by the direct z-scheme mechanism of photocatalysis; thus, Fe2O3 can serve as a photoactive material.36 However, Fe2O3 has a short hole diffusion length and exhibits rapid charge recombination, rendering the photocatalytic efficiency low.37 Therefore, Fe2O3 must be combined with other semiconductors in heterostructures featuring separation of electron/hole pairs, allowing photo-oxidation and reduction using the direct z-scheme system.
Many Fe2O3/g-C3N4 heterostructures, including powder-like bulk composites, have been developed to eliminate organic pollutants and evolve H2 under visible irradiation.38–41 However, such heterostructures, when exposed to solar illumination, exhibit gradual reductions in electron movement, compromising photocatalysis compared to that of one-dimensional (1D) structures.42 To overcome this problem, we fabricated g-C3N4@1D Fe2O3 nanorods using the simplest procedure; In situ growing of high aspect ratio of Fe2O3 nanorods with solvothermal method at 100 °C for 24 hours was followed by ultra-thin coating of g-C3N4 layer using melamine precursors with thermal evaporation method to degrade 4-nitrophenol (4-NP) and evolve H2. The prepared 1D Fe2O3 nanorods coated with ultra-thin g-C3N4 layers can be fabricated in a straightforward, cost-effective manner to show the direct z-scheme system. We explored the physicochemical properties of our materials and optimized the g-C3N4@Fe2O3 nanorods in terms of photocatalysis; we then compared the materials to that of bare Fe2O3 nanorods for its potential application in photocatalytic fields such as H2 evolution, artificial photosynthesis or even more electrocatalysts and battery applications.
2. Experimental
2.1 Materials
We used the Fe2O3 precursor ferric chloride (FeCl3) and the g-C3N4 precursor melamine (Junsei, Japan). Sodium nitride (NaNO3), hydrochloric acid (HCl), acetonitrile, sodium sulfate (Na2SO4) and hydrogen peroxide (H2O2) were all purchased from Daejung (Korea). Triethanolamine (TEOA) (Samchun, Korea) and H2PtCl2 (Sigma-Aldrich, USA) were used to trigger H2 evolution. Conductive fluorine-doped tin oxide (FTO, 15 mΩ) served as the photoanode film. p-nitrophenol was purchased from Kanto (Japan). All chemicals were used without further purification.2.2 Preparation of a Fe2O3 photoanode and g-C3N4 coating
Fe2O3 photoanodes were prepared on FTO substrates using a solvothermal method under relatively low pressurized condition.43 Conventionally, pressurized condition is mostly used for fabrication of Fe2O3 photoanodes. However, we have developed relatively low pressure process to fabricate high aspect ratio of nanorods (almost 17![[thin space (1/6-em)]](https://www.rsc.org/images/entities/char_2009.gif) :
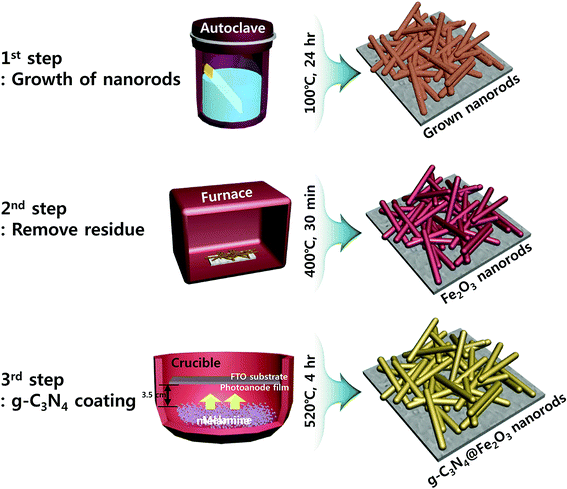
:![[thin space (1/6-em)]](https://www.rsc.org/images/entities/char_2009.gif) 1) film with extreme uniformity onto FTO substrate through in situ process. Prior to Fe2O3 growth, the substrates were sequentially cleaned with acetone, ethanol, and distilled water with sonication for 5 min each time and dried in an oven. 0.2 M FeCl3 was dissolved in 35 mL of distilled water while 1.4 M NaNO3 and 0.5 mL of HCl were added. After complete dissolution, 15 mL of acetonitrile was added and this mixture was stirred for 30 min. Plasma-enhanced chemical vapor deposition (PECVD) was used to perform O2 plasma treatment, removing any pollutants. The solution described above was transferred to 100 mL of Teflon-lined molds and held at 100 °C for 24 h in a box furnace. Afterwards, the film was taken out from the mold and dried at ambient atmosphere. Then, the dried film was annealed at 400 °C for 30 min and washed several times with distilled water in order to remove any residues left on the top of the film. Fig. S1(b)† shows no transformation of this material to hematite phase after annealing at 400 °C since no peak for hematite is detected. In order to make successful transformation to hematite Fe2O3 phase, this washed film was annealed again at 520 °C for 4 h where this is denoted as “bare Fe2O3” for clarification. To coat the photoanodes with a g-C3N4 layer to form heterostructure, various amounts of melamine (0.25, 0.5, 0.75, and 1 g) in powder form were used in alumina crucible for optimization of heterostructure. Photoanode film was placed 3.5 cm apart from the melamine powders, facing each other in the crucible as shown in Scheme 1. Then, the melamine powders were sintered and coated on the surface of the photoanode film through thermal evaporation method at 520 °C for 4 h (10 °C min−1). Finally, g-C3N4-coated photoanode films were successfully obtained by this evaporation of melamine powders as the overall procedure is represented in Scheme 1.
1) film with extreme uniformity onto FTO substrate through in situ process. Prior to Fe2O3 growth, the substrates were sequentially cleaned with acetone, ethanol, and distilled water with sonication for 5 min each time and dried in an oven. 0.2 M FeCl3 was dissolved in 35 mL of distilled water while 1.4 M NaNO3 and 0.5 mL of HCl were added. After complete dissolution, 15 mL of acetonitrile was added and this mixture was stirred for 30 min. Plasma-enhanced chemical vapor deposition (PECVD) was used to perform O2 plasma treatment, removing any pollutants. The solution described above was transferred to 100 mL of Teflon-lined molds and held at 100 °C for 24 h in a box furnace. Afterwards, the film was taken out from the mold and dried at ambient atmosphere. Then, the dried film was annealed at 400 °C for 30 min and washed several times with distilled water in order to remove any residues left on the top of the film. Fig. S1(b)† shows no transformation of this material to hematite phase after annealing at 400 °C since no peak for hematite is detected. In order to make successful transformation to hematite Fe2O3 phase, this washed film was annealed again at 520 °C for 4 h where this is denoted as “bare Fe2O3” for clarification. To coat the photoanodes with a g-C3N4 layer to form heterostructure, various amounts of melamine (0.25, 0.5, 0.75, and 1 g) in powder form were used in alumina crucible for optimization of heterostructure. Photoanode film was placed 3.5 cm apart from the melamine powders, facing each other in the crucible as shown in Scheme 1. Then, the melamine powders were sintered and coated on the surface of the photoanode film through thermal evaporation method at 520 °C for 4 h (10 °C min−1). Finally, g-C3N4-coated photoanode films were successfully obtained by this evaporation of melamine powders as the overall procedure is represented in Scheme 1.
2.3 Evaluation of photocatalytic activity
Photocatalytic activity was evaluated using 0.02 mM 4-NP in distilled water. The g-C3N4@Fe2O3 photoanode films were placed in 250 mL amounts of this solution and 0.5 mL of H2O2 was added prior to illumination to accelerate catalytic activity, followed by stirring for 30 min in the dark. The H2O2 is used to produce hydroxyl radical (·OH) and OH− species, reducing Fe3+ to Fe2+ under light condition.51 Then, 300W Xe arc lamp (>400 nm cut-off filter) was used to illuminate the solution while amount of 3 mL was collected every 1 h until the degradation was complete.2.4 Photoelectrochemical performance
Photoelectrochemical (PEC) performance was evaluated using a three-electrode in quartz cell. Graphite and Ag/AgCl served as the counter-electrode and reference electrode, respectively. The electrolyte solution was 0.5 M Na2SO4 and PEC performance was analyzed using a Xe arc lamp (300 W, model 66984; Oriel, USA) with cut-off filter (>400 nm). A transient photocurrent was applied at 1 V of bias potential versus the Ag/AgCl reference electrode, with light-chopping every minute to allow the response to be observed. Stability testing was performed for 40 h under the same conditions. Linear sweep voltammetry (LSV) was performed at a 20 mV s−1 scan rate from −1 to 1 V. Electrochemical impedance spectroscopy (EIS) was performed from 105 to 0.01 Hz at an amplitude of 20 mV under both dark and light conditions.2.5 Photocatalytic H2 production
Photocatalytic H2 evolution was assessed with the aid of a 250 mL quartz reactor in a closed-gas system under visible illumination. The light source was a 300 W Xe arc lamp fitted with an ultraviolet (UV) cut-off filter (>400 nm), thus delivering only visible light. 10 mg of as-prepared catalytic powder were dispersed in135 mL of distilled water until they are completely mixed. Then, 9 vol% of TEOA was added into that of aqueous solution to be acted as hole capture. A 1 wt% Pt solution served as the co-catalyst via in situ photodeposition. The solutions were uniformly dispersed prior to reaction. The suspension was then transferred to the quartz reactor and purged with N2 gas to remove O2. The reactor was sealed with a septum and purged with Ar gas to completely eliminate all air. Evolved gas was detected by a pulsed discharge detector fitted to a gas chromatograph (model 6500GC; YL Instruments, Korea); helium served as the carrier gas.2.6 Characterization
g-C3N4 and Fe2O3 morphologies were studied using a scanning electron microscope (SEM; model S4800; Hitachi, Japan) and a transmission electron microscope (TEM) (model JEM 2100F; JEOL, Japan). The crystalline structure and other properties of the Fe2O3 phase were analyzed by X-ray diffraction (XRD) (D/Max-2500/PC instrument; Rigaku, USA; Cu-Kα source), Fourier-transform infrared spectroscopy (FTIR) (iS10 instrument; Thermo Fisher Scientific, UK), and X-ray photoelectron spectroscopy (XPS) (Sigma Probe instrument, Thermo Fisher Scientific; Al Kα source); these modality es were also used to confirm the presence of g-C3N4 coatings. The band gap energy was calculated via UV-visible spectroscopy (UV-Vis) (model V650; JASCO, Japan). Photoluminescence (PL) (SC-100 instrument; Dongwoo, Korea) and Raman spectroscopy (S-Ram instrument; Dongwoo) were employed to monitor the recombination rate of Fe2O3 and g-C3N4 under light excitation at 325 nm. All PEC analyses were performed using a potentiostat (Versastat 4 instrument; Princeton Applied Research, USA). The absorbances of photocatalytically degraded solutions were measured via UV-Vis spectroscopy.3. Results and discussion
3.1 Morphology
We fabricated heterostructures using sequential solvothermal and thermal evaporation methods. We obtained top and cross-sectional views to explore how morphologies varied by the extent of coating. Prior to structural observations, chemically grown photoanode films were annealed first at 400 °C for 30 min and then washed several times with distilled water to remove any residue within nanorods that might interfere with electron transfer. As a result, the microstructure showed that the residue was perfectly removed while these nanorods are still strongly attached to the FTO substrate even after washing (Fig. S1(a)†). However, the annealing process at 400 °C for 30 min followed by washing treatments did not convert its structural phase into hematite phase since high intensity of NaNO3 peaks (JCPDS no. 36-1474) and SnO2 peaks (JCPDS no. 77-0451) were shown in Fig. S1(b).† To obtain pure hematite Fe2O3 nanorods, washed photoanode film was again annealed at 520 °C for 4 h. And finally, the bare Fe2O3 film was acquired.As shown in Fig. 1(a), the FTO substrate contained only Fe2O3 nanorods, the surfaces of which were smooth. The observed high aspect ratio would be expected to improve electron transfer and photoactivity (Fig. S2†). After the g-C3N4 precursor was evaporated during optimum sintering at 520 °C, nano-sized, agglomerated g-C3N4 particles were clearly attached to the Fe2O3 nanorods. The thicknesses of these microstructures averaged around 1.5 μm (from the bottom of the Fe2O3 nanorod to the top of the g-C3N4 coating). The thickness of the heterostructured films increased as the amount of the melamine precursor increased, from 0.25 to 0.5, 0.75 and 1 g, resulting in increasing thermal evaporation of g-C3N4 [Fig. 1(b)–(e)]. A previous study indicated that the precursor level should be varied to optimize the coating layer; thicker layers obstruct incident light and reduce activity.45 We performed energy-dispersive spectroscopy (EDS) mapping to reveal the elements of g-C3N4@Fe2O3 heterostructures; these were (as expected) iron, oxygen, carbon, and nitrogen (Fig. S3†). For comparison, the bulk g-C3N4 was observed for its microstructures in terms of agglomeration, reducing the active site from surface area as well as blocking electron pathway under illumination as shown in Fig. S4.† We thus confirmed that well-formed g-C3N4@Fe2O3 heterostructures had been created via a simple chemical process.
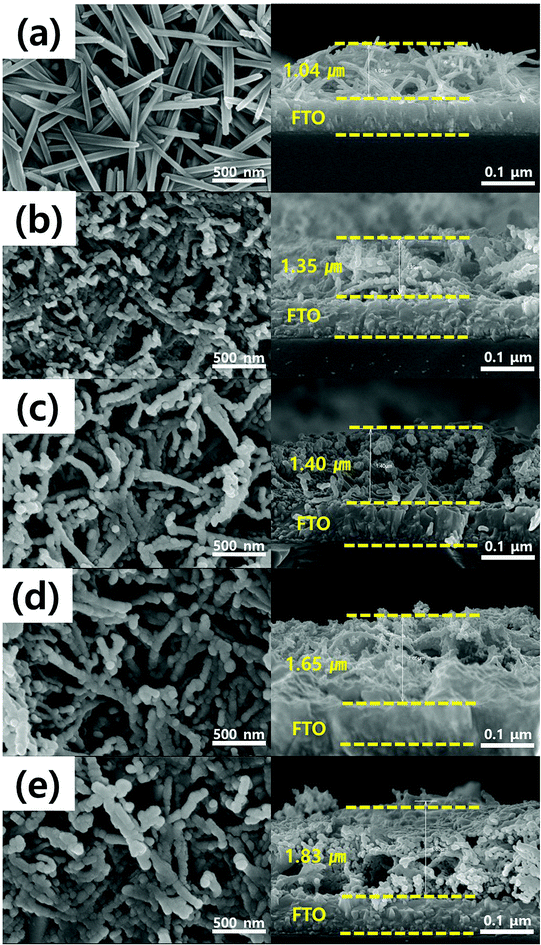 | ||
| Fig. 1 SEM micrographs of (a) bare Fe2O3, (b) 0.25g-C3N4@Fe2O3, (c) 0.5g-C3N4@Fe2O3, (d) 0.75g-C3N4@Fe2O3, and (e) 1g-C3N4@Fe2O3; cross-sections (right-hand) and surface views (left-hand). | ||
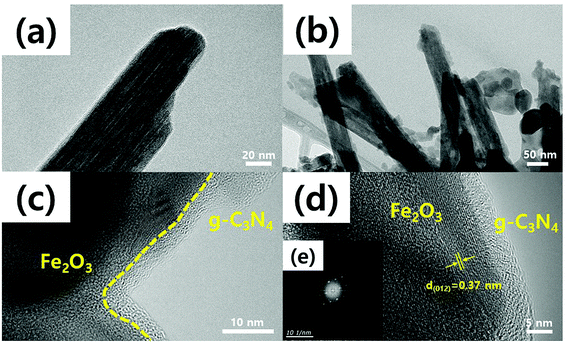
The TEM was used to derive the precise dimensions of the Fe2O3 nanorods, the lattice distance, and the g-C3N4 thicknesses. Bare Fe2O3 nanorods were ∼60 nm in diameter [Fig. 2(a)]. All Fe2O3 nanorods had a high aspect ratio (16.7![[thin space (1/6-em)]](https://www.rsc.org/images/entities/char_2009.gif) :
:![[thin space (1/6-em)]](https://www.rsc.org/images/entities/char_2009.gif) 1), enhancing the surface area and thus active sites. The TEM images of g-C3N4 coated onto Fe2O3 [Fig. 2(b) to (d)] showed that the Fe2O3 nanorods were fully covered with g-C3N4. Furthermore, the g-C3N4 coat was <10 nm in thickness, but this varied slightly because of yield effects during thermal evaporation. If g-C3N4 precursors are loaded onto Fe2O3 films to different extents under atmospheric conditions, g-C3N4 production levels will vary, affecting the final coating layers. Fast Fourier Transform (FFT) [Fig. 2(e)] revealed that the interplanar spacing in Fe2O3 was 0.37 nm, corresponding to the lattice distance of the (012) plane for Fe2O3. Thus, our heterostructures of 1D Fe2O3 nanorods covered with g-C3N4 sheets, were successfully synthesized using the relatively low pressurized solvothermal method which have shown good catalytic performance due to efficient separation of charge carriers right at the interface between g-C3N4 and Fe2O3, resulting in enhanced electron movements along with 1D structures.
1), enhancing the surface area and thus active sites. The TEM images of g-C3N4 coated onto Fe2O3 [Fig. 2(b) to (d)] showed that the Fe2O3 nanorods were fully covered with g-C3N4. Furthermore, the g-C3N4 coat was <10 nm in thickness, but this varied slightly because of yield effects during thermal evaporation. If g-C3N4 precursors are loaded onto Fe2O3 films to different extents under atmospheric conditions, g-C3N4 production levels will vary, affecting the final coating layers. Fast Fourier Transform (FFT) [Fig. 2(e)] revealed that the interplanar spacing in Fe2O3 was 0.37 nm, corresponding to the lattice distance of the (012) plane for Fe2O3. Thus, our heterostructures of 1D Fe2O3 nanorods covered with g-C3N4 sheets, were successfully synthesized using the relatively low pressurized solvothermal method which have shown good catalytic performance due to efficient separation of charge carriers right at the interface between g-C3N4 and Fe2O3, resulting in enhanced electron movements along with 1D structures.
3.2 Characterization
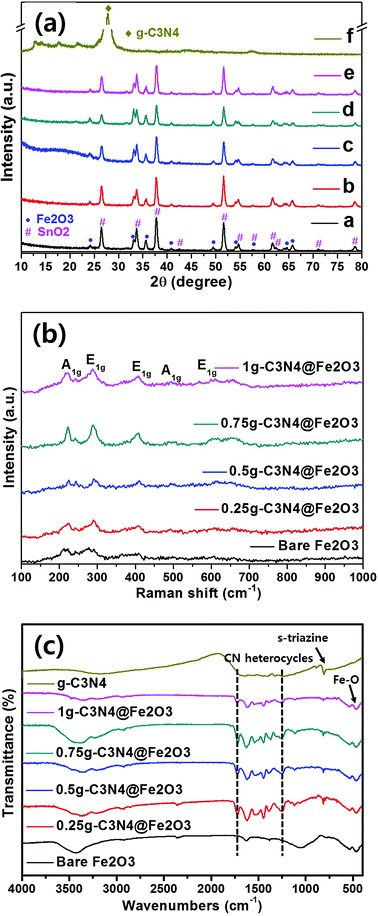
Fig. 3(a) shows the Fe2O3 crystallinities of bare Fe2O3 and all of the prepared heterostructures using XRD analysis. Distinct Fe2O3 peaks are evident at 24.10, 33.08, 35.61 and 51.58°, corresponding to the (012), (104), (110), and (116) planes, respectively. The structure was hematite in nature (α-Fe2O3), as indicated by the JCPDS 01-084-0306 criteria, and the Fe2O3 lattice constants were a = b = 4.69 Å and c = 13.83 Å in the hexagonal structure. In the heterostructures, the sharp diffraction peaks indicated high-level Fe2O3 crystallinity and no impurity peak was appeared. The photoanode films were subjected to XRD and the diffraction peaks of the SnO2 phase were thus observed (JCPDS no. 01-070-6995). The peaks for bulk g-C3N4 were observed to be (100) and (002) planes at 13° and 27°, respectively as shown in Fig. S4(b).† The initial peak for (100) plane was presented as the in-plane structural packing of triazine and the other intense peak for (002) plane was presented as the inter-planar spacing from aromatic group of g-C3N4.14 However, g-C3N4 was not detected by XRD; overall, the g-C3N4 loadings were relatively low in heterostructure films. Raman spectroscopy was used to identify characteristic Fe2O3 peaks [Fig. 3(b)]. Principal peaks were evident at 217, 290, 407, 493, and 603 cm−1, corresponding to the A1g, E1g, E1g, A1g, and E1g modes, respectively.46 For the case of bulk g-C3N4, the intense peaks were observed at 483.2, 708.6, 754.4, 976.9, 1235.9, 1313.9 and 1566.8 cm−1, relating g-C3N4 groups as shown in Fig. S4(c).† Among the Raman peaks, the peaks for g-C3N4 structures were presented at 483.2, 754.4, 976.9 and 1313.9 cm−1.47 Moreover, the initial peak of 708.6 cm−1 was presented to be the s-triazine ring for g-C3N4 group. The peaks at 1235.9 and 1566.8 cm−1 are observed to be the disorder in graphite structure and stretching mode in C![[double bond, length as m-dash]](https://www.rsc.org/images/entities/char_e001.gif) N bonding structure, respectively.48 However, again, g-C3N4 peaks were not detected because the g-C3N4 levels were low. Therefore, we used FT-IR to analyze the molecular compositions. In Fig. 3(c), the Fe2O3 peaks at 534 and 467 cm−1 correspond to stretching vibrations of the Fe–O bonds of FeO6 octahedral and FeO4 tetrahedral sites, respectively.49 The bulk g-C3N4 was compared for its specific g-C3N4 patterns with ones for the heterostructures. The principal g-C3N4 peaks range from 1700 to 1200 cm−1, corresponding to stretching vibrations of tri-s-triazine in the heterocyclic rings. In detail, the bands at 1448, 1370 and 1250 cm−1 correspond to aromatic C–N stretching vibrations.50 Furthermore, the band at 816 cm−1 corresponds to the s-triazine unit of the graphite-like sp2 bonding state. It is clearly confirmed that all g-C3N4 related peaks are shown in the as-fabricated heterostructures as well as bulk g-C3N4. Moreover, broad peaks at 3500–3000 cm−1 corresponded to N–H and O–H stretching vibrations caused by surface adsorption of H2O.51 Thus, we have confirmed the presence of g-C3N4 on Fe2O3.
N bonding structure, respectively.48 However, again, g-C3N4 peaks were not detected because the g-C3N4 levels were low. Therefore, we used FT-IR to analyze the molecular compositions. In Fig. 3(c), the Fe2O3 peaks at 534 and 467 cm−1 correspond to stretching vibrations of the Fe–O bonds of FeO6 octahedral and FeO4 tetrahedral sites, respectively.49 The bulk g-C3N4 was compared for its specific g-C3N4 patterns with ones for the heterostructures. The principal g-C3N4 peaks range from 1700 to 1200 cm−1, corresponding to stretching vibrations of tri-s-triazine in the heterocyclic rings. In detail, the bands at 1448, 1370 and 1250 cm−1 correspond to aromatic C–N stretching vibrations.50 Furthermore, the band at 816 cm−1 corresponds to the s-triazine unit of the graphite-like sp2 bonding state. It is clearly confirmed that all g-C3N4 related peaks are shown in the as-fabricated heterostructures as well as bulk g-C3N4. Moreover, broad peaks at 3500–3000 cm−1 corresponded to N–H and O–H stretching vibrations caused by surface adsorption of H2O.51 Thus, we have confirmed the presence of g-C3N4 on Fe2O3.
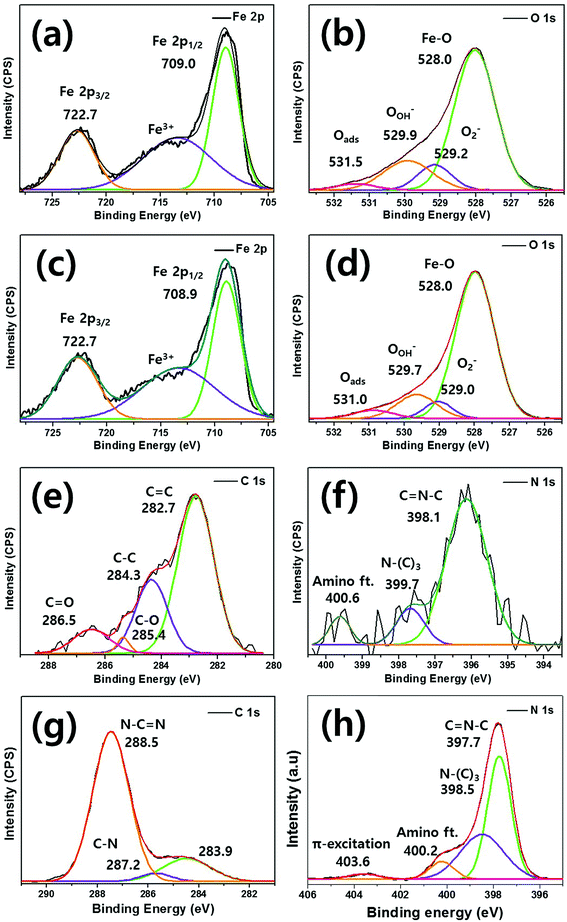
To explore the relationship between the C and N elements and Fe, XPS was performed as shown in Fig. 4. The typical Fe 2p spectrum of bare Fe2O3 features two different peaks (Fe 2p1/2 and Fe 2p3/2) of binding energies 709.0 eV and 722.8 eV, respectively [Fig. 4(a)]. Between these peaks, a satellite Fe3+ peak is apparent. In the O 1s spectrum, bare Fe2O3 exhibits principal peaks at 528.0 eV, 528.2 eV, 529.9 eV, and 531.5 eV, which are mainly attributable to Fe–O bonding, lattice oxygen, the hydroxyl group, and surface-absorbed H2O, respectively [Fig. 4(b)].44 Fig. 4(c) shows the 0.75g-C3N4@Fe2O3 Fe 2p spectrum (peaks at 708.9 eV for Fe 2p1/2 and 722.7 eV for Fe 2p3/2) of the g-C3N4 coating. Fig. 4(d) shows similarly broad principal peaks at 528.0 eV, 529.0 eV, 529.7 eV, and 531.0 eV.52 As g-C3N4 coated Fe2O3, C 1s and N 1s spectra were detected. The C 1s spectrum exhibits binding energies at 286.5, 285.4, 284.3, and 282.7 eV, corresponding to sp2-hybridized carbon in the tri-s-triazine rings C![[double bond, length as m-dash]](https://www.rsc.org/images/entities/char_e001.gif) O, C–O, C–C and C
O, C–O, C–C and C![[double bond, length as m-dash]](https://www.rsc.org/images/entities/char_e001.gif) C bonding, respectively [Fig. 4(e)].53,54 In the N 1s spectrum [Fig. 4(f)], the binding energy peaks at 396.1, 397.7, and 399.6 eV correspond to sp2-hybridized nitrogen (C–N
C bonding, respectively [Fig. 4(e)].53,54 In the N 1s spectrum [Fig. 4(f)], the binding energy peaks at 396.1, 397.7, and 399.6 eV correspond to sp2-hybridized nitrogen (C–N![[double bond, length as m-dash]](https://www.rsc.org/images/entities/char_e001.gif) C), tertiary nitrogen [N–(C)3], and –NH2 bonding, respectively, and were unique to the g-C3N4 moieties.41 Fig. 4(g) and (h) showed the C 1s and N 1s spectrums of bulk g-C3N4 for comparison, respectively. The bulk g-C3N4 shows three different peak positions at 288.5, 287.2 and 283.9 eV in C 1s spectrum. The peaks for 288.5 eV, 287.2 eV are for sp2-hybridized bonding of N–C
C), tertiary nitrogen [N–(C)3], and –NH2 bonding, respectively, and were unique to the g-C3N4 moieties.41 Fig. 4(g) and (h) showed the C 1s and N 1s spectrums of bulk g-C3N4 for comparison, respectively. The bulk g-C3N4 shows three different peak positions at 288.5, 287.2 and 283.9 eV in C 1s spectrum. The peaks for 288.5 eV, 287.2 eV are for sp2-hybridized bonding of N–C![[double bond, length as m-dash]](https://www.rsc.org/images/entities/char_e001.gif) N in aromatic and C–N bonds in carbon species of bulk g-C3N4, respectively. The peak for 283.9 eV is assigned to the carbon contamination during the samples preparation. In N 1s spectrum, the main peak of 397.7 eV is ascribed to C
N in aromatic and C–N bonds in carbon species of bulk g-C3N4, respectively. The peak for 283.9 eV is assigned to the carbon contamination during the samples preparation. In N 1s spectrum, the main peak of 397.7 eV is ascribed to C![[double bond, length as m-dash]](https://www.rsc.org/images/entities/char_e001.gif) N–C bonding while the peak of 398.5 eV is ascribed to N–(C)3 bonded group. The weaker peaks of 400.2 and 403.6 eV are attributed to amino functional groups in aromatic rings of g-C3N4 and π-excitation which is positively charged localization in heterocycles, respectively.60 When the 0.75 g of melamine is coated onto Fe2O3 film to convert into g-C3N4 layer, the amounts of coating layer are considerably lower than that of bulk g-C3N4. Thus, the carbon and nitrogen spectrums of 0.75g-C3N4@Fe2O3 showed relatively low intensity compared to that of bulk g-C3N4 even though it represented the carbon and nitrogen-related bonding as shown in Fig. 4(e) and (f). Therefore, that obvious peak shift for C
N–C bonding while the peak of 398.5 eV is ascribed to N–(C)3 bonded group. The weaker peaks of 400.2 and 403.6 eV are attributed to amino functional groups in aromatic rings of g-C3N4 and π-excitation which is positively charged localization in heterocycles, respectively.60 When the 0.75 g of melamine is coated onto Fe2O3 film to convert into g-C3N4 layer, the amounts of coating layer are considerably lower than that of bulk g-C3N4. Thus, the carbon and nitrogen spectrums of 0.75g-C3N4@Fe2O3 showed relatively low intensity compared to that of bulk g-C3N4 even though it represented the carbon and nitrogen-related bonding as shown in Fig. 4(e) and (f). Therefore, that obvious peak shift for C![[double bond, length as m-dash]](https://www.rsc.org/images/entities/char_e001.gif) N–C and N–(C)3 at 397.7 and 398.5 eV suggest the chemically formed heterojunctions between Fe2O3 and g-C3N4.
N–C and N–(C)3 at 397.7 and 398.5 eV suggest the chemically formed heterojunctions between Fe2O3 and g-C3N4.
3.3 Optical properties
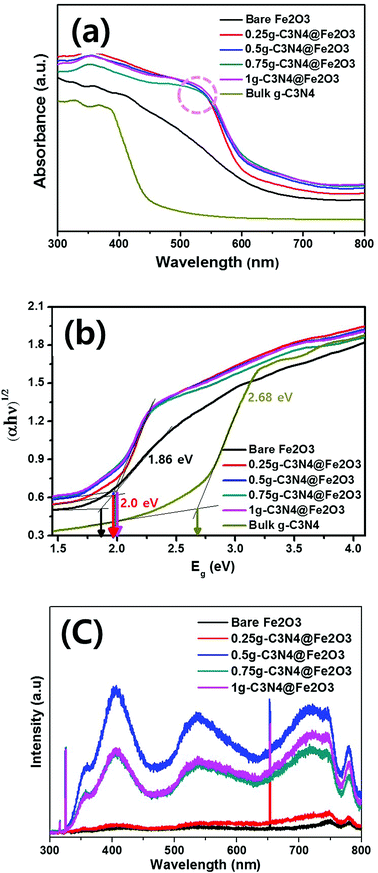
To study the absorbance ranges and band gap energies of the prepared films, the optical absorbance was measured from 300 to 800 nm as shown in Fig. 5(a). Bare Fe2O3 exhibited a slow absorption edge around 550 nm while the bulk g-C3N4 showed a steep absorption edge around 430 nm. However, when g-C3N4 was coated onto Fe2O3 films in different amounts, notable peaks were observed around 550 nm and the absorption edges became steeper because of g-C3N4 coating. Thus, all g-C3N4@Fe2O3 films exhibited higher absorption intensities than that of bare Fe2O3 during the entire UV-visible region, suggesting the enhancement of the absorption ability under illumination. The absorbance was calculated into band gap energies using the Kubelka–Munk function in Fig. 5(b). Although there is a difference in the absorption edge, all g-C3N4@Fe2O3 films exhibited similar band gap energies of 2.0 eV. When the g-C3N4 is coated onto Fe2O3 nanorod film, the band gap difference has occurred for sure, compared to that of bare Fe2O3 film of 1.86 eV. Based on calculated band gap of bulk g-C3N4, it exhibited 2.68 eV of band gap energy. Therefore, as-prepared heterostructure films provided the higher absorption intensity, with extending its utilization of light irradiation, compared to that of bare Fe2O3, confirming successful formation of heterostructure film.Fig. 5(c) shows PL spectra exploring recombination or transfer of photogenerated electrons and hole pairs between Fe2O3 and g-C3N4. Typically, large (>70 nm) nanomaterials do not exhibit PL since optical transition is not possible55 and our Fe2O3 nanorods also did not show any significant emission peaks. In other words, 0.25g-C3N4@Fe2O3 film also showed almost no PL emission peak possibly due to small amounts of g-C3N4 loading on bare Fe2O3. The 0.5g-C3N4@Fe2O3 showed the highest PL intensity among the samples because of the fast charge recombination. On the other hand, the 1g and 0.75g-C3N4@Fe2O3 were observed with similar PL intensity while 0.75g-C3N4@Fe2O3 showed lower intensity than that of 1g-C3N4@Fe2O3. This means that 0.75g-C3N4@Fe2O3 makes good heterojunction of interfaces, reflecting effective separation of electron and hole pairs. Furthermore, the bulk g-C3N4 was measured for comparison as shown in Fig. S4(d).† As a result, it showed high PL intensity at 423 nm of wavelength, attributing to fast recombination rate of charge carriers in bulky structures. Of all the photoanodes, 0.75g-C3N4@Fe2O3 associated with rapid electron movement and thus enhancement of PEC-mediated water splitting and photocatalytic performance.
3.4 Photoelectrochemical analysis
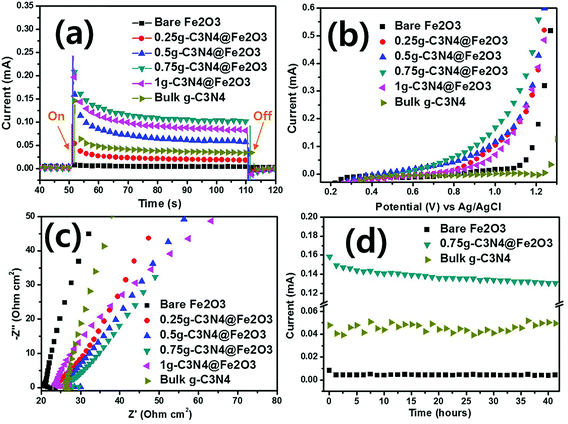
We used PEC analysis to evaluate photoresponses in the presence of 0.5 M Na2SO4 under visible illumination. Fig. 6(a) shows the transient photocurrents during light-chopping. The overall on–off cycles of all films are presented in Fig. S5(a).† During the on–off cycles, when the light was on, the film photoresponses were rapid. In the curves, the strong spikes in the light-on phases reflect electron–hole recombination on the surfaces during photocatalytic reactions. When recombination is slow, the spike peak is broad and the electron–hole combination exhibits a longer lifetime than that of the bare Fe2O3 film because of effective electron/hole separation during irradiation.56 Of the various hybrid films, the 0.75g-C3N4@Fe2O3 film exhibited slow and broad recombination, associated with a higher photocurrent (1.0 mA) than the other samples. Bare Fe2O3 exhibited almost no current (ca. 0.005 mA), whereas stepwise g-C3N4 coating increased the photocurrent proportionately (to 0.25g, 0.5g and 1g C3N4 values of 0.02, 0.06 and 0.09 mA, respectively). The photocurrent for bulk g-C3N4 was measured to be 0.04 mA under the same condition, exhibiting similar photocurrent with bare Fe2O3 and 0.25g-C3N4@Fe2O3 film. As expected, the 0.75g-C3N4@Fe2O3 film exhibited the highest photocurrent because charge separation was effective; recombination was low after the light came on. Surprisingly, the current was about 200-fold that of the bare Fe2O3 film because of optimization of the g-C3N4 coating layer, suggesting that photogenerated electrons and hole pairs separated effectively due to good formation of interface between g-C3N4 and Fe2O3 in heterojunctions.The photocurrent versus applied potential curves of bare Fe2O3, and the various heterostructures, were assessed using LSV under identical conditions. In the dark, no photoresponse attributable to hybridization was apparent [dashed line in Fig. S5(b)†].57 In the light [Fig. 6(b)], the bare Fe2O3 and bulk g-C3N4 films produced almost no photocurrent according to applied potential versus Ag/AgCl. In contrast, the various hybrid films exhibited photocurrents. The photoresponses of the 0.25g, 0.5g, and 1g-C3N4@Fe2O3 films were similar. The 0.75g-C3N4@Fe2O3 film evidenced the highest performance at 1 V versus Ag/AgCl. Therefore, the g-C3N4 coat formed a useful heterojunction with Fe2O3, reducing the recombination rate of the charge carriers.
EIS was used to measure charge transfers from the g-C3N4@Fe2O3/electrolyte interface. In the dark, all films tested (bare Fe2O3 and the various heterostructures) exhibited higher impedances than in the light [Fig. S5(c)†]. Fig. 6(c) shows the impedances of all samples, where that of bare Fe2O3 was highest. In the light, the electrons and holes created favor the separation of charge carriers, reducing interface resistance. All g-C3N4-coated films exhibited smaller arc curves than that of bare Fe2O3 and bulk g-C3N4. The Fe2O3 and g-C3N4 themselves only, are difficult to overcome the high recombination rate, resulting in high resistance between photocatalysts and electrolyte. Of all films, the 0.75g-C3N4@Fe2O3 film exhibited the smallest arc radius, suggesting that the heterostructure can effectively support transfer of the abundant electrons, minimizing surface recombination losses and further improving photocatalytic activities.
After PEC evaluation, we performed stability testing under the conditions shown in Fig. 6(d). Only bare Fe2O3 and 0.75g-C3N4@Fe2O3 were subjected to such testing. The latter film remained photoresponsive to 40 h and bare Fe2O3 was not photoresponsive. The stability of bulk g-C3N4 was also conducted for comparison under visible light and it showed unstable photocurrent of 0.04 mA. Despite a slight decrease in the 0.75g-C3N4@Fe2O3 photocurrent over time, this remained higher than that of Fe2O3. Therefore, the 0.75g-C3N4@Fe2O3 film was an optimized heterostructure featuring Fe2O3 and g-C3N4 coating layers.
3.5 Photocatalytic degradation and scavenger test
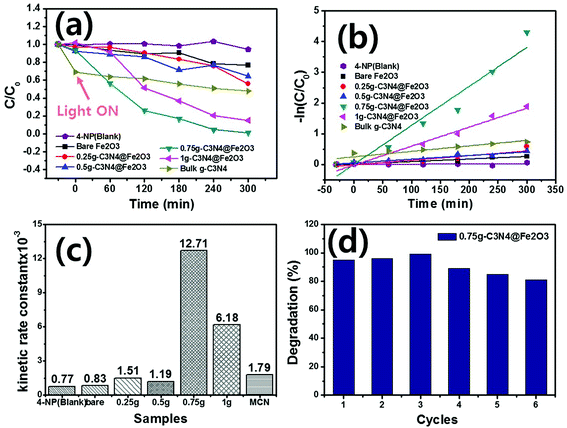
Photocatalytic degradation of 4-NP by g-C3N4@Fe2O3 films under visible light was examined. In order to facilitate photocatalytic reactions, 0.5 mL of H2O2 was added into 4-NP solution since the 4-NP solution was not degraded at all without presence of H2O2 during photodegradation evaluation, as shown in Fig. S6.† Fig. 7(a) illustrates the relative absorbance of all samples by the extent of 4-NP degradation over time. The blank was a pure 4-NP solution (thus, assessing spontaneous degradation). Degradation commenced in the dark for 30 min to confirm that adsorption was stable. As a result, few adsorption difference with negligible adsorption properties were observed under a dark state. When the visible light is illuminated, the catalysts started to remove the 4-NP organic pollutant with increasing time. Of the various films, the 0.75g-C3N4@Fe2O3 film exhibited the highest extent of degradation, removing all 4-NP by 300 min. The 1g-C3N4@Fe2O3 film also afforded rapid degradation because of the extensive g-C3N4 coating. However, the thick coating inhibited rapid transfer of solar energy into the catalyst; thus, the 0.75g-C3N4@Fe2O3 film was more effective than the 1g-C3N4@Fe2O3 film. In contrast, the 0.5g and 0.25g-C3N4@Fe2O3 films exhibited activities similar to that of bare Fe2O3 because the g-C3N4 coatings were thin.58 Each absorbance graph monitored the 4-NP absorption peak at 325 nm (Fig. S7†). For comparison, the bulk g-C3N4 was performed for the photocatalytic degradation using 4-NP, exhibiting higher adsorption under the dark condition to be ∼31% but showing almost no degradation for 4-NP. To study the kinetic rate, the 4-NP levels were log-transformed and plotted [Fig. 7(b)]. The degradation followed a pseudo first-order equation [the Langmuir–Hinshelwood (L–H) mechanism],5 mathematically denoted as follows:| −ln(C/Co) = kt | (1) |
Based on eqn (1), plots of −ln(C/Co) versus time were linear; k was the kinetic rate constant (min−1) of catalytic degradation. The correlation coefficient R is shown in Table 1. The kinetic rate constant for 0.75g-C3N4@Fe2O3 (12.71 × 10⁻³ min−1) was ∼15-fold higher than that of bare Fe2O3 (0.83 × 10⁻³ min−1) [Fig. 7(c)]. The k values for 4-NP degradation by 0.25g, 0.5g, 1g-C3N4@Fe2O3 and bulk g-C3N4 were 0.77 × 10⁻³, 1.51 × 10⁻³, 1.19 × 10⁻³, 6.18 × 10⁻³ min−1 and 1.79 × 10⁻³ min−1, respectively. The reason for enhancement of photocatalytic degradation going from bare Fe2O3 and bulk g-C3N4 to g-C3N4@Fe2O3 heterostructure films, could be explained by the photoresponse result shown in Fig. 6(d). As shown in the figure, the heterojunction formed between g-C3N4 and Fe2O3 coated with g-C3N4, shows higher current than those of bare Fe2O3 and bulk g-C3N4, due to the efficient separation of charge carriers as well as reducing recombination rates at its interface. Consequently, g-C3N4@Fe2O3 heterostructure film showed better photodegradation ability with higher kinetic rate constant compared to those of bare Fe2O3 and bulk g-C3N4 film. To explore the reusability of 0.75g-C3N4@Fe2O3 (which exhibited excellent performance), we recycled the film six times [Fig. 7(d)]. The extent of degradation was >80% after each recycle, indicating good reusability. Furthermore, new 0.75g-C3N4@Fe2O3 film was prepared to confirm the repeatability in photodegradation ability under the same condition as shown in Fig. S8.† As a result, it shows similar kinetic rate constant with its error range less than 10%. The 0.75g-C3N4@Fe2O3 film exhibited remarkable photocatalytic degradation of 4-NP, attributable to rapid separation of charge carriers at the g-C3N4@Fe2O3 interface and thus promoting photo-oxidation to successfully remove the organic pollutant using a direct z-scheme pathway.
| k min−1 | R2 | |
|---|---|---|
| 4-Nitrophenol | 0.77 × 10⁻³ | 0.775685 |
| Bare Fe2O3 | 0.83 × 10⁻³ | 0.90604 |
| 0.25g-C3N4@Fe2O3 | 1.51 × 10⁻³ | 0.79317 |
| 0.5g-C3N4@Fe2O3 | 1.19 × 10⁻³ | 0.87725 |
| 0.75g-C3N4@Fe2O3 | 12.71 × 10⁻³ | 0.9439 |
| 1g-C3N4@Fe2O3 | 6.18 × 10⁻³ | 0.95215 |
| Bulk g-C3N4 | 1.79 × 10⁻³ | 0.78454 |
Prior to suggesting possible mechanism of these heterostructures, scavenger tests shown in Fig. 8, are performed to study the photocatalytic reaction in detail. For the photocatalytic activity, there are main free radicals as active species which are hole (h+), hydroxyl radical (·OH) and superoxide radical (·O2−). To observe the radical trapping performances, 0.75g-C3N4@Fe2O3 film was used under light illumination. Here, EDTA·2Na was used to capture a h+, tert-butanol (t-buOH) was used for ·OH and p-benzoquinone (p-BQ) was used for ·O2−. When the photodegradation rate of 0.75g-C3N4@Fe2O3 film itself was approximately 95%, EDTA·2Na and t-buOH scavengers showed 81% and 65% degradation rates, respectively, suggesting h+ and ·OH are not a crucial role in this photocatalytic activity. In contrast, p-BQ scavenger exhibited a significant decrease in 4-NP degradation of 20%. Therefore, it was confirmed that O2− is found to be the main active species that works for 0.75g-C3N4@Fe2O3 film.
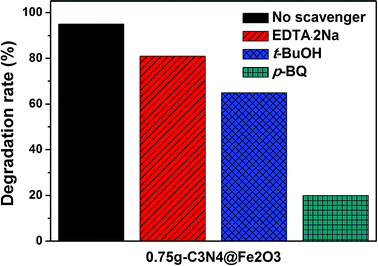 | ||
| Fig. 8 The scavenger test of 0.75g-C3N4@Fe2O3 without radical trapping, EDTA·2Na, t-BuOH and p-BQ under visible irradiation. | ||
3.6 Hydrogen evolution and its possible mechanism
We evaluated hydrogen evolution to further explore the photocatalytic activities of the films under visible illumination. Fig. 9 illustrates H2 production by bulk g-C3N4, bare Fe2O3, and 0.75g-C3N4@Fe2O3 over 4 h. Only the 0.75g-C3N4@Fe2O3 film effectively evolved H2; its performance in this context was excellent. Bulk g-C3N4, made using melamine as precursor and bare Fe2O3, evolved 4.79 μmol h−1 g−1 and 0.94 μmol h−1 g−1 H2, respectively. However, the figure for 0.75g-C3N4@Fe2O3 was 37.06 μmol h−1 g−1, almost 39-fold that of bare Fe2O3. Generally, Fe2O3 does not produce H2 because the conduction level of Fe2O3 is just below the proton reduction potential.59 Even when Pt is added to bare Fe2O3 (as a co-catalyst), H2 evolution remains very low because of rapid recombination of charge carriers. The 0.75g-C3N4@Fe2O3 film forms the optimized interface between Fe2O3 and g-C3N4 for heterojunction, facilitating electron movements due to reducing its recombination rates of charge carriers. Therefore, these results show that the improvement in several properties, like accelerating electron transfer which can subsequently improve the possibility of photoresponse, can be started through 1D structure.60,61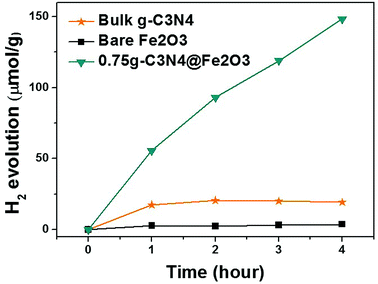 | ||
| Fig. 9 Hydrogen evolution triggered by bulk g-C3N4 from melamine precursors, by bare Fe2O3, and by 0.75g-C3N4@Fe2O3 using Pt as the co-catalyst under visible irradiation. | ||
Based on these results, the mechanisms of g-C3N4@Fe2O3 heterostructures are shown in Fig. 10. Under solar light irradiation, electrons that are generated are transferred elsewhere by the 1D Fe2O3 nanorods, accompanied by recombination losses attributable to the g-C3N4 coating. The heterostructures can be used to degrade organic pollutants, or to produce gaseous fuels. In order to prove Z-type mechanism from the photocatalytic mechanism, the schematics of band diagram for the heterostructure in Fig. 10, can be used. As shown in Fig. 10, the electrons from the valence band of Fe2O3 is excited to the conduction band of Fe2O3 under the light as they are transferred into the valence band of g-C3N4, for its band edge being very close for the electron movement. Again, the excited electrons in g-C3N4 structure react with oxygen, producing superoxide radical to degrade 4-NP on g-C3N4 surface. To prove this point in terms of band edge between Fe2O3 and g-C3N4, we have measured the valence band of each material using XPS analysis (Fig. S9(a)–(c)†) as well as energy band gap from optical absorbance analysis. As a result, we had measured valence band for g-C3N4 to be 1.13 eV while the conduction band for Fe2O3 was estimated to be 0.62 eV based on the energy band gap measurement (Fig. 5), proving fairly close band edge between Fe2O3 and g-C3N4 with Z-type mechanism. Fig. 10(b) shows the 4-NP degradation mechanism. Under visible light, photogenerated electrons from the Fe2O3 conduction band are transferred to the valence band of g-C3N4, exciting other photogenerated electrons into the g-C3N4 conduction band. The resulting holes in Fe2O3 react with H2O and OH− to produce ·OH radicals on the surface of Fe2O3. Moreover, the photogenerated electrons in Fe2O3 react with oxygen molecules at the surface of Fe2O3 to produce H2O2. ·OH radicals facilitate the removal of 4-NP organic pollutant. Also, electrons from the g-C3N4 conduction level react with oxygen on the surface of g-C3N4, producing ·O2− and allowing 4-NP to be degraded to water.44 From the scavenger test, the main active species in this reaction system is observed to be ·O2− species.62 When H2 is evolved by heterostructures, the direct z-scheme can be used to explain the mechanism detailed previously63 [Fig. 10(c)]. When producing H2 using Fe2O3 and g-C3N4, TEOA features hole capture, accelerating electron transfer throughout Pt, and, finally, H2 production. Therefore, the g-C3N4@Fe2O3 heterostructures feature separation of charge carriers at the interface, effectively enriching photocatalytic activities and thus allowing 4-NP degradation and H2 evolution.
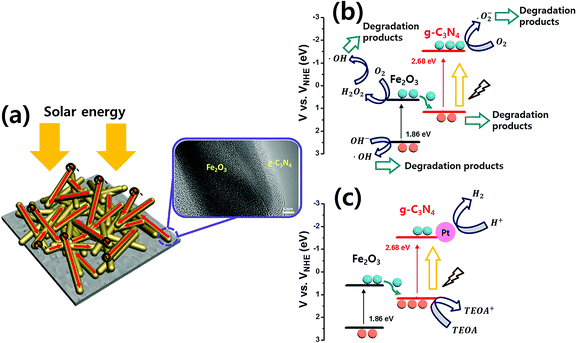 | ||
| Fig. 10 The direct z-scheme mechanism of 0.75g-C3N4@Fe2O3 heterostructures showing (a) a graphical schematics, bandgap energy diagrams for (b) photocatalytic degradation and (c) H2 evolution. | ||
4. Conclusion
We successfully synthesized 1D g-C3N4@Fe2O3 nanorod/film heterostructures using a solvothermal method, to align the Fe2O3 nanorod film and thermal evaporation to ensure uniform g-C3N4 coating of the film. The thickness of the g-C3N4 coat varied morphologically by the amount of g-C3N4 added compared to bare Fe2O3 All samples exhibited properties on XRD, FT-IR, Raman spectroscopy, and XPS analysis compatible with reliable formation of g-C3N4@Fe2O3 heterostructures. Bare Fe2O3 exhibited poor electron transfer because of rapid recombination of charge carriers. The g-C3N4 coating of Fe2O3 films increased the photoresponse performance, as revealed by transient photocurrent, LSV, and EIS measurements. Furthermore, the 4-NP-degrading photocatalytic activity of g-C3N4 coated Fe2O3 films under visible light was much more rapid than that afforded by bare Fe2O3. Of the various heterostructures, the 0.75g-C3N4@Fe2O3 film exhibited excellent 4-NP degradation for up to 300 min, with a kinetic rate constant of 12.71 × 10⁻³ min−1, along with stable recyclability. We also evaluated H2 evolution caused by photocatalytic activity during 4 h of irradiation with visible light. The 0.75g-C3N4@Fe2O3 film produced 37.06 μmol h−1 g−1 of H2, 39-fold higher than that produced by bare Fe2O3, suggesting that charge separation was efficient and that accumulated electrons accelerated H2 evolution via a direct z-scheme mechanism. Heterostructures composed of g-C3N4 coated onto 1D Fe2O3 nanorods exhibited remarkable photocatalytic activity under visible illumination; electron transfer through 1D structure and charge separation were highly efficient.Conflicts of interest
There are no conflicts to declare.Acknowledgements
This work was supported by a National Research Foundation of Korea (NRF) grant funded by the Korean government (Ministry of Education) (no. NRF-2016R1D1A1A02936936), the NRF grant funded by the Korean government (MEST) (no. NRF-2018R1A2A1A13078704) and supported by the Human Resources Development Program (grant no. 20174030201830) of the Korea Institute of Energy Technology Evaluation and Planning (KETEP) funded by the Korean Ministry of Trade, Industry, and Energy. The English in this document has been checked by at least two professional editors, both native speakers of English.References
- J. Ran, M. Jaroniec and S. Z. Qiao, Adv. Mater., 2018, 30, 1–31 Search PubMed.
- J. Potočnik, Scinece, 2007, 315, 810 CrossRef PubMed.
- J. Gu, J. Yan, Z. Chen, H. Ji, Y. Song, Y. Fan, H. Xu and H. Li, Dalton Trans., 2017, 46, 11250–11258 RSC.
- A. Boudjemaa, A. Rebahi, B. Terfassa, R. Chebout, T. Mokrani, K. Bachari and N. J. Coville, Sol. Energy Mater. Sol. Cells, 2015, 140, 405–411 CrossRef CAS.
- X. Liu, L. Zhao, H. Lai, S. Li and Z. Yi, J. Chem. Technol. Biotechnol., 2017, 92, 2417–2424 CrossRef CAS.
- Y. H. Li, Y. Wang, L. R. Zheng, H. J. Zhao, H. G. Yang and C. Li, Appl. Catal., B, 2017, 209, 247–252 CrossRef CAS.
- N. A. Romero and D. A. Nicewicz, Chem. Rev., 2016, 116, 10075–10166 CrossRef CAS PubMed.
- S. Peiris, J. McMurtrie and H.-Y. Zhu, Catal. Sci. Technol., 2016, 6, 320–338 RSC.
- H. Hou, F. Gao, L. Wang, M. Shang, Z. Yang, J. Zheng and W. Yang, J. Mater. Chem. A, 2016, 4, 6276–6281 RSC.
- A. Ali and W.-C. Oh, J. Korean Ceram. Soc., 2017, 54, 308–313 CrossRef CAS.
- S. Li, X. Shen, J. Liu and L. Zhang, Environ. Sci.: Nano, 2017, 4, 1155–1167 RSC.
- S. Li, S. Hu, W. Jiang, Y. Liu, J. Liu and Z. Wang, J. Colloid Interface Sci., 2017, 501, 156–163 CrossRef CAS PubMed.
- S. Li, S. Hu, W. Jiang, Y. Liu, Y. Zhou, Y. Liu and L. Mo, J. Colloid Interface Sci., 2018, 521, 42–49 CrossRef CAS PubMed.
- S. Ye, R. Wang, M.-Z. Wu and Y.-P. Yuan, Appl. Surf. Sci., 2015, 358, 15–27 CrossRef CAS.
- A. Kudo and Y. Miseki, Chem. Soc. Rev., 2009, 38, 253–278 RSC.
- L. Zhang and M. Jaroniec, Appl. Surf. Sci., 2018, 430, 2–17 CrossRef CAS.
- J. Zhang, G. Xiao, F.-X. Xiao and B. Liu, Mater. Chem. Front., 2017, 1, 231–250 RSC.
- S. Li, S. Hu, W. Jiang, Y. Liu, Y. Liu, Y. Zhou, L. Mo and J. Liu, Beilstein J. Nanotechnol., 2018, 9, 1308–1316 CrossRef CAS PubMed.
- D. M. Arias-Rotondo and J. K. McCusker, Chem. Soc. Rev., 2016, 45, 5803–5820 RSC.
- J. Low, C. Jiang, B. Cheng, S. Wageh, A. A. Al-Ghamdi and J. Yu, Small Methods, 2017, 1, 1700080 CrossRef.
- P. Zhou, J. Yu and M. Jaroniec, Adv. Mater., 2014, 26, 4920–4935 CrossRef CAS PubMed.
- H. Li, W. Tu, Y. Zhou and Z. Zou, Adv. Sci., 2016, 3, 1500389 CrossRef PubMed.
- H. Katsumata, T. Sakai, T. Suzuki and S. Kaneco, Ind. Eng. Chem. Res., 2014, 53, 8018–8025 CrossRef CAS.
- J. C. Wang, L. Zhang, W. X. Fang, J. Ren, Y. Y. Li, H. C. Yao, J. S. Wang and Z. J. Li, ACS Appl. Mater. Interfaces, 2015, 7, 8631–8639 CrossRef CAS PubMed.
- J. Zhang, Y. Hu, X. Jiang, S. Chen, S. Meng and X. Fu, J. Hazard. Mater., 2014, 280, 713–722 CrossRef CAS PubMed.
- S. Kang, R. C. Pawar, T. J. Park, J. G. Kim, S.-H. Ahn and C. S. Lee, J. Korean Ceram. Soc., 2016, 53, 393–399 CrossRef CAS.
- M. Zhang, Y. Duan, H. Jia, F. Wang, L. Wang, Z. Su and C. Wang, Catal. Sci. Technol., 2017, 7, 452–458 RSC.
- Y. Liao, S. Zhu, J. Ma, Z. Sun, C. Yin, C. Zhu, X. Lou and D. Zhang, ChemCatChem, 2014, 6, 3419–3425 CrossRef CAS.
- K. S. Lakhi, D. H. Park, K. Al-Bahily, W. Cha, B. Viswanathan, J. H. Choy and A. Vinu, Chem. Soc. Rev., 2017, 46, 72–101 RSC.
- Y. Wang, J. Sun, J. Li and X. Zhao, Langmuir, 2017, 33, 4694–4701 CrossRef CAS PubMed.
- R. Cheng, L. Zhang, X. Fan, M. Wang, M. Li and J. Shi, Carbon, 2016, 101, 62–70 CrossRef CAS.
- J. Yu, S. Wang, J. Low and W. Xiao, Phys. Chem. Chem. Phys., 2013, 15, 16883–16890 RSC.
- B. Lin, C. Xue, X. Yan, G. Yang, G. Yang and B. Yang, Appl. Surf. Sci., 2015, 357, 346–355 CrossRef CAS.
- X.-j. Wang, C. Liu, X.-l. Li, F.-t. Li, Y.-p. Li, J. Zhao and R.-h. Liu, Appl. Surf. Sci., 2017, 394, 340–350 CrossRef CAS.
- S. Shen, S. A. Lindley, X. Chen and J. Z. Zhang, Energy Environ. Sci., 2016, 9, 2744–2775 RSC.
- M. Imran, A. B. Yousaf, P. Kasak, A. Zeb and S. J. Zaidi, J. Catal., 2017, 353, 81–88 CrossRef CAS.
- J. Wang, J. L. Waters, P. Kung, S. M. Kim, J. T. Kelly, L. E. McNamara, N. I. Hammer, B. C. Pemberton, R. H. Schmehl, A. Gupta and S. Pan, ACS Appl. Mater. Interfaces, 2017, 9, 381–390 CrossRef CAS PubMed.
- J. Wang, C. Qin, H. Wang, M. Chu, A. Zada, X. Zhang, J. Li, F. Raziq, Y. Qu and L. Jing, Appl. Catal., B, 2018, 221, 459–466 CrossRef CAS.
- X. She, J. Wu, H. Xu, J. Zhong, Y. Wang, Y. Song, K. Nie, Y. Liu, Y. Yang, M.-T. F. Rodrigues, R. Vajtai, J. Lou, D. Du, H. Li and P. M. Ajayan, Adv. Energy Mater., 2017, 7, 1700025 CrossRef.
- Y. Xu, S. Huang, M. Xie, Y. Li, H. Xu, L. Huang, Q. Zhang and H. Li, RSC Adv., 2015, 5, 95727–95735 RSC.
- S. Hu, R. Jin, G. Lu, D. Liu and J. Gui, RSC Adv., 2014, 4, 24863 RSC.
- H.-M. Xu, H.-C. Wang, Y. Shen, Y.-H. Lin and C.-W. Nan, J. Appl. Phys., 2014, 116, 174307 CrossRef.
- L. Wang, X. Lu, C. Han, R. Lu, S. Yang and X. Song, CrystEngComm, 2014, 16, 10618–10623 RSC.
- H. Lin, Y. Liu, J. Deng, S. Xie, X. Zhao, J. Yang, K. Zhang, Z. Han and H. Dai, J. Photochem. Photobiol., A, 2017, 336, 105–114 CrossRef CAS.
- J.-Y. Lee, M.-C. Tsai, P.-C. Chen, T.-T. Chen, K.-L. Chan, C.-Y. Lee and R.-K. Lee, J. Phys. Chem. C, 2015, 119, 25754–25760 CrossRef CAS.
- Y. Li, X. Wei, B. Zhu, H. Wang, Y. Tang, T. C. Sum and X. Chen, Nanoscale, 2016, 8, 11284–11290 RSC.
- X. Wang, Y. Liang, W. An, J. Hu, Y. Zhu and W. Cui, Appl. Catal., B, 2017, 219, 53–62 CrossRef CAS.
- P. V. Zinin, L.-C. Ming, S. K. Sharma, V. N. Khabashesku, X. Liu, S. Hong, S. Endo and T. Acosta, Chem. Phys. Lett., 2009, 472, 69–73 CrossRef CAS.
- T. Wang, Y. Li, L. Wang, C. Liu, S. Geng, X. Jia, F. Yang, L. Zhang, L. Liu, B. You, X. Ren and H. Yang, RSC Adv., 2015, 5, 60114–60120 RSC.
- J. Di, J. Xia, S. Yin, H. Xu, L. Xu, Y. Xu, M. He and H. Li, J. Mater. Chem. A, 2014, 2, 5340 RSC.
- D. Chen, W. Wei, R. Wang, J. Zhu and L. Guo, New J. Chem., 2012, 36, 1589 RSC.
- J. Wang, B. Feng, J. Su and L. Guo, ACS Appl. Mater. Interfaces, 2016, 8, 23143–23150 CrossRef CAS PubMed.
- L. Liu, J. Wang, C. Wang and G. Wang, Appl. Surf. Sci., 2016, 390, 303–310 CrossRef CAS.
- Y. Yan, H. Tang, F. Wu, R. Wang and M. Pan, Energies, 2017, 10, 1–13 CrossRef CAS.
- N. M. Abdul Rashid, C. Haw, W. Chiu, N. H. Khanis, A. Rohaizad, P. Khiew and S. Abdul Rahman, CrystEngComm, 2016, 18, 4720–4732 RSC.
- D. Li, W. Wang, D. Jiang, Y. Zheng and X. Li, RSC Adv., 2015, 5, 14374–14381 RSC.
- Y. Liu, F.-Y. Su, Y.-X. Yu and W.-D. Zhang, Int. J. Hydrogen Energy, 2016, 41, 7270–7279 CrossRef CAS.
- J. Zhang, M. Vasei, Y. Sang, H. Liu and J. P. Claverie, ACS Appl. Mater. Interfaces, 2016, 8, 1903–1912 CrossRef CAS PubMed.
- S. Zhu, F. Yao, C. Yin, Y. Li, W. Peng, J. Ma and D. Zhang, Microporous Mesoporous Mater., 2014, 190, 10–16 CrossRef CAS.
- A. Annamalai, P. S. Shinde, A. Subramanian, J. Y. Kim, J. H. Kim, S. H. Choi, J. S. Lee and J. S. Jang, J. Mater. Chem. A, 2015, 3, 5007–5013 RSC.
- L. Jia, J. Xie, C. Guo and C. M. Li, RSC Adv., 2015, 5, 62611–62618 RSC.
- K. C. Christoforidis, T. Montini, E. Bontempi, S. Zafeiratos, J. J. D. Jaén and P. Fornasiero, Appl. Catal., B, 2016, 187, 171–180 CrossRef CAS.
- Y.-p. Li, F.-t. Li, X.-j. Wang, J. Zhao, J.-n. Wei, Y.-j. Hao and Y. Liu, Int. J. Hydrogen Energy, 2017, 42, 28327–28336 CrossRef CAS.
Footnote |
| † Electronic supplementary information (ESI) available. See DOI: 10.1039/c8ra04499f |
| This journal is © The Royal Society of Chemistry 2018 |

