
 Open Access Article
 This Open Access Article is licensed under a Creative Commons Attribution-Non Commercial 3.0 Unported Licence
Exfoliation, point defects and hydrogen storage properties of monolayer TiS3: an ab initio study
M. Yu. Arsentev *a,
A. V. Petrovb,
A. B. Missyulc and
M. Hammourid
*a,
A. V. Petrovb,
A. B. Missyulc and
M. Hammourid
aInstitute of Silicate Chemistry, Russian Academy of Sciences, St. Petersburg 199034, Russia. E-mail: ars21031960@gmail.com
bChemistry Department, Saint Petersburg State University, Universitetsky pr. 26, Petrodvorets, 198504 Saint Petersburg, Russia
cALBA Synchrotron Light Source, Carrer de la Llum 2-26, 08290, Cerdanyola del Vallès, Barcelona, Spain
dDepartment of Physics and Astronomy, California State University, Los Angeles, California 90032, USA
First published on 20th July 2018
Abstract
The possibility of H2 molecule adsorption on the basal plane of monolayer TiS3 at various sites has been studied. Among the studied adsorption sites, few sites were found to be suitable for physisorption with binding energy up to 0.10 eV per H2. To increase the activity of hydrogen sorption, the possibility of generating S-vacancies, by removing sulfur atoms from the basal plane of monolayer TiS3, was investigated. Despite the fact that the structures containing vacancies were found to be stable enough, there was no increase in the activity towards hydrogen adsorption. The same effect was obtained with the use of common methods of increasing of the H2 adsorption energy: the decoration of the two-dimensional material with alkali metals (Li, Na). This might be caused by the negatively charged surfaces of single layer TiS3, which hinder the increase in binding by alkali metals through a weak electrostatic interaction.
1. Introduction
Transition metal dichalcogenides (TMDC) with formula MX2 that refers to a metal atom (M) sandwiched between two layers of chalcogen atoms (X) form two-dimensional (2D) honeycomb structures. The remarkable properties of TMDCs lead to a wide range of applications, including in optoelectronics, transistors, energy storage, solar cells, and catalysts.1–5 Currently, it is not possible to find an efficient environment for storing hydrogen under normal conditions.6–8 The developed hydrogen storage system must have high values of gravimetric and volumetric capacities at room temperature and ambient pressure. Moreover, the US Department of Energy (DOE) has set the following targets for efficient hydrogen storage materials: (1) the gravimetric and volumetric capacities should be at least 7.5 wt% and 70 g l−1, respectively, (2) the operating temperature range from −40 °C to 60 °C, (3) safety and durability (1500 operation cycles).9 In addition, the adsorption energy values should be in the range of −0.2 to −0.7 eV per H2.10 This range of adsorption energy values is intermediate between physical adsorption and chemisorption and is ideally suited for hydrogen storage under ambient pressure and temperature. Kubas interaction, as well as weak electrostatic interaction exhibit binding energy in this range.11,12 To achieve these parameters, scientists have carried out theoretical and experimental studies to many of materials capable for hydrogen storage. Early research was based on metal hydrides,13 while other materials such as graphene,14,15 fullerenes16,17 and carbon nanotubes18 are rapidly developing, since they have a high specific surface area, fast kinetics, and reversibility of the adsorption of hydrogen molecules. However, H2 molecules bind weakly to pure graphene, which is chemically too inert to act as a promising material for hydrogen storage.19,20 To increase the chemical activity of graphene, attempts are made such as doping21 and decorating.22–26 Since graphene showed satisfactory characteristics, other graphene materials attracted the attention of researchers. Examples including silicene,27–29 monolayer black phosphorus,30 arsenene31 and porous graphene.10,21,24,32 The other potential materials are metal–organic compounds,33,34 monolayers of MoS2,35 Cr2C36 and transition metal hydrazides.37–39 Among them, two dimensional (2D) materials are gaining attention due to their large surface area to volume ratio. Such 2D systems act as substrates onto which the metal atoms are to be dispersed to adsorb H2 molecules through different mechanisms. Alkali atoms tend to attract H2 molecules via electrostatic interaction, while transition metals adsorb H2 through the Kubas interaction.40–44 Some examples are Sc-decorated porous graphene,24 calcium-decorated graphene-based nanostructures,26 Li-decorated MoS2.35 However, the search of materials that can meet these requirements is still an urgent task. For example, it was found that the binding energy per Li atom on graphene is weaker than Li cohesive energy, and it tend to clustering.14 Thus, a two-dimensional material with a more chemically active surface is needed in order to bind the decorating metal and distribute it evenly along the surface. There are many other materials potentially capable of demonstrating this property,45,46 such as graphane functionalized by polylithiated species,47 biphenylene carbon functionalized with alkali and alkaline earth metals,48 Li-doped defective graphene with B substitution,49 Li-decorated defective phosphorene50 and Li decorated two-dimensional C2N.51 Among them, the hydrogen storage properties of 2D crystals based on transition metal chalcogenides, which has been studied less intensively. The properties of monolayer TiS3, which was found to be stable using full phonon dispersion spectrums, are unexplored.52 Bulk TiS3 proved to be promising as a cathode material for lithium, sodium, and magnesium batteries.52–55The creation of sulfur vacancies in transition metal sulphides is an effective way of increasing their catalytic activity, as shown, for example, in the work on MoS2.56 This could make TiS3 reactive towards hydrogen adsorption through the creation of more active sites. Experimental generation of sulfur vacancies in TiS3 can be performed using methods that have proven to be successful in creating sulfur vacancies in other sulphides of transition metals, like etching,57,58 argon plasma59 and electrochemical desulfurization.60
In this study we have chosen lithium and sodium, since lithium is light element, which is important for gravimetric capacity, and is also a classic example for creating systems storing hydrogen. Sodium is a cheap analogue of lithium, just as it is now recognized in the field of electrochemical batteries.
In this work, we present a first-principles computational study of the monolayer TiS3 as a potential candidate for an efficient hydrogen storage. To increase the chemical activity, the creation of single and double vacancies in the sulfur sublattice, decorating with Li and Na will be used.
2. Methods
In this study, we investigated the stability of single and double sulphur vacancies in monolayer TiS3. If not otherwise noted, we used a 2 × 3 × 1 supercell whose height was 20 Å. For single and double sulphur vacancies, the supercells correspond to x = 0.0833 and 0.1667 in TiS3−x, respectively. The spin-polarized calculations of the electronic structural properties were carried out using Quantum ESPRESSO code.61 The exchange-correlation energy functional was evaluated using the generalized gradient approximation (GGA) parameterized by Perdew, Burke, and Ernzerhof.62 We employed the Kleinman–Bylander63 form of norm-conserving ultrasoft Vanderbilt pseudopotentials.64 A plane-wave cutoff of 530 eV was used, and a Monkhorst–Pack 3 × 3 × 1 k-point grid was used to sample the Brillouin zone. The lattice parameters of TiS3 were found to be a = 4.929 Å, b = 3.392 Å and c = 8.786 Å, in a close agreement with the experimental values of a = 4.948 Å, b = 3.379 Å and c = 8.748 Å (Table 1).65 The geometry of the crystal cell was optimized with BFGS66 algorithm. The van der Waals density functional (vdW-DF), a method based on the one proposed by Guillermo Roman-Perez and Jose M. Soler,67 was used for geometry optimization and calculation of sorption energies of hydrogen molecules. We relaxed atomic positions and lateral dimensions of the (2 × 3) TiS3 layer with and without vacancy structures until all components of forces acting on each atom reach 0.01 eV Å−1 and the structures are stress-free. The convex hull graphs were plotted using data which were retrieved from the Materials Project database,68 the Python Materials Genomic (pymatgen) package,69 through the Materials API framework.70| Optimized | Experiment65 | |
|---|---|---|
| a | 4.929 | 4.948 |
| b | 3.392 | 3.379 |
| c | 8.786 | 8.748 |
The formation energy per vacancy of n sulfur vacancies is defined by:
 | (1) |
To analyze the peculiarities of the adsorption of Li/Na atom on the monolayer TiS3, we calculated the binding energy using the following equation:
| Eb,Li/Na = ETiS3 + ELi/Na − ETiS3–Li/Na | (2) |
The adsorption energy of the nth hydrogen molecule, Eads,nth H2, is calculated using
 | (3) |
 is the energy of the system (pristine monolayer TiS3, TiS3 covered with Li/Na or TiS3 with S vacancies) with (n − 1)H2 molecules adsorbed and EH2 is the energy of a single hydrogen molecule.
The average adsorption energy per hydrogen molecule, 〈Eads,H2〉, is calculated via
 | (4) |
3. Results and discussion
A full geometry optimization of both atomic coordinates and lattice parameters for the bulk and monolayer TiS3 were first performed. The use of van der Waals density functional (vdW-DF) functional allow us to reach a very close agreement with the experimental value of parameter c (Table 1).65,67 Fig. 1 shows the structure of TiS3 (space group P21/m). The structure contains a single-bonded disulfide ion (S22−), labeled in the figure as S2–S3, and the third sulfur atom which is formally sulfide (S2−) (S1). The single layer of TiS3 differs from that of the most widely studied monolayer transition metal dichalcogenides (TaS2, WS2, WSe2, TaSe2, etc.),71–75 including TiS2,76 where there are no dichalcogenide ions. These structural features of TiS3 can affect the sorption of hydrogen by the surface in its monolayer state, the interaction of hydrogen molecules with the surface and the appearance of the configurations of adsorbed hydrogen molecules.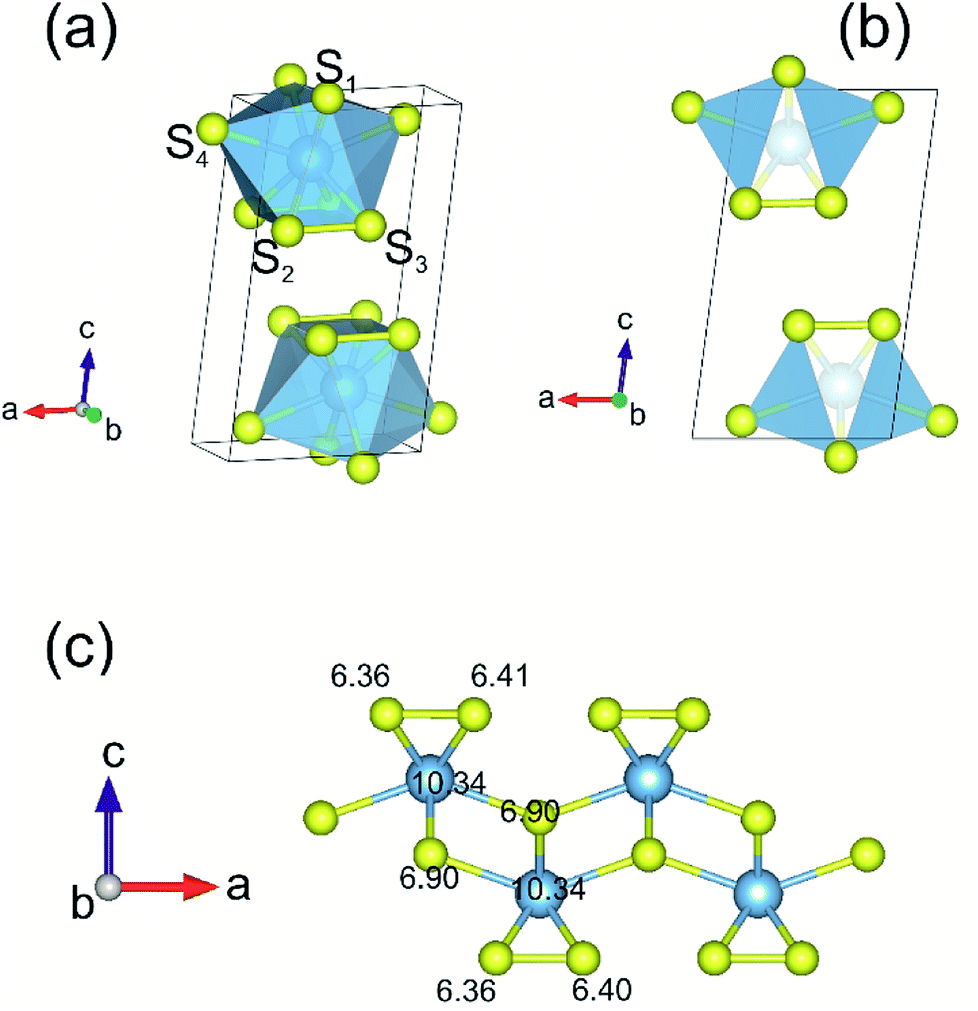 | ||
| Fig. 1 (a) Structure of TiS3. The blue and yellow balls represent the Ti and S atoms, respectively. S1 is sulfide (S2−), and S2 and S3 are disulfide (S22−). (b) Side view of bulk TiS3. The calculated valence charges on the inner and outer S and Ti atoms for monolayer TiS3 are also shown (c). | ||
Charge density analysis is an efficient tool to discuss the characters of the interatomic interactions and bonding. Bader charge analysis shows a significant amount of charge is transferred from Ti to the S atoms. While the S atoms at the surface share 0.8 electrons donated by the underlying Ti atom, 0.9 electron transfer occurs from Ti to S atom in the middle, in agreement with the work of Iyikanat et al.77 It is also worth mentioning that the negatively charged surface of monolayer TiS3 may find interesting applications such as nanoscale lubricants and charged coatings, and this feature can certainly affect the sorption of hydrogen by systems containing the alkali cations which adsorb H2 by the electrostatic interaction route.
For the study of structural changes taking place when peeling off a single layer TiS3 and to estimate the peeling energy, we constructed a set of cells based on the structure of TiS3 with interlayer distance being set by hand. The atoms and structure were then allowed to relax to reach an equilibrium positions with c fixed, so as to obtain a binding energy curve as a function of the c-axis length as shown in Fig. 2c. As expected, the structural changes of TiS3 when exfoliating the monolayer TiS3 are small (Fig. 2a,b). If to calculate in percent, then the change in the parameter a is −0.4%, while the parameter b – −0.8%. Thus, although the changes in parameters a and b are negligible, the contraction of the structure along the b-axis is twice as large as along the direction of the a-axis.
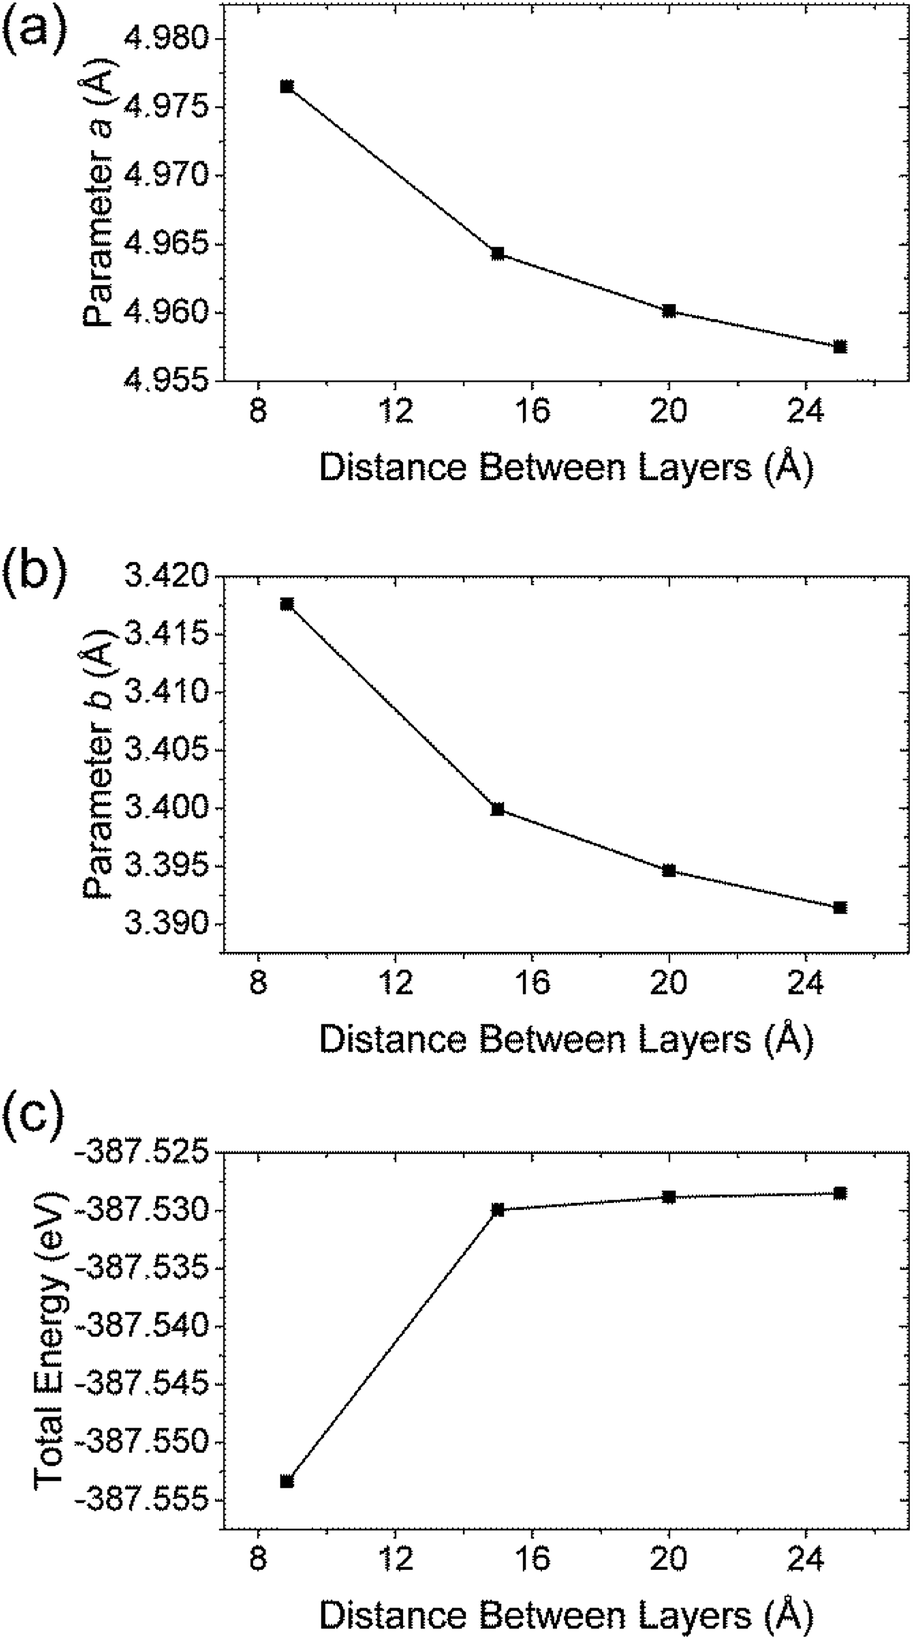 | ||
| Fig. 2 The dependence of (a) parameter a, (b) parameter b and (c) total energy vs. spacing between layers in TiS3. | ||
The peeling energy per area S of monolayer TiS3 was calculated using:
 | (5) |
 and
and  are the total energy of bulk TiS3 and TiS3 with infinite distance between layers, respectively. In the latter case the total energy of a cell with a distance between layers sufficient to neglect the interaction between them (25 Å) was used. The value of the peeling energy calculated by us is 19.901 eV, which corresponds to the values of energies for most systems obtained by Björkman et al. (around 20 meV Å−2).78 Such universality explains the successful exfoliation of a wide class of layered materials to produce two-dimensional systems. Unfortunately, in Björkman's work, values for trichalcogenides were not calculated. The value of the peeling energy for TiS2 calculated in his work is 24.552 eV and gradually decreases with increasing atomic weight of the chalcogenide atom (22.952 eV for TiSe2 and 22.016 eV for TiTe2).78 Nevertheless, we have a somewhat smaller value for TiS3 here, which indicates a greater ease of exfoliation.
The experimental work of Barawi et al. of the hydrogen storage of monolayer TiS3 showed that it is hard to absorb hydrogen for hydrogen pressures up to 80 bar and reaction temperatures up to 300 °C.79 Thus, more detailed studies of the process of hydrogen adsorption by pure two-dimensional TiS3 sheets were carried out by computer simulation. To increase the chemical activity of titanium, we also investigated the effect of creation of single and double vacancies in the sulfur sublattice on the hydrogen storage properties of monolayer TiS3. A 2 × 3 × 1 supercell was used as the base simulation cell. To create a single vacancy in the sulfur sublattice, there are only two non-equivalent positions (S1 and S2 as indicated in Fig. 1a). In the case of double vacancies, the situation is different. It is necessary to consider all possible variants of the relative locations of the two sulfur vacancies. For this purpose, the Python Materials Genomic (pymatgen) package80 was used to generate a set of 70 supercells. These supercells were used in Quantum ESPRESSO, followed by geometry optimization. The obtained total energy values for the supercells containing single and double vacancies were used to calculate the energy above hull (Ehull) parameter (see Methods section). This parameter indicates the thermodynamic stability of the material, and equals the thermodynamic decomposition energy of the compound.80–83 The zero Ehull indicates stability, while greater than 100 meV per atom indicates driving force to form other phases, which may be reflected as difficulty in synthesizing a compound, or as decomposition.83 According to the work of Sun et al.83 the energy difference of 100 meV/atom between thermodynamically metastable compounds and thermodynamically stable phases can be overcome by entropy ΔS of 10 J mol−1 K−1 at ∼1000 K, ∼10 GPa pressure or ∼10 nm particle size. Thus, the energy above hull (Ehull) parameter indicates the thermodynamic stability of TiS3 containing sulfur vacancies and its tendency to decompose into more stable phases.
Fig. 3 displays the energy above the convex ground state energy hull (Ehull) of TiS3−x (x = 0, 0.0833 and 0.1667) with respect to the Ti–S binary phase diagram. The decomposition products and Ehull values for each of the compositions are listed in Table 2, and calculated for compounds, suggested as stable by Materials Project resources.68 From Table 2, it follows that the products of decomposition of monolayer TiS3 containing sulfur vacancies can be TiS3 and TiS2. However, the Ehull values are small enough so that it does not happen (Ehull ∼ 100 meV per atom). In addition, from the Ehull graph, the increase in the concentration of vacancies gradually increases stability (Ehull values approach 0.100 eV per atom). The Ehull value for monolayer TiS3 is not zero (Fig. 3, Table 2), since the energy is required to exfoliate the monolayer TiS3 from bulk TiS3. For supercell containing one sulfur vacancy (x = 0.0833 in TiS3−x, Fig. 3), there is a significant difference in the stability of the sulfur vacancy located at positions S1 and S2. This is because the extraction of sulfur from the surface of the monolayer TiS3 (S2) is less energy-intensive than from its central part (S1). The optimized most stable structures of TiS3 containing sulfur vacancies are shown in Fig. 4. When the single S vacancy is created, the lattice vectors of 2 × 3 × 1 supercell change to a = 10.379 Å and b = 10.699 Å. Thus, the presence of the S vacancy leads to a minute expansion of the lattice vectors of TiS3. Our calculated results show that the formation energy of S vacancy is 3.87 eV, in agreement with Iyikanat et al. work.77 In the case of the content of two vacancies in the supercell, there is no clustering of vacancies (Fig. 4b and d). This is in contrast with a computer simulation results for monolayer MoS2,56,60 where S vacancies were found to form in clusters. Tsai et al.60 suggested that this is because it is more exergonic to form a vacancy close to an existing one. These results were confirmed by experiments on electrochemical desulfurization of the MoS2 basal plane.60 However, there are other experiments where S-vacancies are evenly spread out in MoS2 nanosheet, such as Ar-plasma treatment.84 In the case of double sulfur vacancies in TiS3, the formation energies of possible vacancies of S, Ti, TiS, and double S were calculated by Iyikanat et al. via total energy optimization calculations.77 In that work, Iyikanat et al. found that the formation of single S vacancy was the most likely one among the considered vacancy types. Our results are in agreement with Iyikanat et al. work: S vacancies are well separated from each other, on the opposite sides of the TiS3 nanosheet (Fig. 4b and d). Compared to the defect-free structure, when both one and two S atoms are removed, the changes in lattice parameters are remarkable (Table 3). The formation energy of two S vacancies in the 2 × 3 × 1 supercell is 2.70 eV per vacancy. Using eqn (2), the formation energies of one and two vacancies in the TiS3 2 × 3 × 1 supercell were calculated, which corresponds to the compositions of TiS3−x (x = 0.0833 and 0.1667), respectively (Fig. 5). The dependence of the formation energy on the concentration of vacancies is in contrast to that of MoS2, where the variation of formation energy is not large.56
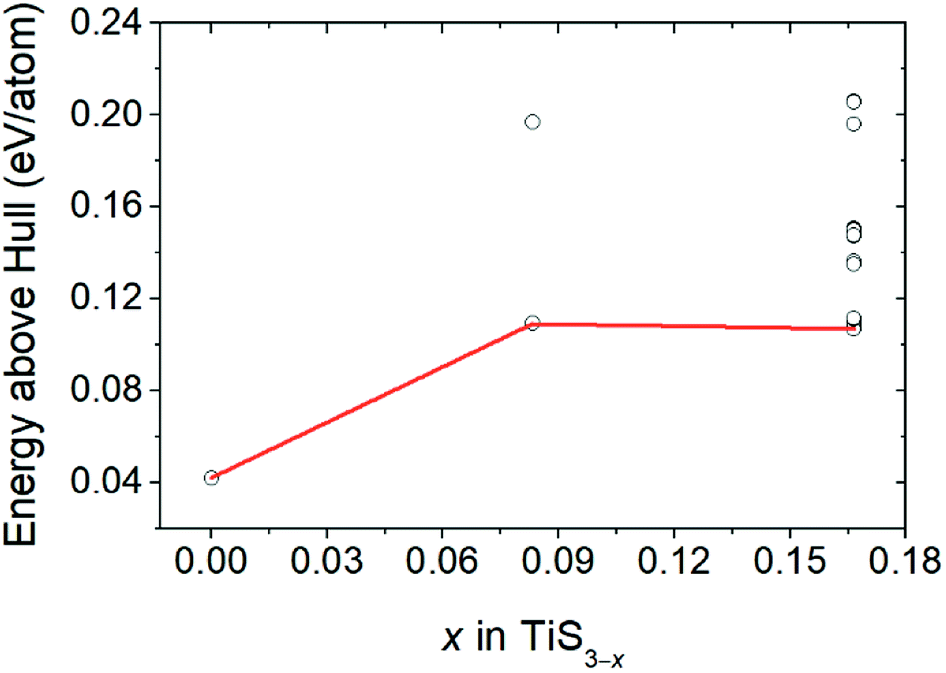 | ||
| Fig. 3 Energy above hull (Ehull) values for TiS3 containing sulfur vacancies (TiS3−x (x = 0, 0.0833 and 0.1667)). | ||
| Composition | Ehull | Decomposition products |
|---|---|---|
| Monolayer TiS3 | 0.042 | TiS3 |
| Monolayer TiS2.917 | 0.109 | TiS3 + TiS2 |
| Monolayer TiS2.833 | 0.107 | TiS3 + TiS2 |
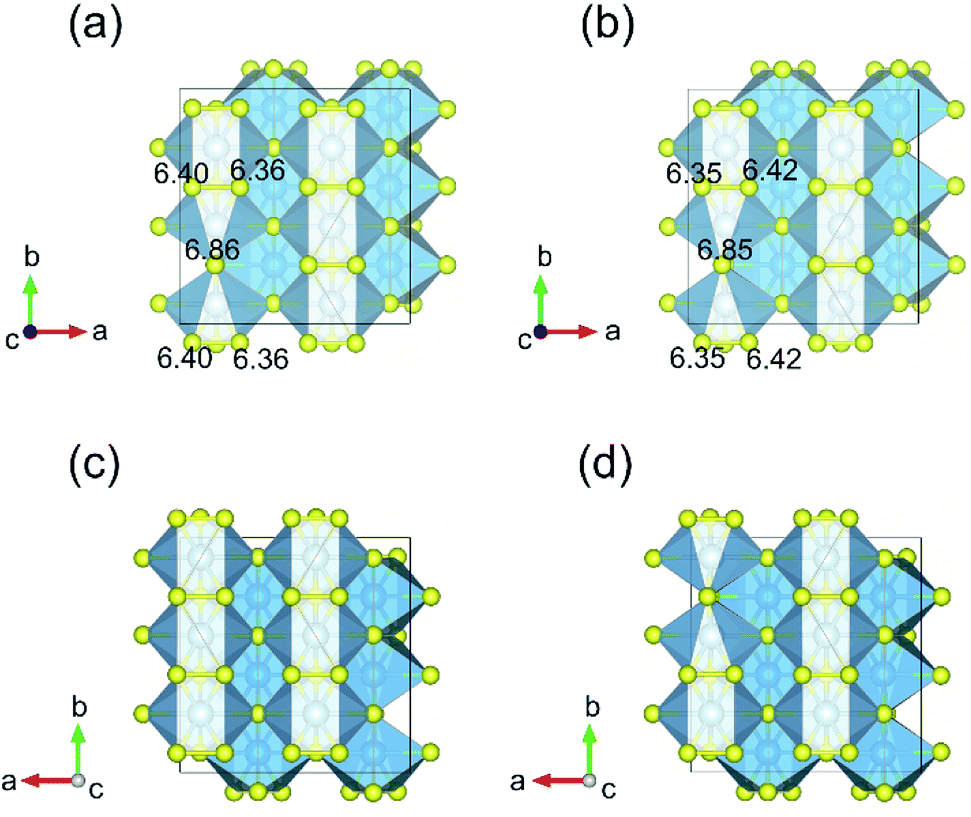 | ||
| Fig. 4 Top (a and b) and bottom (c and d) views of the geometry optimized structures of 2 × 3 × 1 supercell, containing one and two sulfur vacancies, respectively. Numbers denote the valence charges on S atoms in the vicinity of the S vacancy. | ||
| a/b (Å) | Ef (eV) | Eb (eV) | |
|---|---|---|---|
| Pristine TiS3 | 9.858/10.176 | — | — |
| One S vacancy | 10.379/10.699 | 3.87 | — |
| Two S vacancies | 10.128/10.695 | 2.70 | — |
| Li decorated TiS3 | 10.352/10.453 | — | 1.12 |
| Na decorated TiS3 | 10.275/10.529 | — | 0.73 |
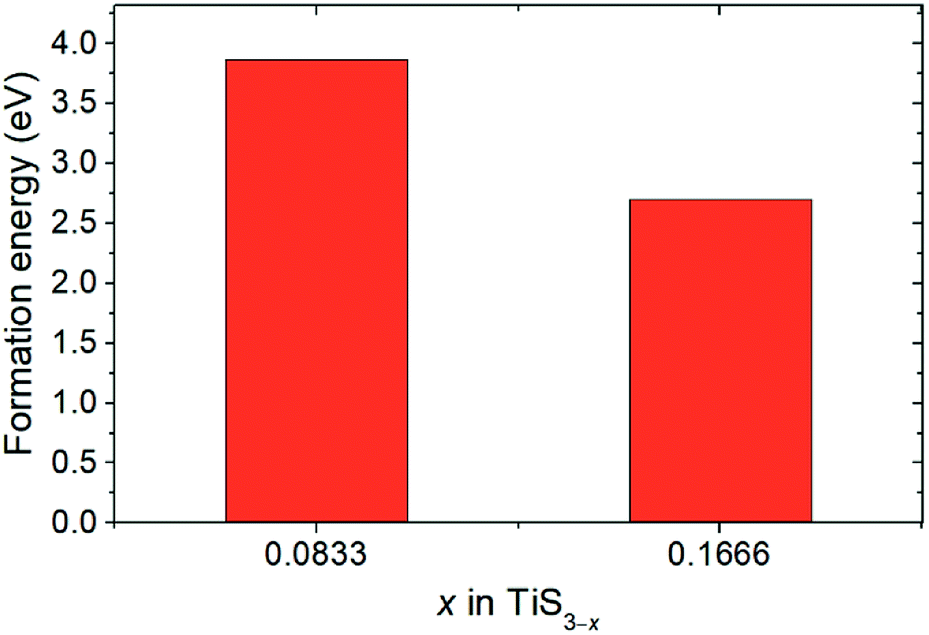 | ||
| Fig. 5 Sulfur vacancy formation energies for x = 0.0833 and 0.1667 in TiS3−x. | ||
Bader charge analysis shows that the creation of one S vacancy in the TiS3 2 × 3 × 1 supercell leads to accumulation of electrons on S atom (6.86 e), which shifted to the greatest distance in the process of structure relaxation (Fig. 4a), in agreement with work of Iyikanat et al.77 For two S vacancies per cell, the situation is identical (Fig. 4b).
When considering the tendency of vacancies to form in an oriented distribution, it should be mentioned that monolayer TiS3 has strong in-plane structural anisotropy. Briefly, the structure of monolayer TiS3 can be represented as a set of 1D chains made of an TiS6 polyhedron extending along the b-direction (Fig. 1a). These chains are combined into a layer trough a weak coupling, and thus anisotropy effects are anticipated. This property is also a characteristic to others transition metal trichalcogenides (TMTCs), with MX3 formula and in contrast to isotropic transition metal dichalcogenides (TMDCs) with MX2 formula where M stands for transition or post-transition metal atoms and X is the chalcogen group (S, Se, and Te).1,85 This structural anisotropy causes anisotropy of the properties, such as anisotropic electronic mobility, particularly high electronic mobility along the chain direction.86 Due to the structural in-plane anisotropy of TMTCs, the flakes cleave easily along the b-axis, resulting in needle-like few-layered flakes with a large geometric aspect ratio (a/b < 1).85 Along with a needle-shaped form, TMTCs also appear in the form of nanobelts.87,88 Thus, for mono- and few-layered TiS3, the hydrogen can be stored both by the edge and the basal plane. In this work, we investigate the ability of monolayer TiS3 to store hydrogen by the basal plane.
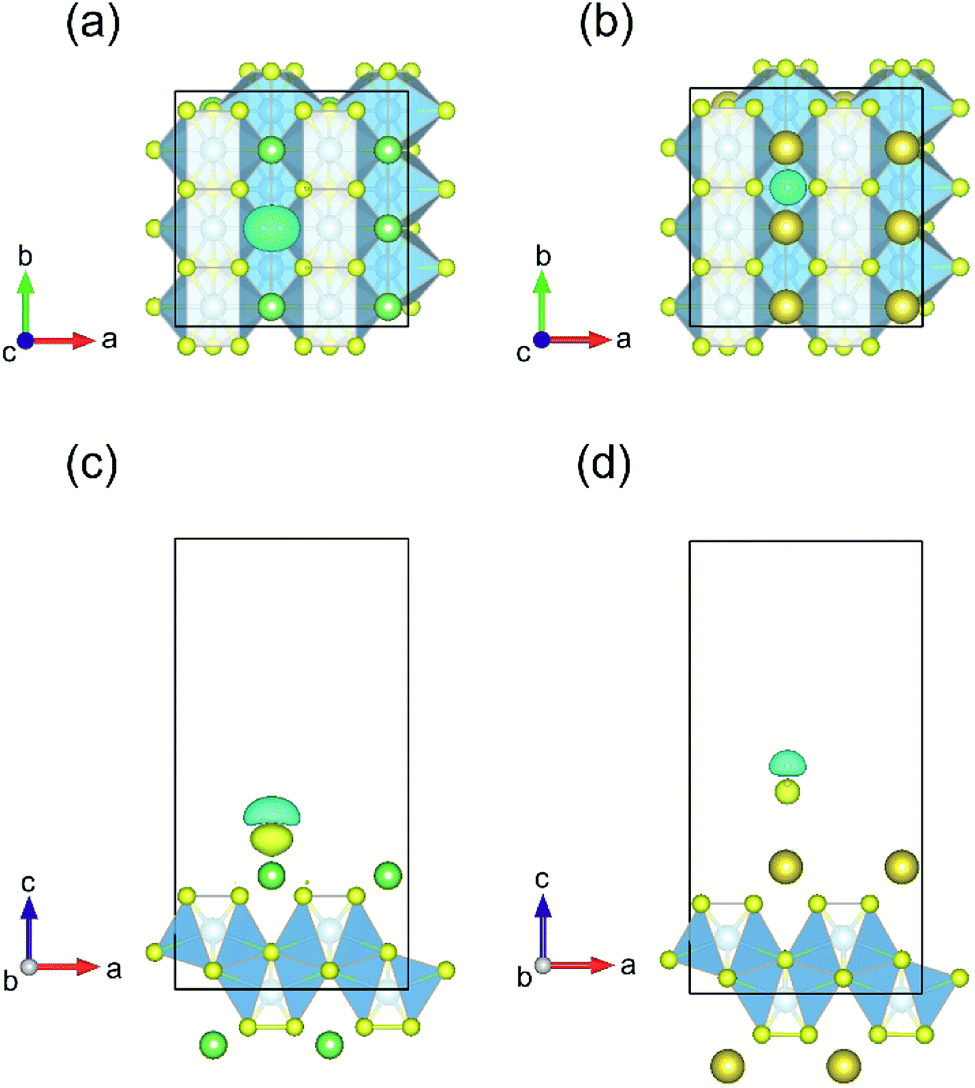
The process of sorption of cations on monolayer TiS3 was investigated earlier, see, for example, lithium and sodium sorption on TiS3 by Wu et al.52 For the consideration of lithium and sodium sorption, these authors suggested using H, T1 and T2 sites (Fig. 6a), which we also used in our work. As can be seen in Fig. 6a, there are three different high symmetry sites for monolayer TiS3 i.e. H, T1 and T2 sites. These positions were used to find the most stable adsorption site for Li, Na atoms and hydrogen molecules. The most stable configurations of Li and Na adsorbed on monolayer TiS3 are shown in Fig. 6b and c, respectively. According to our calculations, sorption of Li and Na in position H is the most favorable, in agreement with results of Wu et al.52 Li and Na adsorption stretches the TiS3 sheet (parameter a increased by 5%, parameter b – by 3% for Li; for Na – 4 and 3%, respectively). To estimate the influence of adsorption on the Ti–S bond length, let us consider the structure of TiS3 sheet as a set of 1D chains made of TiS6 trigonal prisms formed by Ti–S1–S2–S3 atoms (Fig. 1a). These chains are connected to each other through longer Ti–S4 bonds (Fig. 1a). The Ti–S4 equilibrium bond length of 2.658 Å for the pristine TiS3 increases to 2.763 and 2.740 Å for Li and Na covered monolayer TiS3, respectively (Table 4). If to visualize the crystal structure of Li covered monolayer TiS3 by VESTA with maximum Ti–S bond length recommended by this software,89 it can be seen that the bonds between these chains disappear (Fig. 6d). This may indicate that the adsorption of sodium and especially lithium can be used to split the monolayer of TiS3 into chains or substantially reduce the width of the nanobelts and needles. It can be seen that the increase of the Mg content absorbed by bulk TiS3 leads to break of the S–S bonds in the disulfide ion and conversion of similar effect was found in our recent work55 when it was found the TiS3 layers into ribbons. It should be noted that the creation of single vacancy induces the same separation effect as Li/Na adsorption (parameter a increases to 10.379 Å, see Table 3), however, for the case of two vacancies per the 2 × 3 × 1 supercell, this effect disappears quickly.
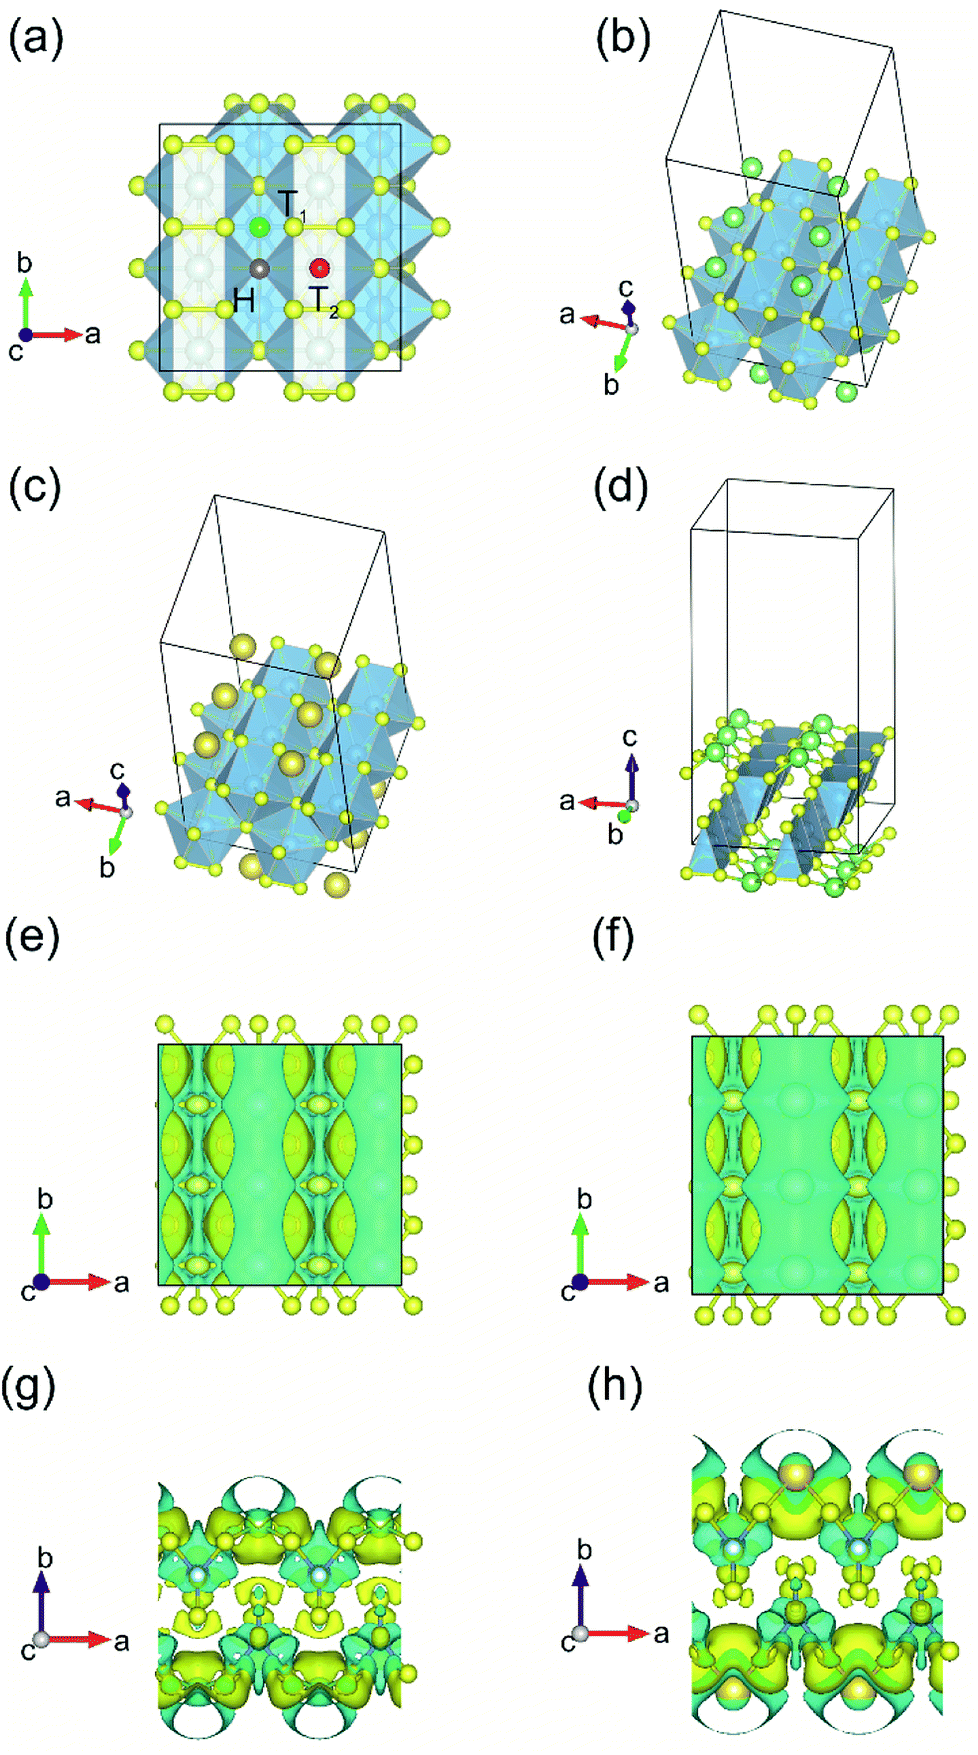 | ||
| Fig. 6 (a) Adsorption sites on a 2 × 3 × 1 single layer TiS3 nanosheet: purple, green and red spheres denote H, T1 and T2 sites, respectively. (b and c) The most stable configurations of Li and Na adsorbed on monolayer TiS3, respectively. The blue, yellow, green and gold balls represent the Ti, S, Li and Na atoms, respectively. (d) The crystal structure of Li covered monolayer TiS3 with maximum Ti–S bond length recommended by VESTA.89 Isosurface of the difference charge density for the most stable configuration of Li (e and g) and Na (f and h) adsorbed on the monolayer TiS3. Yellow regions indicate charge accumulation while cyan ones denote charge depletion. The isosurface level is set to 0.005e Å−3. | ||
| dTi–S1 (Å) | dTi–S2 (Å) | dTi–S4 (Å) | |
|---|---|---|---|
| Pristine TiS3 | 2.485 | 2.521 | 2.658 |
| Li decorated TiS3 | 2.481 | 2.603 | 2.763 |
| Na decorated TiS3 | 2.491 | 2.592 | 2.740 |
Bader charge analysis shows the filling of surface S atoms with electrons (from 6.36–6.41 to up to 6.84 valence charge) donated by the Li cation (2.12 valence charge). The charge on the inner S atoms is unchanged (6.90 electrons). The described situation is in agreement with the difference in charge density, see Fig. 6e and g. There is a net loss of electronic charge right above the Li, whereas there is a net gain of electronic charge in the intermediate region between Li and four adjacent sulfur atoms, indicating a significant charge transfer from the adsorbed Li to its nearest neighbor S atoms (around 0.88 electrons). The highly charged Li atoms thus have a strong repulsion among each other, thereby again suggesting that they prefer a dispersed configuration rather than an aggregated one. In the meantime, this charge transfer polarizes the system, leading to the setting up of an electric field in the region between the Li atom and TiS3, which is important for the H2 storage through electrostatic interaction. Somewhat smaller in magnitude (0.71 electrons), but the same in its manner, the donation of electrons is observed in the case of Na adsorbed on monolayer TiS3, in agreement with the difference in charge density (Fig. 6f and h). These results suggest that the interaction between the adsorbed Li/Na atom and its nearest neighbor sulfur atoms is predominantly ionic, and the valence electrons of the adsorbed Li/Na atoms are mainly transferred to the neighbor sulfur atoms.
For hydrogen adsorption on these systems, we first analyzed the most stable structure of a single H2 molecule adsorbed on the surface. Three different high symmetry sites for monolayer TiS3 (H, T1 and T2) sites (Fig. 6a) were used for H2 molecule placement. H point is above the inner S atom, T1 is above the midpoint between outer S atoms, T2 is above the Ti atom. The center of mass of the hydrogen molecule was placed at a distance of 2 Å from the surface according to recommendation of Putungan et al.,35 in order for H2 molecules not to be too close or far away from the substrate. All these are combined with the several approach orientations of H2. The hydrogen molecule was placed both horizontally and vertically. After the placement, all the atoms in the supercell were allowed to relax. Results of the investigation of H2 molecules adsorption on these sites for each of the systems studied are shown in Fig. 7 and 8, and Table 5.
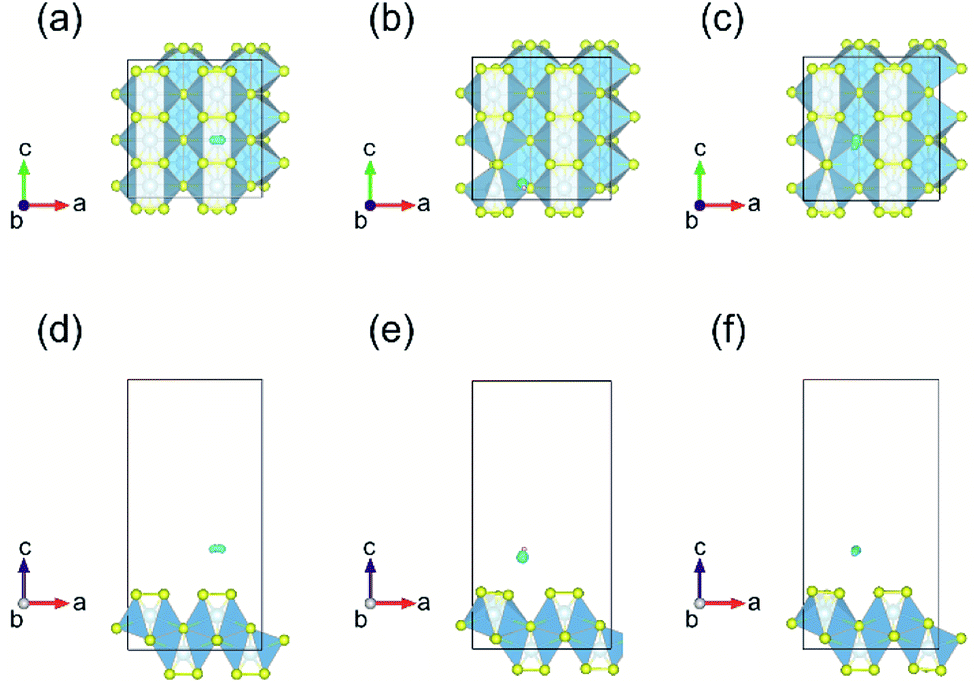 | ||
| Fig. 7 Lowest energy adsorption configurations and corresponding charge density difference for hydrogen on the most stable site for 2 × 3 × 1 supercell of monolayer TiS3 without S vacancies (a and d), containing one (b and e) and two (c and f) sulfur vacancies. The isosurface level is set to 0.002e Å−3. | ||
 | ||
| Fig. 8 Top and side views of the lowest energy adsorption configurations and corresponding charge density difference for H2 molecule on the monolayer TiS3 covered with Li (a and c) and Na (b and d). The isosurface level is set to 0.002e Å−3. | ||
| Site | |||
|---|---|---|---|
| H | T1 | T2 | |
| a The subscripts “h” and “v” in the bottom right corner indicate the two different initial orientations of the H2 molecule – parallel and perpendicular to the surface of monolayer TiS3, respectively. | |||
| Pristine TiS3 | 0.09h, 0.09v | 0.08h, 0.08v | 0.10h, 0.09v |
| One S vacancy | 0.08h, 0.08v | 0.07h, 0.07v | 0.08h, 0.07v |
| Two S vacancies | 0.10h, 0.09v | 0.08h, 0.08v | 0.09h, 0.08v |
| Li decorated TiS3 | 0.13h, 0.08v | 0.10h, 0.09v | 0.09h, 0.10v |
| Na decorated TiS3 | 0.09h, 0.11v | 0.11h, 0.11v | 0.10h, 0.08v |
In the case of H2 molecule adsorbed on monolayer TiS3 without vacancies, containing one and two S vacancies per 2 × 3 × 1 supercell, Bader charge analysis shows that H2 molecule does not loose nor gain any electrons. As follows from the difference in charge density (Fig. 7), the adsorption of the hydrogen molecule does not lead to a significant redistribution of the electrons in the systems under this study. If it is assumed that the hydrogen adsorption mechanism will be electrostatic, this can lead to low values of the adsorption energy. However, in this case many factors can participate in the process, and electrostatic one is only one of them.
In the case of Li/TiS3 system, the H2 gain very small charge (0.02 electrons), while the Li charge slightly increase (0.01 electrons). As for sodium adsorbed on TiS3 sheet, the H2 charge increase by 0.20 e, while the charge of the two closest Na cations decrease (8.19 electrons).
The total and partial density of states (PDOS) for all of the systems under study are shown in Fig. 9. As can be seen from the figures, removing one and two S atoms from the surface of TiS3 does not make any notable effect on the electronic structure of TiS3, in agreement with work of Iyikanat et al.77 (Fig. 9c and e). The monolayer TiS3 conserves its semiconductor character. Because of the reconstruction of the S atom and its binding with 2 Ti atoms, there are no unsaturated bonds.
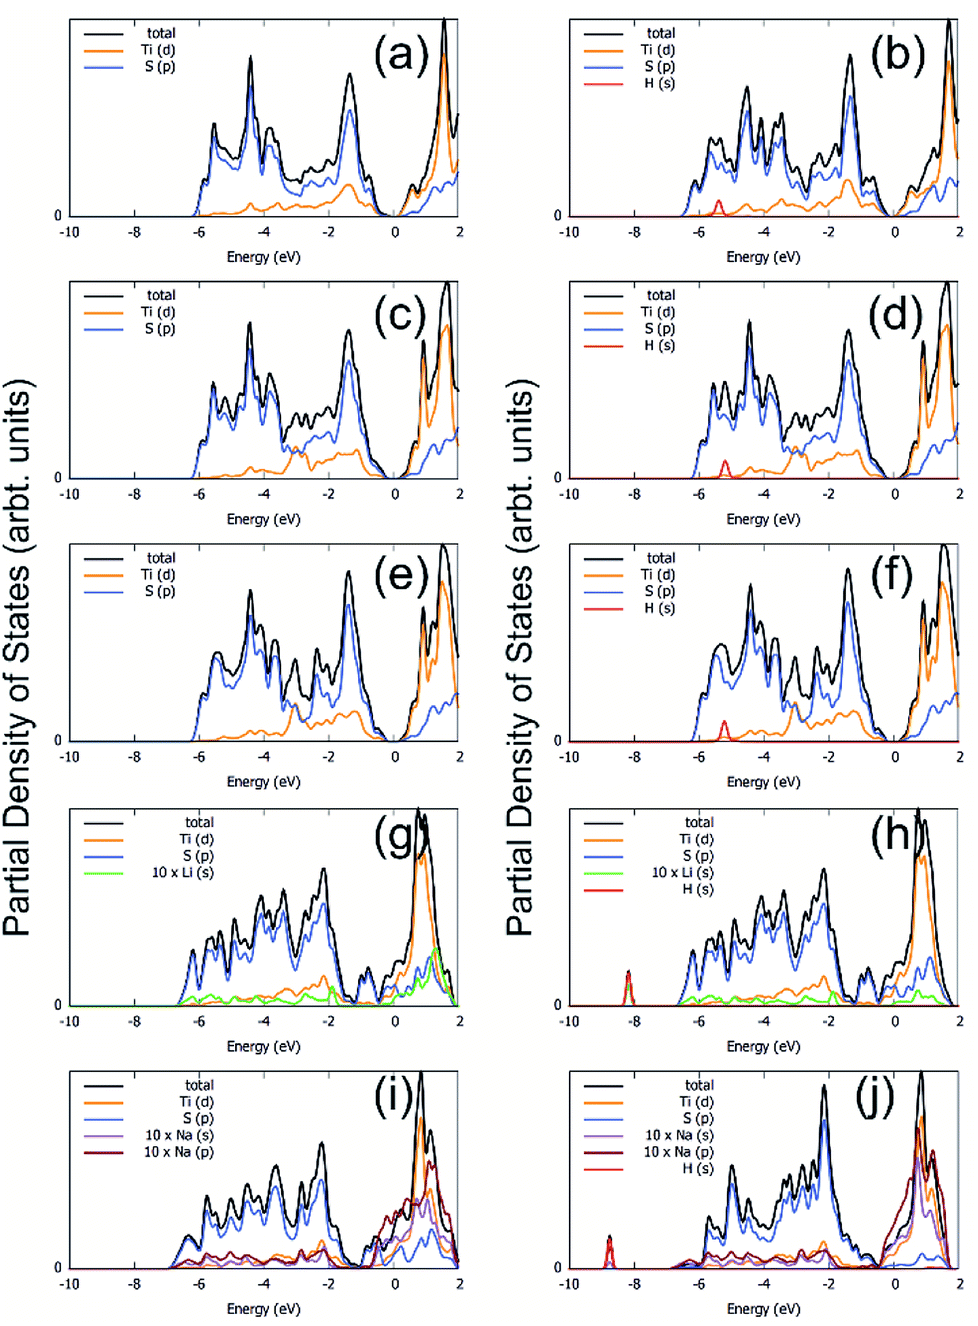 | ||
| Fig. 9 Total and partial density of states for TiS3 sheet bonded with alkali metal adatoms and single H2 molecule adsorbed on it (a) TiS3, (b) TiS3/H2 system, (c) one S vacancy, (d) one S vacancy/H2, (e) two S vacancies, (f) two S vacancies/H2, (g) Li/TiS3, (h) Li/TiS3/H2, (i) Na/TiS3 and (j) Na/TiS3/H2 system. Energies are given relative to the Fermi energy. | ||
Unlike the S vacancy, the Li/Na adsorption has a major effect on the electronic structure of TiS3; it loses its semiconductor character and becomes metallic. As shown in Fig. 9g and i, because of injection of electrons from Li/Na cations, the n-type doping is realized. Both p orbitals of S and d orbitals of Ti adsorb excess electrons, but Ti absorbs more.
When considering systems with adsorbed hydrogen, there is no charge transfer from H2 to Li/Na and TiS3 sheet. This fact eliminates the mechanism of electrostatic interaction from our consideration. The electric field induced around the positive charged Li/Na atoms does not polarize the H2 molecules. We believe that this field is hindered by the electrostatic field from the negatively charged monolayer TiS3, the charge which is intrinsic to the monolayer TiS3, as was shown by Iyikanat et al.77 and was confirmed in or work (Fig. 1c). The initial H2 adsorption in this case is mostly mediated by the dipole interaction between Li/Na ion and H2 (induced) dipole moment. It is clear that the H atoms are polarized by the positively charge Li/Na atom. It is worth pointing out here, that H2 has zero dipole moment, but has a large quadrupole moment and high polarizability. Thus, these studies clearly indicate that the interaction between H2 and the Li/Na center to be dipole-quadrupole and dipole-induced dipole electrostatic in nature. A similar situation can occur in the case of pristine TiS3 and TiS3, containing S vacancies: negatively charged surface could polarize the H2 molecule. In confirmation, it should be noted here that the largest polarization (difference of charge on H atoms 0.07 electrons) is realized in the case of pristine TiS3 sheet, indicating its substantial polarizing ability compared to other systems under the study. Although this mechanism is interesting in its origin, it may be not so effective like conventional alkali/transition metal systems. However, this mechanism requires further investigations. There is no stretching of the H–H bond, indicating the absence of H2 dissociation, which was found, for example, in the Li/MoS2 system by Putungan et al.35 The PDOS for Li/Na adsorbed system (Fig. 9h and j) shows the overlap or hybridization of density states between H-s orbital and Li/Na-s orbitals appears at about −8 eV (Li) and −9 eV (Na), which increases the Eads. Thus, besides the electrostatic interaction, electronic hybridization also plays roles in the adsorption process. Therefore, our analysis shows that the both, the hybridization of the Li/Na-s orbital with the H-s orbital and the polarization of the H2 molecules, contribute to the H2 adsorption.
Following the results for single H2 adsorption, a set of models was created for the first layer of hydrogen molecules adsorbed on Li/Na/vac–TiS3 system and compared them by total energy calculations. A similar approach was used by the Yadav et al.36 The H2 molecules' positions were constrained (distance from Li/Na/S atom or S vacancy was 2.0 Å), in order for H2 molecules not to be too close or far away from the substrate, according to recommendation of Putungan et al.35 Furthermore, to ensure that there are no overlapping spatial coordinates, a distance of 2.0 Å was imposed between two hydrogen atoms belonging to nearest neighbor H2 molecules. Fig. 10 shows the first layer of H2-molecule adsorbed on pristine monolayer TiS3 for two models with the lowest value of total energy: Model-1 (Fig. 10a and c) and Model-2 (Fig. 10b and d). The difference in the values of the total energy between these models is only 0.013 eV per atom, which indicate that at operating temperatures of the hydrogen storage device both models coexist. In fact, a mixture of these two models will take place, in which hydrogen molecule oriented along the c axis (Fig. 10a and c) will alternately orient along the c and b axes, in random fashion. The average values of the hydrogen adsorption energy 〈Eads,H2〉 for the first layer for all the cases considered by us calculated using eqn (4) are presented in Table 6. It can be seen that in general, adsorption does not satisfy the minimum value of 0.2 eV, recommended by DOE.9,10 The hydrogen adsorption energy of the second layer for pristine monolayer TiS3 does not exceed 0.01 eV. Such a negative trend for pristine monolayer TiS3 has experimental confirmation in the work of Barawi et al.79 For other cases considered by us (Li/Na/vac–TiS3) the situation is similar.
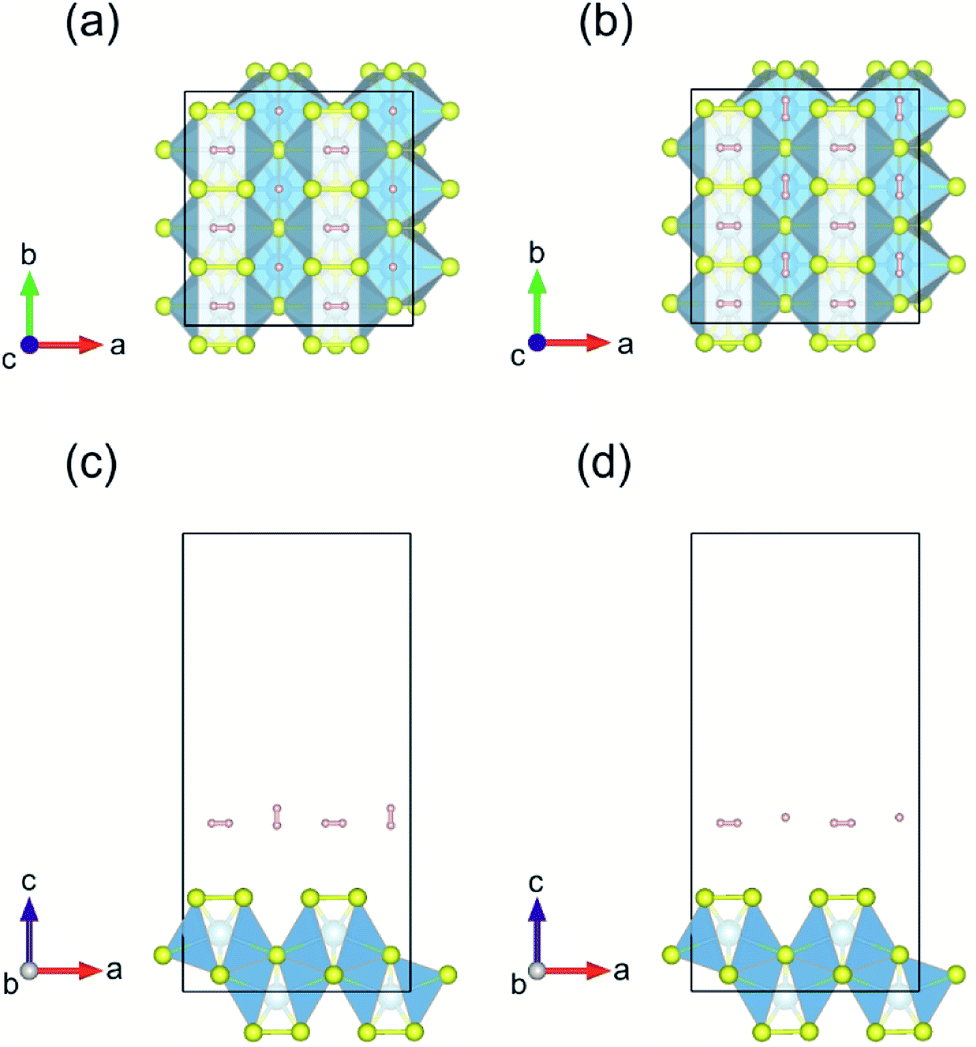 | ||
| Fig. 10 (a and b) Top and (c and d) side views of the first layer of H2-molecule adsorbed on pristine monolayer TiS3 for Model-1 and Model-2, respectively. | ||
| 〈Eads,H2〉 (eV) | |
|---|---|
| Pristine TiS3 | 0.09 |
| One S vacancy | 0.07 |
| Two S vacancies | 0.08 |
| Li decorated TiS3 | 0.13 |
| Na decorated TiS3 | 0.11 |
Small changes in the binding energy of H2 molecules in comparison with the pristine TiS3 can be explained by its electronic structure. According to work of Iyikanat et al.77 removing one S atom from the surface of TiS3 does not make any notable effect on the electronic structure of TiS3. The monolayer TiS3 conserves its semiconductor character.
Such a lack of increase in adsorption energy of H2 when using the decoration with alkali metals (Li, Na) can be explained by the fact that alkali atoms tend to attract H2 molecules via electrostatic interaction. Such an electrostatic origin of the interaction between H2 molecule and alkali cations can be affected by the negatively charged surface of monolayer TiS3,77 which on the other hand makes this material interesting in applications such as nanoscale lubricants and charged coatings.
4. Conclusions
In this paper, first-principles calculations have been carried out to study the possibility of H2 molecule to adsorb on the basal plane of monolayer TiS3 at various sites. Despite the adsorption energy of pure TiS3 at some positions was up to 0.10 eV per H2, the use of traditional methods, such as the decoration of monolayer TiS3 with alkali metals (Li/Na), did not have an effect. We believe that this is caused by the negatively charged surfaces of single layer TiS3, influencing the electrostatic component of interaction between alkali metals and hydrogen molecule. The creation of defects, such as sulfur vacancies found ineffective. In addition, the structure and phase stability of monolayer TiS3 containing multiple S vacancies was investigated. The structures containing vacancies were found to be stable. It was found that S vacancies do not form clusters, as is the case, for example, of monolayer MoS2.60 The adsorption of sodium and especially lithium can be used to split the monolayer of TiS3 into chains or substantially reduce the width of the TiS3 nanobelts and needles. It is also assumed that the adsorption of magnesium can have the same effect as was found in our recent work for the adsorption of magnesium by bulk TiS3.55Conflicts of interest
There are no conflicts to declare.Acknowledgements
This work was supported by the Russian Federation President's scholarship for young scientists and PhD students, project SP-1826.2018.1. The authors thank Petr Tikhonov at ISC RAS for useful discussions. Research was carried out using computational resources provided by Resource Center “Computer Center of SPbU” (http://cc.spbu.ru).Notes and references
- Q. H. Wang, K. Kalantar-Zadeh, A. Kis, J. N. Coleman and M. S. Strano, Nat. Nanotechnol., 2012, 7, 699–712 CrossRef PubMed.
- B. Radisavljevic, A. Radenovic, J. Brivio, V. Giacometti and A. Kis, Nat. Nanotechnol., 2011, 6, 147–150 CrossRef PubMed.
- A. Reshak and S. Auluck, Phys. Rev. B: Condens. Matter Mater. Phys., 2003, 68, 125101 CrossRef.
- L. Li, H. Wang, X. Fang, T. Zhai, Y. Bando and D. Golberg, Energy Environ. Sci., 2011, 4, 2586–2590 RSC.
- K. H. Hu, X. G. Hu and X. J. Sun, Appl. Surf. Sci., 2010, 256, 2517–2523 CrossRef.
- P. Jena, J. Phys. Chem. Lett., 2011, 2, 206–211 CrossRef.
- J. Yang, A. Sulik, C. Wolverton and D. J. Siegel, Chem. Soc. Rev., 2010, 39, 656–675 RSC.
- Q. Lai, M. Paskevicius, D. A. Sheppard, C. E. Buckley, A. W. Thornton, M. R. Hill, Q. Gu, J. Mao, Z. Huang, H. K. Liu, Z. Guo, A. Banerjee, S. Chakraborty, R. Ahuja and K. F. Aguey-Zinsou, ChemSusChem, 2015, 8, 2789–2825 CrossRef PubMed.
- US Department of Energy's Energy Efficiency and Renewable Energy Website, http://www.hydrogen.energy.gov/annual_progress14_storage.html#c (accessed Jan 16, 2018).
- Z. Ao, S. Dou, Z. Xu, Q. Jiang and G. Wang, Int. J. Hydrogen Energy, 2014, 39, 16244–16251 CrossRef.
- T. K. Hoang and D. M. Antonelli, Adv. Mater., 2009, 21, 1787–1800 CrossRef.
- D. Li, Y. Ouyang, J. Li, Y. Sun and L. Chen, Solid State Commun., 2012, 152, 422–425 CrossRef.
- F. Schuth, B. Bogdanovic and M. Felderhoff, Chem. Commun., 2004, 2249–2258 RSC.
- C. Ataca, E. Aktürk, S. Ciraci and H. Ustunel, Appl. Phys. Lett., 2008, 93, 043123 CrossRef.
- G. Kim, S.-H. Jhi, S. Lim and N. Park, Phys. Rev. B: Condens. Matter Mater. Phys., 2009, 79, 155437 CrossRef.
- K. R. S. Chandrakumar and S. K. Ghosh, Nano Lett., 2008, 8, 13–19 CrossRef PubMed.
- Q. Sun, Q. Wang and P. Jena, Appl. Phys. Lett., 2009, 94, 13111 CrossRef.
- S. Seenithurai, R. K. Pandyan, S. V. Kumar, C. Saranya and M. Mahendran, Int. J. Hydrogen Energy, 2014, 39, 11990–11998 CrossRef.
- B. Panella, M. Hirscher and S. Roth, Carbon, 2005, 43, 2209–2214 CrossRef.
- S. Patchkovskii, J. S. Tse, S. N. Yurchenko, L. Zhechkov, T. Heine and G. Seifert, Proc. Natl. Acad. Sci. U. S. A., 2005, 102, 10439–10444 CrossRef PubMed.
- A. Du, Z. Zhu and S. C. Smith, J. Am. Chem. Soc., 2010, 132, 2876–2877 CrossRef PubMed.
- A. Lebon, J. Carrete, L. J. Gallego and A. Vega, Int. J. Hydrogen Energy, 2015, 40, 4960–4968 CrossRef.
- K. Y. Lin, W. T. Tsai and J. K. Chang, Int. J. Hydrogen Energy, 2010, 35, 7555–7562 CrossRef.
- Y. Chen, J. Wang, L. Yuan, M. Zhang and C. Zhang, Materials, 2017, 10, 894 CrossRef PubMed.
- Y. Li, Y. Mi and G. Sun, J. Mater. Sci. Chem. Eng., 2015, 3, 87–94 Search PubMed.
- H. Lee, J. Ihm, M. L. Cohen and S. G. Louie, Nano Lett., 2010, 10, 793–798 CrossRef PubMed.
- Y. Wang, H. Zhen, J. Gao, B. Xu, Q. Sun and Y. Jia, Int. J. Hydrogen Energy, 2014, 39, 14027–14032 CrossRef.
- T. Hussain, S. Chakraborty and R. Ahuja, ChemPhysChem, 2013, 14, 3463–3466 CrossRef PubMed.
- T. Hussain, T. Kaewmaraya, S. Chakraborty and R. Ahuja, Phys. Chem. Chem. Phys., 2013, 15, 18900–18905 RSC.
- H. Liu, A. T. Neal, Z. Zhu, Z. Luo, X. Xu, D. Tománek and P. D. Ye, ACS Nano, 2014, 8, 4033–4041 CrossRef PubMed.
- S. Zhang, Z. Yan, Y. Li, Z. Chen and H. Zeng, Angew. Chem., Int. Ed., 2015, 54, 3112–3115 CrossRef PubMed.
- X. Xie, Y. Zhou, H. Bi, K. Yin, S. Wan and L. Sun, Sci. Rep., 2013, 3, 2117 CrossRef PubMed.
- E. Tsivion, J. R. Long and M. H. Gordon, J. Am. Chem. Soc., 2014, 136, 17827–17835 CrossRef PubMed.
- A. K. Singh, A. Sandrzadeh and B. I. Yakobson, J. Am. Chem. Soc., 2010, 132, 14126–14129 CrossRef PubMed.
- D. B. Putungan, S. H. Lin, C. M. Wei and J. L. Kuo, Phys. Chem. Chem. Phys., 2015, 17, 11367–11374 RSC.
- A. Yadav, A. Dashora, N. Patel, A. Miotello, M. Press and D. C. Kothari, Appl. Surf. Sci., 2016, 389, 88–95 CrossRef.
- T. K. A. Hoang, M. I. Webb, H. V. Mai, A. Hamaed, C. J. Walsby, M. Trudeau and D. M. Antonelli, J. Am. Chem. Soc., 2010, 132, 11792–11798 CrossRef PubMed.
- T. K. A. Hoang, L. Morris, J. Sun, M. L. Trudeauc and D. M. Antonelli, J. Mater. Chem. A, 2013, 1, 1947–1951 RSC.
- H. V. Mai, T. K. A. Hoang, A. Hamaed, M. Trudeaub and D. M. Antonelli, Chem. Commun., 2010, 46, 3206–3208 RSC.
- S. J. Bhattacharya, J. Phys. Chem. C, 2012, 116, 3840–3844 CrossRef.
- T. Yildirim and S. Ciraci, Phys. Rev. Lett., 2005, 94, 175501 CrossRef PubMed.
- E. Durgun, S. Ciraci, W. Zhou and T. Yildirim, Phys. Rev. Lett., 2006, 97, 226102 CrossRef PubMed.
- M. Li, J. Li, Q. Sun and Y. Jia, J. Appl. Phys., 2010, 108, 064326 CrossRef.
- H. Lee, W. I. Choi and J. Ihm, Phys. Rev. Lett., 2006, 97, 056104 CrossRef PubMed.
- A. K. Geim and I. V. Grigorieva, Nature, 2013, 499, 419–425 CrossRef PubMed.
- S.-H. Lin and J.-L. Kuo, Phys. Chem. Chem. Phys., 2014, 16, 20763–20771 RSC.
- T. Hussain, A. De Sarkar and R. Ahuja, Int. J. Hydrogen Energy, 2014, 39, 2560–2566 CrossRef.
- T. Hussain, M. Hankel and D. J. Searles, J. Phys. Chem. C, 2017, 121, 14393–14400 CrossRef.
- Y. Zhou, W. Chu, F. Jing, J. Zheng, W. Sun and Y. Xue, Appl. Surf. Sci., 2017, 410, 166–176 CrossRef.
- S. Haldar, S. Mukherjee, F. Ahmed and C. V. Singh, Int. J. Hydrogen Energy, 2017, 42, 23018–23027 CrossRef.
- A. Hashmi, M. U. Farooq, I. Khan, J. Son and J. Hong, J. Mater. Chem. A, 2017, 5, 2821–2828 RSC.
- J. Wu, D. Wang, H. Liu, W. M. Lau and L. M. Liu, RSC Adv., 2015, 5, 21455–21463 RSC.
- M. H. Lindic, H. Martinez, A. Benayad, B. Pecquenard, P. Vinatier, A. Levasseur and D. Gonbeau, Solid State Ionics, 2005, 176, 1529–1537 CrossRef.
- Z. A. Hayashi, T. Matsuyama, A. Sakuda and M. Tatsumisago, Chem. Lett., 2012, 41, 886–888 CrossRef.
- M. Arsentev, A. Missyul, A. V. Petrov and M. Hammouri, J. Phys. Chem. C, 2017, 121, 15509–15515 CrossRef.
- D. Le, T. B. Rawal and T. S. Rahman, J. Phys. Chem. C, 2014, 118, 5346–5351 CrossRef.
- A. B. Laursen, S. Kegnaes, S. Dahl and I. Chorkendorff, Energy Environ. Sci., 2012, 5, 5577–5591 RSC.
- Y. Huang, J. Wu, X. Xu, Y. Ho, G. Ni, Q. Zou, G. Koon, W. Zhao, A. H. Castro Neto, G. Eda, C. Shen and B. Özyilmaz, Nano Res., 2013, 6, 200–207 CrossRef.
- G. Ye, Y. Gong, J. Lin, B. Li, Y. He, S. T. Pantelides, W. Zhou, R. Vajtai and P. M. Ajayan, Nano Lett., 2016, 16, 1097–1103 CrossRef PubMed.
- C. Tsai, H. Li, S. Park, J. Park, H. S. Han, J. K. Nørskov, X. Zheng and F. Abild-Pedersen, Nat. Commun., 2017, 8, 15113 CrossRef PubMed.
- P. Giannozzi, S. Baroni, N. Bonini, M. Calandra, R. Car, C. Cavazzoni, D. Ceresoli, G. L. Chiarotti, M. Cococcioni, I. Dabo, A. Dal Corso, S. de Gironcoli, S. Fabris, G. Fratesi, R. Gebauer, U. Gerstmann, C. Gougoussis, A. Kokalj, M. Lazzeri, L. Martin-Samos, N. Marzari, F. Mauri, R. Mazzarello, S. Paolini, A. Pasquarello, L. Paulatto, C. Sbraccia, S. Scandolo, G. Sclauzero, A. P. Seitsonen, A. Smogunov, P. Umari and R. M. Wentzcovitch, J. Phys.: Condens. Matter, 2009, 21, 395502 CrossRef PubMed.
- J. P. Perdew, K. Burke and M. Ernzerhof, Phys. Rev. Lett., 1996, 77, 3865–3868 CrossRef PubMed.
- L. Kleinman and D. M. Bylander, Phys. Rev. Lett., 1982, 48, 1425–1428 CrossRef.
- D. Vanderbilt, Phys. Rev. B: Condens. Matter Mater. Phys., 1990, 41, 7892–7895 CrossRef.
- A. Lipatov, P. M. Wilson, M. Shekhirev, J. D. Teeter, R. Netusil and A. Sinitskii, Nanoscale, 2015, 7, 12291–12296 RSC.
- B. G. Pfrommer, M. Cote, S. G. Louie and M. L. Cohen, J. Comput. Phys., 1997, 131, 233–240 CrossRef.
- G. Roman-Perez and J. M. Soler, Phys. Rev. Lett., 2009, 103, 096102 CrossRef PubMed.
- A. Jain, S. P. Ong, G. Hautier, W. Chen, W. D. Richards, S. Dacek, S. Cholia, D. Gunter, D. Skinner, G. Ceder and K. A. Persson, APL Mater., 2013, 1, 011002 CrossRef.
- S. P. Ong, W. D. Richards, A. Jain, G. Hautier, M. Kocher, S. Cholia, D. Gunter, V. L. Chevrier, K. A. Persson and G. Ceder, Comput. Mater. Sci., 2013, 68, 314–319 CrossRef.
- S. P. Ong, S. Cholia, A. Jain, M. Brafman, D. Gunter, G. Ceder and K. A. Persson, Comput. Mater. Sci., 2015, 97, 209–215 CrossRef.
- M. Bernardi, C. Ataca, M. Palummo and J. C. Grossman, Nanophotonics, 2017, 6, 479–493 Search PubMed.
- H. Li, J. Wu, Z. Y. Yin and H. Zhang, Acc. Chem. Res., 2014, 47, 1067–1075 CrossRef PubMed.
- H. Li, J. Wu, X. Huang, G. Lu, J. Yang, X. Lu, Q. H. Xiong and H. Zhang, ACS Nano, 2013, 7, 10344–10353 CrossRef PubMed.
- H. Li, Z. Yin, Q. He, H. Li, X. Huang, G. Lu, D. W. H. Fam, A. I. Y. Tok, Q. Zhang and H. Zhang, Small, 2012, 8, 63–67 CrossRef PubMed.
- H. Li, G. Lu, Y. Wang, Z. Yin, C. Cong, Q. He, L. Wang, F. Ding, T. Yu and H. Zhang, Small, 2013, 9, 1974–1981 CrossRef PubMed.
- Z. Zeng, C. Tan, X. Huang, S. Bao and H. Zhang, Energy Environ. Sci., 2014, 7, 797–803 RSC.
- F. Iyikanat, H. Sahin, R. T. Senger and F. M. Peeters, J. Phys. Chem. C, 2015, 119, 10709–10715 CrossRef.
- T. Björkman, A. Gulans, A. V. Krasheninnikov and R. M. Nieminen, Phys. Rev. Lett., 2012, 108, 235502 CrossRef PubMed.
- M. Barawi, E. Flores, M. Ponthieu, J. R. Ares, F. Cuevas, F. Leardini, I. J. Ferrer and C. Sánchez, J. Electr. Eng., 2015, 3, 24–29 Search PubMed.
- G. S. Gautam, X. Sun, V. Duffort, L. F. Nazar and G. Ceder, J. Mater. Chem. A, 2016, 4, 17643–17648 RSC.
- G. S. Gautam, P. Canepa, R. Malik, M. Liu, K. Persson and G. Ceder, Chem. Commun., 2015, 51, 13619–13622 RSC.
- M. Liu, Z. Rong, R. Malik, P. Canepa, A. Jain, G. Ceder and K. A. Persson, Energy Environ. Sci., 2015, 8, 964–974 RSC.
- W. Sun, S. T. Dacek, S. P. Ong, G. Hautier, A. Jain, W. D. Richards, A. C. Gamst, K. A. Persson and G. Ceder, Sci. Adv., 2016, 2, e1600225 Search PubMed.
- H. Li, C. Tsai, A. L. Koh, L. Cai, A. W. Contryman, A. H. Fragapane, J. Zhao, H. S. Han, H. C. Manoharan, F. Abild-Pedersen, J. K. Nørskov and X. L. Zheng, Nat. Mater., 2015, 15, 48–53 CrossRef PubMed.
- A. Pant, E. Torun, B. Chen, S. Bhat, X. Fan, K. Wu, D. P. Wright, F. M. Peeters, E. Soignard, H. Sahin and S. Tongay, Nanoscale, 2016, 8, 16259–16265 RSC.
- J. Dai and X. C. Zeng, Angew. Chem., Int. Ed., 2015, 54, 7572–7576 CrossRef PubMed.
- J. Ma, X. Liu, X. Cao, S. Feng and M. E. Fleet, Eur. J. Inorg. Chem., 2005, 519–522 Search PubMed.
- X. C. Wu, Y. R. Tao and Q. X. Gao, Nano Res., 2009, 2, 558–564 CrossRef.
- K. Momma and F. Izumi, J. Appl. Crystallogr., 2011, 44, 1272–1276 CrossRef.
| This journal is © The Royal Society of Chemistry 2018 |