 Open Access Article
Responses of the electron transfer capacity of soil humic substances to agricultural land-use types
Beidou Xiabc,
Zhurui Tangad,
Jie Jiange,
Wenbing Tanab,
Caihong Huang *ab,
Wenchao Yuanab and
Xiangqin Xiaad
aState Key Laboratory of Environmental Criteria and Risk Assessment, Chinese Research Academy of Environmental Sciences, Beijing 100012, China. E-mail: huangch@craes.org.cn
bInnovation Base of Ground Water & Environmental System Engineering, Chinese Research Academy of Environmental Sciences, Beijing 100012, China
cSchool of Environmental and Municipal Engineering, Lanzhou Jiaotong University, Lanzhou 730070, China
dCollege of Environmental Science and Engineering, Guilin University of Technology, Guilin 541004, China
eCollege of Environmental Science and Engineering, Beijing Forestry University, Beijing 100083, China
First published on 20th September 2018
Abstract
Humic substances (HS) are redox-active organic compounds that constitute a major fraction of natural organic matter in soils. The electron transfer capacity (ETC) of soil HS is mainly dependent on the type and abundance of redox-active functional groups in their structure. It is unclear whether or not agricultural land-use types can affect the ETC of HS in soils. In the present study, we evaluate the responses of ETCs of soil humic acids (HA) and fulvic acids (FA) to different agricultural land-use types. Our results show that both HA and FA of paddy soil showed the highest ETCs, followed by tomato soil, celery cabbage soil, grapevine soil, and myrica rubra soil, respectively. Agricultural land-use types could affect the transformation and decomposition of HS in soils, and thus further change the intrinsic chemical structures associated with ETC. Consequently, the ETC of soil HS exerts a significant difference among different agricultural land-use types. The results of this study could give insight into the roles of HS redox properties on the transport, fate, and redox conversion of organic and inorganic pollutants in different agricultural soils.
Introduction
Humic substances (HS) are traditionally defined as high molecular weight dark-colored organic compounds formed through the partial decomposition of plant litter and microbial residues.1 HS are a major fraction of natural organic matter in both terrestrial and aquatic systems.1,2 Under anoxic conditions, HS can be reduced by a variety of different microorganisms, such as sulfate reducers,3 iron reducers,4 and fermenting bacteria.5 Reduced HS can subsequently donate electrons to other electron acceptors with more positive redox potentials, such as iron oxides and hydroxides4,6 and various organic and inorganic contaminants, including chlorinated compounds,7 nitrobenzenes,8 U(VI),9 and Cr(VI).10 Thus, the so-called electron transfer properties of HS can exert significant effects on the biogeochemical redox processes of redox-active substances in the environment.This electron transfer capacity (ETC) of HS is suggested to be dependent on their intrinsic chemical structures. The pioneer researches pointed at quinone moieties as the redox-active functional groups in HS.11,12 The hypothesis was further supported by several lines of evidence. For example, Scott et al. revealed that quinone moieties act as the actual redox-active functional groups during the microbial reduction of HS by electron spin resonance technique.13 Genetic evidence revealed that menaquinone was involved in the electron transport chain of Shewanella putrefaciens MR during the reduction of HS.14 Other evidences from Fourier transform infrared spectra, NMR spectroscopy and pyrolysis-GC-MS techniques also showed that quinones were important redox-active functional groups in HS.15,16 Besides quinoid and phenolic functional groups, nitrogen- and sulfur-containing moieties (such as 1-methyl-2,5-pyrrolidinedione, 3-(methylthio)-propanoic acid, dimethyl sulfone, N-methyl aniline) and complexed metal ions have also been considered to be important contributors for redox-active functional groups in HS.17–19
The distributions and abundances of redox-active functional groups in HS are generally dependent on microbial decomposition and transformation of HS in soils.1,20 Land management and land-use change are predicted to alter the degradation and transformation of natural organic matter and HS in terrestrial ecosystems at the time scale of decades,21 and may have a direct impact on the intrinsic chemical structures of soil HS.22–24 Thus, it is reasonable to expect that the ETC of soil HS is inherently linked to land management and land-use change. Clearly, the mechanism of the effects of land management and land-use change on the ETC of soil HS warrants investigation given its importance to understanding biogeochemical processes, wherein the redox functionality of soil HS is involved, under the context of land-use change.
In this study, we sampled the soils under different agricultural land-use types in Changzhou, China. The ETCs of humic acids (HA) and fulvic acids (FA) extracted from these soils were quantified using a microbial reduction approach to evaluate the responses of ETCs of soil HA and FA to agricultural land-use types. The objective of this study was to improve our understanding of the important role of redox properties of soil HS in environmentally biogeochemical processes and consequently maintain soil environmental sustainability in agroecosystem.
Materials and methods
Study area and sampling
The study was conducted in an agroecosystem (31°33′–31°34′ N, 119°59′–120°01′ E), which is located near the Changzhou City in Jiangsu Province, East China. The area is characterized by a typically subtropical monsoon climate, with a mean annual temperature of 15 °C and an average annual precipitation of 1110 mm. The rainfall is mainly concentrated from June to September. The main soil types at the site are Anthrosols.Soil sampling was conducted in September 2013 in five different agricultural lands, planted with rice (Oryza sativa Wuyunjing no. 23), tomato (Lycopersicon esculentum Dongsheng no. 101), celery cabbage (Brassica campestris Qingza no. 5), grapevine (Vitis vinifera Xiahei), Myrica rubra (Myrica rubra Biqi), respectively. The sampled soils in the five agricultural lands were called paddy soil (PS), tomato soil (TS), celery cabbage soil (CCS), grapevine soil (GS), myrica rubra soil (MRS), respectively. Four soil sampling sites at each agricultural land were selected. At each site, three soil profiles were randomly selected, and plant litter was collected and soils were then sampled at depths of 0–10 cm. Plant-litter samples were rinsed with deionized water to soil particles. Soil samples were sieved (2 mm diameter) to remove soil fauna, fine roots, and rock fragments. Subsequently, all pretreated plant-litter and soil samples were freeze-dried, ground, and finally stored at −20 °C until analysis. Physical and chemical properties of the five agricultural soils are given in Table 1.
![[thin space (1/6-em)]](https://www.rsc.org/images/entities/char_2009.gif) :
:![[thin space (1/6-em)]](https://www.rsc.org/images/entities/char_2009.gif) N, pH, and soil texture (% of sand, silt, or clay) of soils under different agricultural land-use types. Mean (±SE, n = 12)a
N, pH, and soil texture (% of sand, silt, or clay) of soils under different agricultural land-use types. Mean (±SE, n = 12)a
| Organic C | Total N | C![[thin space (1/6-em)]](https://www.rsc.org/images/entities/char_2009.gif) : :![[thin space (1/6-em)]](https://www.rsc.org/images/entities/char_2009.gif) N N |
pH | Sand/silt/clay | |
|---|---|---|---|---|---|
| a PS, TS, CCS, GS and MRS denote paddy soil, tomato soil, celery cabbage soil, grapevine soil and myrica rubra soil, respectively. | |||||
| PS | 10.7 (0.3) | 1.2 (0.1) | 8.9 (0.4) | 6.2 (0.01) | 36/35/30 |
| TS | 15.6 (0.2) | 1.2 (0.2) | 12.9 (0.5) | 6.7 (0.04) | 41/32/28 |
| CCS | 14.3 (0.2) | 1.1 (0.1) | 12.4 (0.4) | 6.1 (0.02) | 34/42/25 |
| GS | 20.1 (0.1) | 1.3 (0.2) | 16.0 (0.2) | 5.9 (0.02) | 42/32/26 |
| MRS | 24.8 (0.3) | 1.6 (0.2) | 15.7 (0.6) | 6.4 (0.03) | 38/29/33 |
Soil HS extraction
HS were extracted from pretreated soils by using alkaline solution (0.1 M NaOH) under O2-free condition according to the standardized method of the International Humic Substances Society.25 The extracted HS mixture was then separated into HA (precipitate) and FA (supernatant) fractions by acidifying the mixture to pH 1 with 6 M HCl and subsequently centrifugation at a rate of 6000 rpm. HA fraction was suspended in a mixed solution of HCl/HF (0.1 M/0.3 M) to remove mineral and then dialyzed to eliminate chloride ions. FA fraction was purified using an adsorption resin XAD-8, and the alkaline eluate was made to pass through a cation exchange resin.Fluorescence and ultraviolet-visible spectrum measurements
Excitation–emission matrices (EEMs) were collected on dissolved HS (adjusted to 15 mg L−1) in a quartz cuvette using a fluorescence spectrophotometer (Hitachi, Model F-7000) equipped with a Xenon arc lamp (150 W). Scans were collected over increments of 5 nm for both excitation (200–450 nm) and emission (280–550 nm) wavelengths. The EEMs were blank subtracted, corrected for inner-filter effects and instrument-specific biases, and normalized to the Raman area. PARAFAC analysis identified several independent components across all HS samples. Ultraviolet-visible absorbance was measured with a Shimadzu UV-1800 Ultraviolet-visible spectrophotometer. Fluorescence and optical indices were calculated as previously described for humification index (HIX),26 specific ultraviolet absorbance at 254 nm (SUVA254, L (m mg)−1),1 spectral slope (S250–600),27 spectral area (A240–400),28 and ratio of ultraviolet visible absorbance at 465 and 665 nm (E4![[thin space (1/6-em)]](https://www.rsc.org/images/entities/char_2009.gif) :
:![[thin space (1/6-em)]](https://www.rsc.org/images/entities/char_2009.gif) E6).28
E6).28
Element and δ13C analysis
Carbon (C, g kg−1), hydrogen (H, g kg−1), oxygen (O, g kg−1), nitrogen (N, g kg−1), and sulphur (S, g kg−1) concentrations of HA and FA samples were determined using an elemental analyzer (VARIO EL cube). δ13C values (‰) of HA, FA and plant litter were measured using a Finnigan Delta-plus XP mass spectrometer. The standard deviation is less than 0.15‰ for δ13C.Incubation experiments and quantification of HS ETC
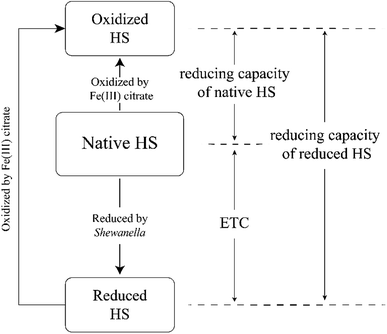
Shewanella oneidensis MR-1 (S. oneidensis MR-1) and Shewanella putrefaciens 200 (S. putrefaciens 200) were both cultured according to the procedures of Klüpfel et al.29 These two species were selected due to the fact that they are widely distributed in environmental matrices and can grow under both oxic and anoxic conditions, which was prerequisite for our incubation experiment.29–31 Aliquots of these two cultures were used to prepare inoculated HA and FA samples. HS solutions, lactate stock solutions, and LM basal medium were prepared following the methods of Klüpfel et al.29 HS (including inoculated HS samples and sterile HS controls) and lactate were added to the serum bottles containing LM basal medium to final concentrations of 2 mM lactate and 0.63–1.07 g HS L−1 and then sealed with butyl rubber stoppers followed by exchanging of the headspace with nitrogen. All incubation samples were conducted thrice in parallel. Each HS sample inoculated with S. oneidensis MR-1 or S. putrefaciens 200 received a single inoculum of about 105 cells mL−1 at the beginning of the incubations. All sample incubations were placed on a horizontal shaker (100 rpm, 25 °C) in the dark for 48 h to reach stability.Subsequently, aliquots of native HS and HS after microbial reduction were filtered and then incubated with Fe(III) citrate solutions for 48 h, in order to quantify their reducing capacities (number of electrons transferred from HS to an electron acceptor; in this case, Fe(III) citrate). We chose 48 h as incubation time because the objective of this study is to compare the relative values of ETC between different samples rather than to determine the absolute values of ETC. Reducing capacities of microbially reduced HS (or native HS) can be estimated by the concentration of Fe(II) formed during incubation, considering that Fe(III) was reduced to Fe(II) via accepting electrons from microbially reduced HS (or native HS) under incubation. The determination of the Fe(II) formed during incubation is based on the method of Tobias et al.32 In the present study, the difference of reducing capacities between HS after microbial reduction and native HS was referred to as ETC of HS (Fig. 1). The relative values of ETC were calculated based the following formula:
| ETC = CRFe/CRHS − CNFe/CNHS |
Statistical analysis
Linear regression analysis was used to assess the relationships between ETC and chemical structure indices of HS as well as between chemical structure indices and Δδ13C of HS. ANOVA was applied to compare the ETCs, chemical structure indices and Δδ13C of HS among different agricultural lands. Both linear regression analysis and ANOVA were conducted with SPSS 18.0 (SPSS, Inc.). The results were considered significant at P < 0.05.Results and discussion
ETCs of soil HS under different agricultural land-use types
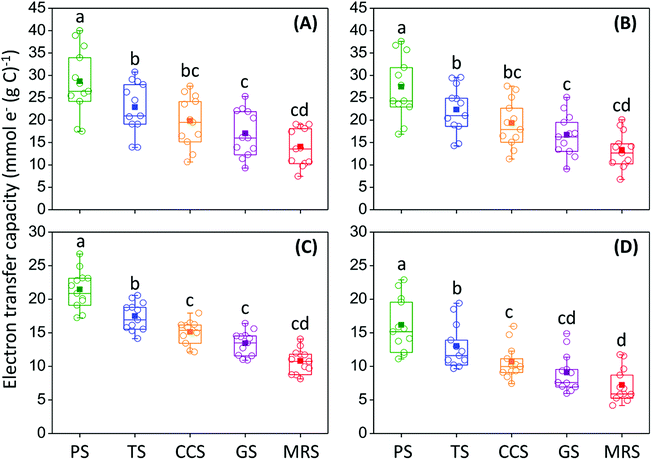
The ETCs of HS showed significant differences (P < 0.05) among soils under different agricultural land-use types. Under both incubations with S. oneidensis MR-1 and S. putrefaciens 200, HS in PS showed the highest ETC, followed by TS, CCS, GS, and MRS, respectively (Fig. 2). These results suggest that agricultural land-use types can exert significant influence on the ETCs of soil HS. Notably, ETC of HA showed the same order as that of FA among different agricultural land-use types (Fig. 2), indicating that the effect of agricultural land-use types on the ETC of HS is independent of HS fractions.Influence of the chemical structures of soil HS on their ETCs
A wide set of indices, which reflect the chemical structures of soil HS, were used to evaluate the influence of intrinsic physiochemical properties of soil HS on their ETCs. These indices included elemental compositions and ratios, HIX, fluorescence components, SUVA254, E4![[thin space (1/6-em)]](https://www.rsc.org/images/entities/char_2009.gif) :
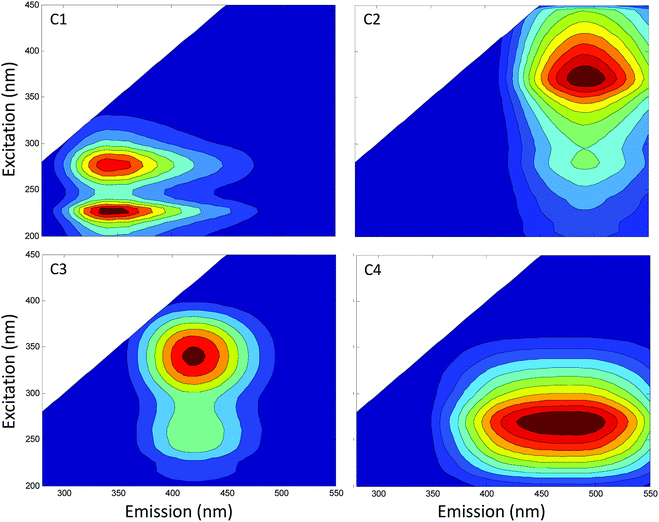
:![[thin space (1/6-em)]](https://www.rsc.org/images/entities/char_2009.gif) E6, A240–400, and S250–600. Parallel factor analysis identified four independent fluorescence components, that is, one protein-like or in situ production (C1), three humic-like (C2–C4) (Fig. 3).
E6, A240–400, and S250–600. Parallel factor analysis identified four independent fluorescence components, that is, one protein-like or in situ production (C1), three humic-like (C2–C4) (Fig. 3).
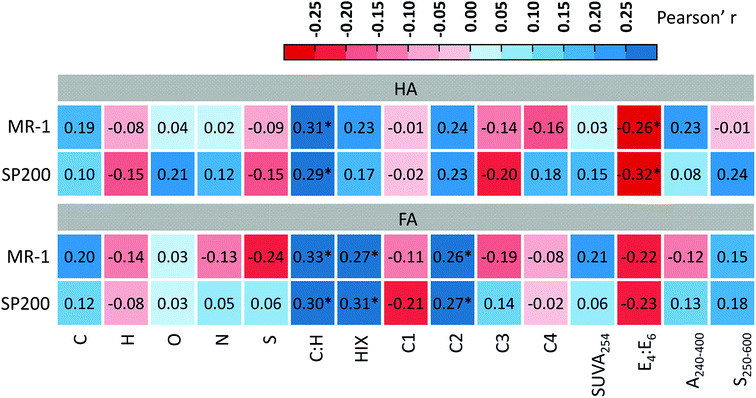
Correlation analysis showed that the ETC of soil HA was remarkably positively related to their C![[thin space (1/6-em)]](https://www.rsc.org/images/entities/char_2009.gif) :
:![[thin space (1/6-em)]](https://www.rsc.org/images/entities/char_2009.gif) H and significantly negatively associated with their E4
H and significantly negatively associated with their E4![[thin space (1/6-em)]](https://www.rsc.org/images/entities/char_2009.gif) :
:![[thin space (1/6-em)]](https://www.rsc.org/images/entities/char_2009.gif) E6, and that ETC of soil FA was significantly positively related to their C
E6, and that ETC of soil FA was significantly positively related to their C![[thin space (1/6-em)]](https://www.rsc.org/images/entities/char_2009.gif) :
:![[thin space (1/6-em)]](https://www.rsc.org/images/entities/char_2009.gif) H, HIX and C2 (Fig. 4). These results indicate that the causation of the chemical structure indices for the ETC of HS is dependent of HS fractions.
H, HIX and C2 (Fig. 4). These results indicate that the causation of the chemical structure indices for the ETC of HS is dependent of HS fractions.
High C![[thin space (1/6-em)]](https://www.rsc.org/images/entities/char_2009.gif) :
:![[thin space (1/6-em)]](https://www.rsc.org/images/entities/char_2009.gif) H and HIX of natural organic matter generally suggest a high condensation in the aromatic rings.1,20,26 A low E4
H and HIX of natural organic matter generally suggest a high condensation in the aromatic rings.1,20,26 A low E4![[thin space (1/6-em)]](https://www.rsc.org/images/entities/char_2009.gif) :
:![[thin space (1/6-em)]](https://www.rsc.org/images/entities/char_2009.gif) E6 of natural organic matter is largely attributed to absorption by moieties with aromatic carbon–carbon double bond.20 Direct comparisons of fluorescence and Fourier transform ion cyclotron resonance mass spectrometry analyses indicated that humic-like fluorescence generally covaried with aromatic structures.33 Taken together, C
E6 of natural organic matter is largely attributed to absorption by moieties with aromatic carbon–carbon double bond.20 Direct comparisons of fluorescence and Fourier transform ion cyclotron resonance mass spectrometry analyses indicated that humic-like fluorescence generally covaried with aromatic structures.33 Taken together, C![[thin space (1/6-em)]](https://www.rsc.org/images/entities/char_2009.gif) :
:![[thin space (1/6-em)]](https://www.rsc.org/images/entities/char_2009.gif) H, HIX, C2, and E4
H, HIX, C2, and E4![[thin space (1/6-em)]](https://www.rsc.org/images/entities/char_2009.gif) :
:![[thin space (1/6-em)]](https://www.rsc.org/images/entities/char_2009.gif) E6 can be used to indicate quinonoid structures. Thus, our results indicated that aromatic systems act as redox-active groups in HS, consistent with the existing viewpoint that quinones of HS are the major electron accepting moieties.4,34,35
E6 can be used to indicate quinonoid structures. Thus, our results indicated that aromatic systems act as redox-active groups in HS, consistent with the existing viewpoint that quinones of HS are the major electron accepting moieties.4,34,35
Chemical structure indices of HS were further compared among soils under different agricultural land-use types. The results showed that C![[thin space (1/6-em)]](https://www.rsc.org/images/entities/char_2009.gif) :
:![[thin space (1/6-em)]](https://www.rsc.org/images/entities/char_2009.gif) H, HIX and C2 exerted the same order as ETC of HA or FA among soils under different agricultural land-use types (Tables 2 and 3). On the contrary, the order of HA E4
H, HIX and C2 exerted the same order as ETC of HA or FA among soils under different agricultural land-use types (Tables 2 and 3). On the contrary, the order of HA E4![[thin space (1/6-em)]](https://www.rsc.org/images/entities/char_2009.gif) :
:![[thin space (1/6-em)]](https://www.rsc.org/images/entities/char_2009.gif) E6 among soils under different agricultural land-use types was opposite as the ETC of HA (Table 2). Overall, differences in C
E6 among soils under different agricultural land-use types was opposite as the ETC of HA (Table 2). Overall, differences in C![[thin space (1/6-em)]](https://www.rsc.org/images/entities/char_2009.gif) :
:![[thin space (1/6-em)]](https://www.rsc.org/images/entities/char_2009.gif) H, HIX, C2 and E4
H, HIX, C2 and E4![[thin space (1/6-em)]](https://www.rsc.org/images/entities/char_2009.gif) :
:![[thin space (1/6-em)]](https://www.rsc.org/images/entities/char_2009.gif) E6 were the direct reasons for the differences in ETC of soil HA or FA among different agricultural land-use types.
E6 were the direct reasons for the differences in ETC of soil HA or FA among different agricultural land-use types.
| PS | TS | CCS | GS | MRS | |
|---|---|---|---|---|---|
a PS, TS, CCS, GS and MRS denote paddy soil, tomato soil, celery cabbage soil, grapevine soil and myrica rubra soil, respectively. Values (C![[thin space (1/6-em)]](https://www.rsc.org/images/entities/char_2009.gif) : :![[thin space (1/6-em)]](https://www.rsc.org/images/entities/char_2009.gif) H and E4 H and E4![[thin space (1/6-em)]](https://www.rsc.org/images/entities/char_2009.gif) : :![[thin space (1/6-em)]](https://www.rsc.org/images/entities/char_2009.gif) E6) with the same lowercase letter represent no significant difference between each other. E6) with the same lowercase letter represent no significant difference between each other. |
|||||
| C (g per (kg HS)) | 468 (36) | 533 (17) | 543 (25) | 467 (34) | 432 (30) |
| H (g per (kg HS)) | 39 (7) | 42 (5) | 52 (4) | 50 (5) | 53 (6) |
| O (g per (kg HS)) | 304 (14) | 309 (9) | 309 (15) | 301 (17) | 301 (12) |
| N (g per (kg HS)) | 31.3 (9.4) | 23.5 (7.2) | 30.4 (6.8) | 28.7 (8.1) | 30.1 (7.5) |
| S (g per (kg HS)) | 6.4 (1.6) | 5.8 (0.9) | 5.7 (1.4) | 4.8 (1.8) | 5.0 (1.5) |
C![[thin space (1/6-em)]](https://www.rsc.org/images/entities/char_2009.gif) : :![[thin space (1/6-em)]](https://www.rsc.org/images/entities/char_2009.gif) H H |
1.15a (0.06) | 1.13a (0.08) | 1.02b (0.06) | 0.99b (0.10) | 0.74b (0.07) |
| HIX | 0.86 (0.05) | 0.89 (0.03) | 0.83 (0.04) | 0.96 (0.04) | 0.93 (0.04) |
| C1 (%) | 13.0 (1.2) | 9.3 (2.8) | 14.7 (3.4) | 7.9 (2.5) | 7.6 (1.4) |
| C2 (%) | 30.6 (3.3) | 34.0 (2.8) | 27.5 (5.4) | 42.5 (6.8) | 38.3 (5.1) |
| C3 (%) | 22.4 (2.5) | 25.4 (2.6) | 23.1 (3.2) | 27.5 (4.7) | 25.3 (5.0) |
| C4 (%) | 34.0 (2.2) | 31.3 (2.9) | 34.7 (3.1) | 22.1 (3.4) | 28.8 (3.3) |
| SUVA254 (L (m mg)−1) | 0.055 (0.003) | 0.060 (0.004) | 0.046 (0.004) | 0.050 (0.007) | 0.051 (0.008) |
E4![[thin space (1/6-em)]](https://www.rsc.org/images/entities/char_2009.gif) : :![[thin space (1/6-em)]](https://www.rsc.org/images/entities/char_2009.gif) E6 E6 |
3.21a (0.68) | 3.73b (0.87) | 4.31c (1.01) | 4.69cd (0.96) | 5.06d (0.86) |
| A240–400 | 55.5 (2.8) | 56.0 (3.7) | 54.9 (3.4) | 57.9 (3.6) | 61.7 (2.4) |
| S250–600 | 0.0019 (0.0002) | 0.0023 (0.0001) | 0.0017 (0.0001) | 0.0021 (0.0002) | 0.0020 (0.0001) |
| PS | TS | CCS | GS | MRS | |
|---|---|---|---|---|---|
a PS, TS, CCS, GS and MRS denote paddy soil, tomato soil, celery cabbage soil, grapevine soil and myrica rubra soil, respectively. Values (C![[thin space (1/6-em)]](https://www.rsc.org/images/entities/char_2009.gif) : :![[thin space (1/6-em)]](https://www.rsc.org/images/entities/char_2009.gif) H, HIX, and C2) with the same lowercase letter represent no significant difference between each other. H, HIX, and C2) with the same lowercase letter represent no significant difference between each other. |
|||||
| C (g per (kg HS)) | 425 (25) | 449 (28) | 410 (38) | 453 (39) | 479 (30) |
| H (g per (kg HS)) | 55 (4) | 55 (3) | 51 (8) | 52 (3) | 48 (3) |
| O (g per (kg HS)) | 342 (7) | 341 (9) | 320 (13) | 377 (18) | 315 (5) |
| N (g per (kg HS)) | 20.1 (8.3) | 27.0 (7.3) | 20.9 (7.5) | 21.4 (6.9) | 20.5 (6.7) |
| S (g per (kg HS)) | 5.8 (0.9) | 5.6 (1.1) | 6.7 (0.8) | 5.0 (1.0) | 6.1 (0.8) |
C![[thin space (1/6-em)]](https://www.rsc.org/images/entities/char_2009.gif) : :![[thin space (1/6-em)]](https://www.rsc.org/images/entities/char_2009.gif) H H |
0.71a (0.05) | 0.74b (0.07) | 0.75b (0.08) | 0.81c (0.09) | 0.87d (0.08) |
| HIX | 0.84a (0.03) | 0.88b (0.02) | 0.90bc (0.02) | 0.93cd (0.04) | 0.96d (0.03) |
| C1 (%) | 24.1 (5.3) | 22.5 (4.2) | 23.3 (3.4) | 25.7 (2.9) | 21.7 (3.0) |
| C2 (%) | 25.2a (3.2) | 31.2b (2.2) | 33.9bc (3.1) | 35.1c (2.4) | 39.0d (3.6) |
| C3 (%) | 16.4 (1.2) | 18.6 (3.8) | 16.2 (2.4) | 16.7 (3.2) | 16.9 (2.8) |
| C4 (%) | 34.3 (3.5) | 27.7 (3.8) | 26.6 (2.6) | 22.5 (2.7) | 22.4 (3.1) |
| SUVA254 (L (m mg)−1) | 0.021 (0.005) | 0.020 (0.002) | 0.017 (0.002) | 0.019 (0.003) | 0.021 (0.002) |
E4![[thin space (1/6-em)]](https://www.rsc.org/images/entities/char_2009.gif) : :![[thin space (1/6-em)]](https://www.rsc.org/images/entities/char_2009.gif) E6 E6 |
8.78 (0.62) | 7.10 (0.85) | 10.32 (0.98) | 7.18 (0.91) | 7.79 (0.67) |
| A240–400 | 21.0 (2.1) | 17.9 (1.5) | 16.7 (1.8) | 15.4 (2.0) | 21.2 (1.8) |
| S250–600 | 0.0007 (0.0001) | 0.0006 (0.0000) | 0.0005 (0.0001) | 0.0005 (0.0000) | 0.0007 (0.0001) |
Effects of transformation and decomposition of soil HS on their chemical structures
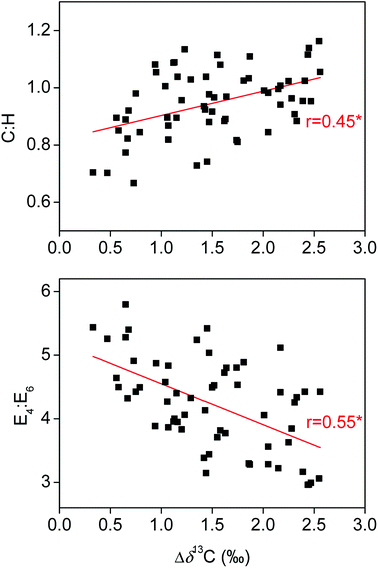
Both transformation and degradation processes of HS in soils are regulated by microbial activities. Soil microorganisms would prefer 13C-depleted organic compounds for respiration during the plant-litter decomposition, leaving the 13C-enriched organic compounds incorporated into the pool of soil organic matter.36 As such, the Δδ13C, which was defined as the difference in δ13C values between soil HS and plant litter in the present study, is generally proportional to the degree of transformation and decomposition of soil organic matter.36,37 Correlation analyses showed that the Δδ13C were significantly positively related to the C![[thin space (1/6-em)]](https://www.rsc.org/images/entities/char_2009.gif) :
:![[thin space (1/6-em)]](https://www.rsc.org/images/entities/char_2009.gif) H, HIX and C2 in HA or FA and remarkably negatively associated with the E4
H, HIX and C2 in HA or FA and remarkably negatively associated with the E4![[thin space (1/6-em)]](https://www.rsc.org/images/entities/char_2009.gif) :
:![[thin space (1/6-em)]](https://www.rsc.org/images/entities/char_2009.gif) E6 in HA (Fig. 5 and 6). HS transformation in soils is generally accompanied with oxidation of initial decomposition products with rich phenolic structures into highly condensed molecules with abundant quinone moieties.38,39 Moreover, HS decomposition in soils may lead to a preferential protection of quinone moieties,35 probably due to the fact that the quinone is more resistant to degradation than other moieties in oxidizing environments.40–42 Thus, our results suggest the positive effect of transformation and decomposition of soil HS governing the ETC of HS.
E6 in HA (Fig. 5 and 6). HS transformation in soils is generally accompanied with oxidation of initial decomposition products with rich phenolic structures into highly condensed molecules with abundant quinone moieties.38,39 Moreover, HS decomposition in soils may lead to a preferential protection of quinone moieties,35 probably due to the fact that the quinone is more resistant to degradation than other moieties in oxidizing environments.40–42 Thus, our results suggest the positive effect of transformation and decomposition of soil HS governing the ETC of HS.
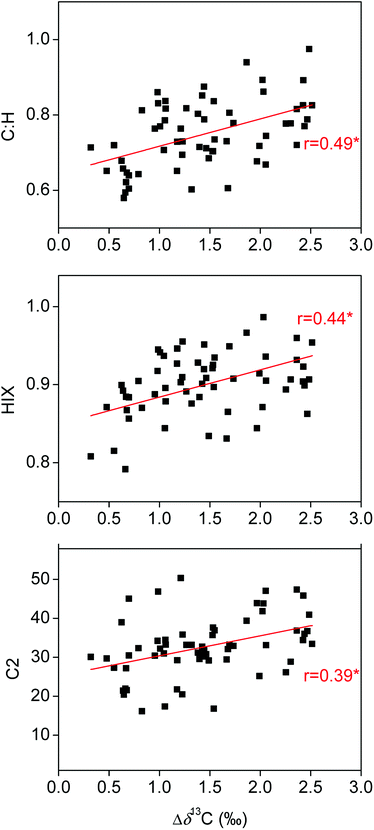 | ||
Fig. 6 Correlations of C![[thin space (1/6-em)]](https://www.rsc.org/images/entities/char_2009.gif) : :![[thin space (1/6-em)]](https://www.rsc.org/images/entities/char_2009.gif) H, humification index (HIX) and fluorescence components C2 of fulvic acids with their Δδ13C. The asterisk (*) indicates statistically significant correlation (P < 0.05). H, humification index (HIX) and fluorescence components C2 of fulvic acids with their Δδ13C. The asterisk (*) indicates statistically significant correlation (P < 0.05). | ||
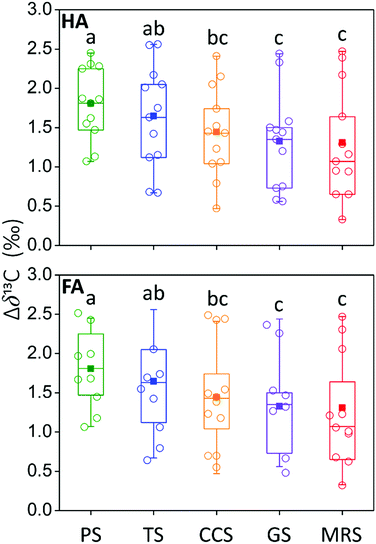
Δδ13C of HS was further compared among soils under different agricultural land-use types. The results showed that both HA and FA in PS showed the highest Δδ13C, followed by TS, CCS, GS, and MRS, respectively (Fig. 7), suggesting that agricultural land-use types had significant influence on the transformation and decomposition of soil HS. Given that Δδ13C exerted the same order as ETC of both HA and FA among soils under different agricultural land-use types, we deduced that the distinct processes of transformation and decomposition of soil HS may be the fundamental reasons for the significant differences in ETC of HS among soils under different agricultural land-use types.
Environmental implications
This work on the effect of agricultural land-use type on ETC of soil HS has several implications. First, change and variability in land use by humans are one key aspect of global change. Given the close association of HS ETC with reducing conversions of organic and inorganic pollutants in soil,7–10 our results suggest that land-use change from rice paddy field to agricultural dryland may lead to a decrease in soil anti-pollution ability, thereby threatening not only soil environment but also food safety. Second, although rice paddy field is considered a significant anthropogenic source of methane,43,44 HS may play the more significant role in suppressing methane production in paddy soil than in other agricultural drylands, considering that HS in PS exerted the greatest ETC among different agricultural land-use types.45,46 Enhancing the amount of NOM and content of functional groups with redox in HS will compete with CO2 for accepting electrons, thereby reducing methane production. At the same time, the HS is able to act electron donors for denitrification that can promote the conversion of N2O to N2.47–49 Third, our work suggests that regulating the environmental factors (e.g., decreasing the ratio of carbon to nitrogen in agricultural soil) for promoting the transformation and decomposition of soil organic matter and applying organic fertilizers to increase the content of HS in soil may be promising management strategies for enhancing the ETC of HS, which is critical in guaranteeing a sustainable soil environment in agroecosystem.Conclusion
In conclusion, the present study is the first to comprehensively assess the response of the ETC of soil HS to different agricultural land-use types. Our observations show that HS of PS showed the highest ETC, followed by TS, CCS, GS, and MRS, respectively. Agricultural land-use types could affect the transformation and decomposition of soil HS, and thus further altered their intrinsic chemical structures associated with ETC. Consequently, the ETC of soil HS exerted significant difference among different agricultural land-use types. Our results could improve understanding on redox properties of soil organic matter under the context of land-use change and provide aid in developing promising management strategies (e.g., applying organic fertilizer and decreasing the ratio of carbon to nitrogen in soil) for a sustainable soil environment and food safety in the agroecosystem.Conflicts of interest
There are no conflicts to declare.Acknowledgements
This work was financially supported by National Natural Science Foundation of China (Project No. 51508540, 41501242 and 51325804). We thank Lina Ma, Hongwei Pan and Yan Yang for assistance in the laboratory and with data analysis. Discussions with Bin Chen and Jian Xu improved the manuscript.References
- F. J. Stevenson, Humus Chemistry: Genesis, Composition, Reactions, John Wiley & Sons, New York, 1994 Search PubMed.
- G. R. Aiken, D. M. McKnight, R. L. Wershaw and P. MacCarthy, Humic Substances in Soil, Sediment and Water: Geochemistry, Isolation and Characterization, John Wiley & Sons, New York, 1985 Search PubMed.
- F. J. Cervantes, F. A. M. de Bok, D. D. Tuan, A. J. M. Stams, G. Lettinga and J. A. Field, Reduction of humic substances by halorespiring, sulphate-reducing and methanogenic microorganisms, Environ. Microbiol., 2002, 4(1), 51–57 CrossRef PubMed.
- D. R. Lovley, J. D. Coates, E. L. BluntHarris, E. J. P. Phillips and J. C. Woodward, Humic substances as electron acceptors for microbial respiration, Nature, 1996, 382, 445–448 CrossRef.
- M. Benz, B. Schink and A. Brune, Humic acid reduction by Propionibacterium freudenreichii and other fermenting bacteria, Appl. Environ. Microbiol., 1998, 64(11), 4507–4512 Search PubMed.
- I. Bauer and A. Kappler, Rates and extent of reduction of Fe(III) compounds and O2 by humic substances, Environ. Sci. Technol., 2009, 43(13), 4902–4908 CrossRef PubMed.
- A. Kappler and S. B. Haderlein, Natural organic matter as reductant for chlorinated aliphatic pollutants, Environ. Sci. Technol., 2003, 37(12), 2714–2719 CrossRef PubMed.
- F. R. Van der Zee and F. J. Cervantes, Impact and application of electron shuttles on the redox (bio)transformation of contaminants: A review, Biotechnol. Adv., 2009, 27(3), 256–277 CrossRef PubMed.
- B. H. Gu and J. Chen, Enhanced microbial reduction of Cr(VI) and U(VI) by different natural organic matter fractions, Geochim. Cosmochim. Acta, 2003, 67(19), 3575–3582 CrossRef.
- P. R. Wittbrodt and C. D. Palmer, Reduction of Cr(VI) by soil humic acids, Eur. J. Soil Sci., 1997, 48(1), 151–162 CrossRef.
- P. G. Tratnyek and D. L. Macalady, Abiotic reduction of nitro aromatic pesticides in anaerobic laboratory systems, J. Agric. Food Chem., 1989, 37(1), 248–254 CrossRef.
- F. M. Dunnivant, R. P. Schwarzenbach and D. L. Macalady, Reduction of substituted nitrobenzenes in aqueous solutions containing natural organic matter, Environ. Sci. Technol., 1992, 26(11), 2133–2141 CrossRef.
- D. T. Scott, D. M. McKnight, E. L. Blunt-Harris, S. E. Kolesar and D. R. Lovley, Quinone moieties act as electron acceptors in the reduction of humic substances by humics-reducing microorganisms, Environ. Sci. Technol., 1998, 32(19), 2984–2989 CrossRef.
- D. K. Newman and R. A. Kolter, Role of excreted quinones in extracellular electron transfer, Nature, 2000, 405(6782), 94–97 CrossRef PubMed.
- M. Aeschbacher, M. Sander and R. P. Schwarzenbach, Environ. Sci. Technol., 2010, 44(1), 87–93 CrossRef PubMed.
- V. Hernández-Montoya, L. H. Alvarez, M. A. Montes-Morán and F. J. Cervantes, Reduction of quinone and non-quinone redox functional groups in different humic acid samples by Geobacter sulfurreducens, Geoderma, 2012, 183–184, 25–31 CrossRef.
- R. L. Fimmen, R. M. Cory and Y.-P. Chin, et al., Probing the oxidation–reduction properties of terrestrially and microbially derived dissolved organic matter, Geochim. Cosmochim. Acta, 2007, 71(12), 3003–3015 CrossRef.
- Z. Struyk and G. Sposito, Redox properties of standard humic acids, Geoderma, 2001, 102(3–4), 329–346 CrossRef.
- F. Einsiedl, B. Mayer and T. Schafer, Evidence for incorporation of H2S in groundwater fulvic acids from stable isotope ratios and sulfur K-edge X-ray absorption near edge structure spectroscopy, Environ. Sci. Technol., 2008, 42(7), 2439–2444 CrossRef PubMed.
- M. Kleber and M. G. Johnson, Advances in understanding the molecular structure of soil organic matter: implications for interactions in the environment, Adv. Agron., 2010, 106, 77–142 Search PubMed.
- G. R. Shaver, J. Canadell, F. S. Chapin, J. Gurevitch, J. Harte, G. Henry, P. Ineson, S. Jonasson, J. Melillo, L. Pitelka and L. Rustad, Global warming and terrestrial ecosystems: a conceptual framework for analysis, BioScience, 2000, 50(10), 871–882 CrossRef.
- X. Feng, A. J. Simpson, K. P. Wilson, D. D. Williams and M. J. Simpson, Nat. Geosci., 2008, 1(12), 836–839 CrossRef.
- O. Pisani, K. M. Hills, D. Courtier-Murias, M. L. Haddix, E. A. Paul, R. T. Conant, A. J Simpson, G. B. Arhonditsis and M. J. Simpson, Accumulation of aliphatic compounds in soil with increasing mean annual temperature, Org. Geochem., 2014, 76, 118–127 CrossRef.
- O. Pisani, S. D. Frey, A. J. Simpson and M. J. Simpson, Soil warming and nitrogen deposition alter soil organic matter composition at the molecular-level, Biogeochemistry, 2015, 123(3), 391–409 CrossRef.
- R. S. Swift, Organic matter characterization, in Methods of Soil Analysis, Part 3. Chemical Methods, ed. D. L. Sparks, Soil Science Society of America, Madison WI, 1996, pp. 1018–1021 Search PubMed.
- T. Ohno, Fluorescence inner-filtering correction for determining the humification index of dissolved organic matter, Environ. Sci. Technol., 2002, 36(19), 742–746 CrossRef PubMed.
- J. R. Helms, A. Stubbins, J. D. Ritchie, E. C. Minor, D. J. Kieber and K. Mopper, Absorption spectral slopes and slope ratios as indicators of molecular weight, source, and photobleaching of chromophoric dissolved organic matter, Limnol. Oceanogr., 2008, 53(3), 955–969 CrossRef.
- M. Fuentes, G. González-Gaitano, M. José and J. M. García-Mina, The usefulness of UV–visible and fluorescence spectroscopies to study the chemical nature of humic substances from soils and composts, Org. Geochem., 2006, 37(12), 1949–1959 CrossRef.
- L. Klüpfel, A. Piepenbrock, A. Kappler and M. Sander, Humic substances as fully regenerable electron acceptors in recurrently anoxic environments, Nat. Geosci., 2014, 7(3), 195–200 CrossRef.
- S. Pirbadian, S. E. Barchinger and K. M. Leung, et al., Shewanella oneidensis MR-1 nanowires are outer membrane and periplasmic extensions of the extracellular electron transport components, Proc. Natl. Acad. Sci. U. S. A., 2014, 111(35), 12883–12888 CrossRef PubMed.
- E. E. Roden, A. Kappler and I. Bauer, et al., Extracellular electron transfer through microbial reduction of solid-phase humic substances, Nat. Geosci., 2010, 3, 417 CrossRef.
- H. Tobias, G. Tobias and B. Julia, et al., Electron transfer of dissolved organic matter and its potential significance for anaerobic respiration in a northern bog, Glob. Change Biol., 2010, 13(8), 1771–1785 Search PubMed.
- P. Herzsprung, W. von Tümpling, N. Hertkorn, M. Harir, O. Büttner, J. Bravidor, K. Friese and P. Schmitt-Kopplin, Variations of DOM quality in inflows of a drinking water reservoir: Linking of van Krevelen diagrams with EEMF spectra by rank correlation, Environ. Sci. Technol., 2012, 46(10), 5511–5518 CrossRef PubMed.
- M. Aeschbacher, D. Vergari, R. P. Schwarzenbach and M. Sander, Electrochemical analysis of proton and electron transfer equilibria of the reducible moieties in humic acids, Environ. Sci. Technol., 2011, 45(19), 8385–8394 CrossRef PubMed.
- M. Aeschbacher, C. Graf, R. P. Schwarzenbach and M. Sander, Antioxidant properties of humic substances, Environ. Sci. Technol., 2012, 46(9), 4916–4925 CrossRef PubMed.
- X. Feng, A theoretical analysis of carbon isotope evolution of decomposing plant litters and soil organic matter, Global Biogeochem. Cycles, 2002, 16(4), 1119–1130 CrossRef.
- W. Tan, L. Zhou and K. Liu, Soil aggregate fraction-based 14C analysis and its application in the study of soil organic carbon turnover under forests of different ages, Chin. Sci. Bull., 2013, 58(16), 1936–1947 CrossRef.
- S. Kawai, T. Umezawa and T. Higuchi, Degradation mechanisms of phenolic β-1 lignin substructure model compounds by laccase of coriolus versicolor, Arch. Biochem. Biophys., 1998, 262(1), 99–110 CrossRef.
- U. Tuor, H. Wariishi, H. E. Schoemaker and M. H. Gold, Oxidation of phenolic arylglycerol β-aryl ether lignin model compounds by manganese peroxidase from Phenerochaete chrysosporium: Oxidative cleavage of an α-carbonyl model compound, Biochemistry, 1992, 31(21), 4986–4995 CrossRef PubMed.
- D. L. Rimmer, Free radicals, antioxidants, and soil organic matter recalcitrance, Eur. J. Soil Sci., 2006, 57(2), 91–94 CrossRef.
- D. L. Rimmer and A. M. Smith, Antioxidants in soil organic matter and in associated plant materials, Eur. J. Soil Sci., 2009, 60(2), 170–175 CrossRef.
- D. L. Rimmer and G. D. Abbott, Phenolic compounds in NaOH extracts of UK soils and their contribution to antioxidant capacity, Eur. J. Soil Sci., 2011, 62(2), 285–294 CrossRef.
- Climate change 2007: the physical science basis, IPCC, Cambridge University Press, Cambridge, United Kingdom, New York, NY, USA, 2007 Search PubMed.
- T. Tokida, M. Adachi, W. Cheng, Y. Nakajima, T. Fumoto, M. Matsushima, H. Nakamura, M. Okada, R. Sameshima and T. Hasegawa, Methane and soil CO2 production from current-season photosynthates in a rice paddy exposed to elevated CO2 concentration and soil temperature, Global Biogeochem. Cycles, 2011, 17(11), 3327–3337 Search PubMed.
- W. Tan, Y. Zhang and B. Xi, et al., Discrepant responses of the electron transfer capacity of soil humic substances to irrigations with wastewaters from different sources, Sci. Total Environ., 2017, 610–611, 333–341 Search PubMed.
- W. Tan, B. Xi and G. Wang, et al., Increased Electron-Accepting and Decreased Electron-Donating Capacities of Soil Humic Substances in Response to Increasing Temperature, Environ. Sci. Technol., 2017, 51(6), 3176 CrossRef PubMed.
- C. Aranda-Tamaura, M. I. Estrada-Alvarado and A. C. Texier, et al., Effects of different quinoid redox mediators on the removal of sulphide and nitrate via denitrification, Chemosphere, 2007, 69(11), 1722–1727 CrossRef PubMed.
- E. I. Valenzuela, A. Prietodavó and N. E. Lópezlozano, et al., Anaerobic methane oxidation driven by microbial reduction of natural organic matter in a tropical wetland, Appl. Environ. Microbiol., 2017, 83(11), e00645-17 CrossRef PubMed.
- C. M. Martinez, L. H. Alvarez and L. B. Celis, et al., Humus-reducing microorganisms and their valuable contribution in environmental processes, Appl. Microbiol. Biotechnol., 2013, 97(24), 10293–10308 CrossRef PubMed.
| This journal is © The Royal Society of Chemistry 2018 |

