 Open Access Article
New insights into the effect of morphology on catalytic properties of MnOx–CeO2 mixed oxides for chlorobenzene degradation
Zhiming Li†
,
Xiaolin Guo†,
Fei Tao and
Renxian Zhou *
*
Institute of Catalysis, Zhejiang University, Hangzhou 310028, PR China. E-mail: zhourenxian@zju.edu.cn
First published on 16th July 2018
Abstract
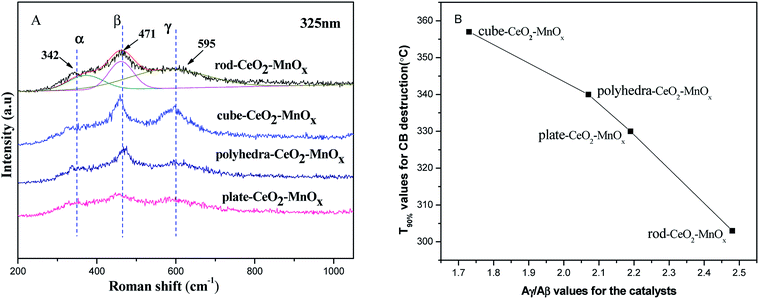
We synthesized four CeO2–MnOx mixed oxides with different morphologies using simple hydrothermal methods. The catalytic activity for chlorobenzene (CB) degradation decreases in the following order: rod-CeO2–MnOx > plate-CeO2–MnOx > polyhedra-CeO2–MnOx > cube-CeO2–MnOx. CeO2 and MnOx in the mixed oxides are highly dispersed and two new phases of both todorokite (S.G.: P2/m:b) and vernadite (S.G.: I4/m) with a special tunnel-like structure are found. Both rod-CeO2–MnOx and plate-CeO2–MnOx exhibit increased lattice microstrains generated from lattice distortion and defects; further, there are more oxygen vacancies and more MnOx (Mn4+ and Mn2+) species on the surface, particularly when compared to cube-CeO2–MnOx. Therefore, this promotes deeper oxidation activity for CB. Moreover, the strong interaction between CeO2 and MnOx also promotes the redox ability of CeO2–MnOx mixed oxides, while their oxygen storage capacity (OSC) properties are not only intrinsic to their structures but also limited to their surfaces and by their particle sizes.
1. Introduction
Chlorinated volatile organic compounds (Cl-VOCs) as the main air pollutants are known to be dangerous to the health of humans as well as the environment.1,2 Catalytic combustion technology is considered to be an efficient way to control Cl-VOC emissions and is extensively used.3 So far, efforts have been made to investigate all kinds of catalysts including noble metals, zeolites, transition metal oxides, and their mixtures. Although the catalytic activity of noble metals is higher, their industrial applications are very difficult because of high cost and easy deactivation. In order to find cheaper substitutes to noble metal catalysts, the use of various mixed metal oxides has attracted much attention. Mixed oxides such as CeO2–MnOx,4,5 CeO2–CuO,6 CeO2–ZrO2,7 CeO2–CrOx,8 and CeO2–TiO2 (ref. 9) exhibit excellent catalytic properties for the deep oxidation of Cl-VOCs. Recently, metal oxide crystals with different exposed facets have attracted a lot of attention due to their unique electronic properties and higher reactivity when compared to the bulk phase. For example, Shen et al.10 found that Co3O4 nanorods still exhibit exemplary catalytic performances for CO oxidation even at −77 °C. Mai et al.11 also found that the exposed crystalline planes of CeO2 have an important effect on the ability of a catalyst to release and uptake oxygen as well as its catalytic performance. CeO2 nanorods with exposed {110} and {100} facets show higher catalytic activity than CeO2 nanoparticles with primarily exposed {111} facets toward CO oxidation, because the {110} and {100} facets form oxygen vacancies more easily than the stable {111} facet. Similarly, for other oxidation reactions, the structure and morphology of CeO2 also displays major effects on the catalytic performance. For instance, Dai et al.12 found that in the dichloroethane oxidation reaction, CeO2 nanorods have higher catalytic activity than CeO2 nanocubes and CeO2 nanopolyhedra, and the catalytic activity decreases in the sequence of rod > cube > polyhedron. Chen et al.13 also found that Ce1−xMxO2 (M = Ti, Zr, and Hf) nanomaterials with exposed {110}, {100}, and {111} facets also display significant morphological effects in ethanol steam reforming reaction and the catalytic performance decreases in the sequence of rod > pipe > cube. The explanation for the better catalytic performance of the metal-doped Ce1−xMxO2 nanorods is not only related to their exposure to the {110} and {100} facets, but the doping of metals also significantly increases the specific surface area as well as oxygen storage capacity (OSC) of nanomaterials. Recently, CeO2–MnOx mixed oxides with high OSC and multiple valences have also attracted much attention, out of which mixed oxides exhibit superior catalytic activity in different reactions like the catalytic reduction of NOx with NH3, catalytic decomposition of NOx, and catalytic oxidation of CO/VOCs at lower temperatures.14–17 However, their characteristics are still under debate and meaningful to investigate.In the present study, four CeO2–MnOx mixed oxides with different morphologies (rods, plates, polyhedra, and cubes) were synthesized using simple hydrothermal methods and evaluated for the deep oxidation performance of chlorobenzene (CB) as typical Cl-VOCs. The mixed oxides were characterized using X-ray diffraction (XRD), X-ray photoelectron spectroscopy (XPS), high-resolution transmission electron microscopy (HR-TEM), N2 adsorption–desorption, and temperature-programmed reduction (H2-TPR) techniques. The structural properties of CeO2–MnOx catalysts were investigated by XRD Rietveld refinement in order to obtain new information about the morphological effect.
2. Experimental
2.1 Catalysts' preparation
Nanorod and nanocube CeO2–MnOx mixed oxides were synthesized by simple hydrothermal methods.18 Here, 1.16 g Ce(NO3)3·6H2O and 0.24 g Mn(NO3)2 were added into 20 mL deionized water. In a Teflon-lined autoclave, the mixture was slowly added into 60 mL NaOH solution with different concentrations (rod: 4 mol L−1; cube: 6 mol L−1) under vigorous stirring for 30 min and then heated to different temperatures (rod: 100 °C; cube: 180 °C) for 24 h (rod) or 12 h (cube).The nanoplate CeO2–MnOx catalyst was synthesized by a CTAB-assisted hydrothermal method.19 Here, 2.61 g Ce(NO3)3·6H2O, 0.54 g Mn(NO3)2, and 0.73 g CTAB were added into 70 mL distilled water. Afterwards, 10 mL NH3·H2O was slowly added dropwise into the mixed solution under vigorous stirring for 30 min. Then, the mixture was transferred to a Teflon-lined autoclave and heated to 100 °C for 24 h.
The nanopolyhedra CeO2–MnOx catalyst was synthesized by the method reported in the literature.20 Here, 3.47 g Ce(NO3)3·6H2O, 0.72 g Mn(NO3)2, and 1.0 g polyvinyl pyrrolidone (PVP; molecular weight = 3000 g mol−1) were added into an autoclave with 40 mL deionized water under vigorous stirring for 30 min. Then, 10 mL N2H4·H2O was slowly added dropwise into the mixed solution under vigorous stirring for 30 min and heated to 180 °C for 12 h.
The above precipitates were obtained after centrifuging and washing in turn by distilled water and ethanol. The precipitated solids were dried at 60 °C overnight and then calcined in air at 500 °C for 2 h. Afterwards, the samples were sieved to 40–60 meshes (0.3–0.45 mm) and labeled as rod-CeO2–MnOx, cube-CeO2–MnOx, plate-CeO2–MnOx, and polyhedral-CeO2–MnOx. The molar ratio of Ce/Mn is 2![[thin space (1/6-em)]](https://www.rsc.org/images/entities/char_2009.gif) :
:![[thin space (1/6-em)]](https://www.rsc.org/images/entities/char_2009.gif) 1 in all the samples.
1 in all the samples.
2.2 Catalysts' characterization
XRD was performed on ARLX’TRA apparatus (Cu Kα radiation, 250 mA, and 40 kV) with 2θ = 10–100°. The XRD Rietveld refinements of the catalysts were performed with Maud software to obtain the microstructure data and the pseudo-Voigt profile function was used to qualitatively and quantitatively analyze the structure.UV-Raman spectra were recorded on a UV-HR Raman spectrograph apparatus equipped with a laser at 325 nm. The range of the Raman spectra was 100–1000 cm−1 and the spectral resolution was 4 cm−1.
The XPS spectra were recorded on a Thermo K-Alpha apparatus equipped with 84 W Al Kα radiation. The binding energies (BEs) of various elements were calibrated using the C 1s peak (284.6 eV).
HR-TEM images were obtained using a TECNAI G220 apparatus at 200 kV. In order to identify the chemical composition, energy dispersive spectrometry (EDS) analysis was performed.
H2-TPR experiment was carried out on a quartz fixed-bed microreactor equipped with a TCD detector. Before testing, 50 mg of the sample was pretreated in N2 flow (30 mL min−1) at 200 °C for 30 min and then cooled down to 100 °C. After stabilization, TPR experiments were performed from 100 to 600 °C at a heating rate of 10 °C min−1 under 5 vol% H2/Ar flow (40 mL min−1).
The OSC experiment was carried out on a CHEMBET-3000 apparatus (Quantachrome Co.) equipped with a TCD detector using the pulse injection of CO. Before testing, the samples were pretreated under H2 flow (30 mL min−1) at 500 °C for 2 h and then cooled down to 400 °C. After stabilization, the gas was switched to He flow (40 mL min−1) for 30 min.
The specific surface areas (SBET) were determined by N2 adsorption/desorption isotherms at 77 K with Brunauer–Emmett–Teller (BET) theory operating on a Micrometrics TriStar II 2020 analyzer.
2.3 Catalytic activity tests
The catalytic performances of the samples employed in the oxidation of CB were measured in a fixed-bed quartz reactor with 300 mg of catalyst under atmospheric pressure. The reactant gas mixture consisted of CB (1000 ppm) and dry air with a GHSV of 15![[thin space (1/6-em)]](https://www.rsc.org/images/entities/char_2009.gif) 000 h−1. The outlet gas was monitored online by a gas chromatograph equipped with TCD and FID detectors. The durability test of the catalysts for DCE degradation was also evaluated. It was exposed to dry air or in the existence of water (2.3 v/v%) or benzene (500 ppm) continuously for a long time.
000 h−1. The outlet gas was monitored online by a gas chromatograph equipped with TCD and FID detectors. The durability test of the catalysts for DCE degradation was also evaluated. It was exposed to dry air or in the existence of water (2.3 v/v%) or benzene (500 ppm) continuously for a long time.
3. Results and discussion
3.1 Catalytic performance tests
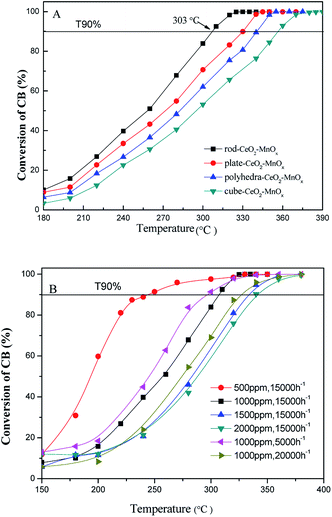 | ||
| Fig. 1 (A) Catalytic activity of CeO2–MnOx catalysts with different morphologies and (B) rod-CeO2–MnOx with different CB concentrations and GHSV for CB degradation. | ||
Fig. 1B shows the catalytic performances of rod-CeO2–MnOx with different CB concentrations and GHSVs. On one hand, it can be seen that when the GHSV is fixed at 15![[thin space (1/6-em)]](https://www.rsc.org/images/entities/char_2009.gif) 000 h−1, the catalytic activity of the catalyst gradually decreases with higher CB concentration; here, T90% increases by about 100 °C (from 244 °C to 342 °C) as the CB concentration increases from 500 to 2000 ppm. On the other hand, the CB concentration is equal to 1000 ppm and the catalytic performance is evaluated with different GHSVs. The results indicate that higher GHSV leads to poor catalytic performance of rod-CeO2–MnOx for CB destruction, which is due to the shorter retention time of CB in the catalyst bed with high GHSV.
000 h−1, the catalytic activity of the catalyst gradually decreases with higher CB concentration; here, T90% increases by about 100 °C (from 244 °C to 342 °C) as the CB concentration increases from 500 to 2000 ppm. On the other hand, the CB concentration is equal to 1000 ppm and the catalytic performance is evaluated with different GHSVs. The results indicate that higher GHSV leads to poor catalytic performance of rod-CeO2–MnOx for CB destruction, which is due to the shorter retention time of CB in the catalyst bed with high GHSV.
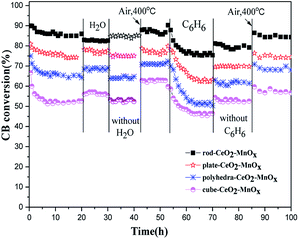 | ||
| Fig. 2 Durability test of CeO2–MnOx catalysts with different morphologies for CB degradation in dry air, H2O (2.3 v/v%), or C6H6 (500 ppm) at 310 °C. | ||
In addition, the effect of other VOCs on the catalytic activities of CeO2–MnOx for CB degradation is also evaluated. As shown in Fig. 2, after a certain concentration of benzene (500 ppm) was injected into the reaction system, CB conversions over the CeO2–MnOx catalysts decrease in an obvious manner, and the catalytic activity of all the four catalysts could not recover after removing C6H6. However, after being treated in dry air at 400 °C for 30 min, the decreased activities of CeO2–MnOx catalysts are completely recovered. According to the literature,24 the presence of C6H6 could result in strong competitive adsorption and oxidation of C6H6 on the active sites of catalysts for CB destruction and increase the carbon content on the used samples, which dramatically decreases the catalytic activity of CeO2–MnOx catalysts.
3.2 Structural properties of catalysts
![[3 with combining macron]](https://www.rsc.org/images/entities/char_0033_0304.gif) m) with a fluorite structure are observed in all the samples, but the rod-MnOx–CeO2 shows the broadest peak as compared to the other three catalysts, indicating that the particle size of the rod-MnOx–CeO2 is smaller. Except for the characteristic peaks of CeO2, the diffraction peaks of Mn3O4 (S.G.: I41/amd) appeared at 2θ = ∼36.3° and 59.9° in all the catalysts, and the diffraction peak of MnO2 (S.G.: I4/m) appeared at 2θ = 12.5° in rod-MnOx–CeO2 and plate-MnOx–CeO2 are also observed.25,26 In addition, it is noteworthy that two new phases (todorokite and vernadite) with a special tunnel-like structure, which are usually ignored, are found in the MnOx–CeO2 mixed oxides. The diffraction peak assigned to the new phase appears at lower than 20°. The todorokite phase (S.G.: P2/m:b) exists in all the MnOx–CeO2 mixed oxides, while the vernadite phase (S.G.: I4/m) only exists in rod-MnOx–CeO2. According to the intensity of the diffraction peak at lower than 20°, this means that the content of the new phases is the highest in rod-MnOx–CeO2 and the lowest in cube-CeO2–MnOx, which is consistent with the activity of the catalysts. Therefore, the result probably implies that the existence of both todorokite and vernadite phases with a special tunnel-like structure can promote the catalytic performance for CB oxidation. On the other hand, the results of Rietveld refinements also suggest that for CeO2–MnOx mixed oxides, CeO2 and MnOx crystallites are highly dispersed within each other, indicating that Mn3+ or Mn2+ cannot enter into the CeO2 lattice to form CeMnOx solid solution, which is considered in the literature.4,5 As shown in Table 1, the lattice microstrains of CeO2 on different facets in rod-CeO2–MnOx are bigger than those in the other three catalysts. In particular, for the {110} and {100} facets, the lattice microstrain of rod-CeO2–MnOx is the highest and apparently higher than those of both polyhedra-CeO2–MnOx and cube-CeO2–MnOx. The lattice microstrain decreases in the following sequence: rod-CeO2–MnOx > plate-CeO2–MnOx > polyhedra-CeO2–MnOx > cube-CeO2–MnOx. The microstrain is generated due to lattice distortion and defects, which is favorable to forming more oxygen vacancies. Thus, the increased oxygen vacancy concentration would facilitate the process in which the active oxygen species existing on the subsurface migrate toward the surface of the catalysts, resulting in increasing catalytic activity. Moreover, the size of the CeO2 crystallites (Table 1) can also explain the growth characteristics of the exposed crystal planes; for example, the exposed {100} (78.49 Å) and {110} (84.77 Å) planes of rod-CeO2–MnOx grow on the orientated attachment with a [110] growth direction. Further, this is in agreement with the results of the HRTEM (discussed below).
m) with a fluorite structure are observed in all the samples, but the rod-MnOx–CeO2 shows the broadest peak as compared to the other three catalysts, indicating that the particle size of the rod-MnOx–CeO2 is smaller. Except for the characteristic peaks of CeO2, the diffraction peaks of Mn3O4 (S.G.: I41/amd) appeared at 2θ = ∼36.3° and 59.9° in all the catalysts, and the diffraction peak of MnO2 (S.G.: I4/m) appeared at 2θ = 12.5° in rod-MnOx–CeO2 and plate-MnOx–CeO2 are also observed.25,26 In addition, it is noteworthy that two new phases (todorokite and vernadite) with a special tunnel-like structure, which are usually ignored, are found in the MnOx–CeO2 mixed oxides. The diffraction peak assigned to the new phase appears at lower than 20°. The todorokite phase (S.G.: P2/m:b) exists in all the MnOx–CeO2 mixed oxides, while the vernadite phase (S.G.: I4/m) only exists in rod-MnOx–CeO2. According to the intensity of the diffraction peak at lower than 20°, this means that the content of the new phases is the highest in rod-MnOx–CeO2 and the lowest in cube-CeO2–MnOx, which is consistent with the activity of the catalysts. Therefore, the result probably implies that the existence of both todorokite and vernadite phases with a special tunnel-like structure can promote the catalytic performance for CB oxidation. On the other hand, the results of Rietveld refinements also suggest that for CeO2–MnOx mixed oxides, CeO2 and MnOx crystallites are highly dispersed within each other, indicating that Mn3+ or Mn2+ cannot enter into the CeO2 lattice to form CeMnOx solid solution, which is considered in the literature.4,5 As shown in Table 1, the lattice microstrains of CeO2 on different facets in rod-CeO2–MnOx are bigger than those in the other three catalysts. In particular, for the {110} and {100} facets, the lattice microstrain of rod-CeO2–MnOx is the highest and apparently higher than those of both polyhedra-CeO2–MnOx and cube-CeO2–MnOx. The lattice microstrain decreases in the following sequence: rod-CeO2–MnOx > plate-CeO2–MnOx > polyhedra-CeO2–MnOx > cube-CeO2–MnOx. The microstrain is generated due to lattice distortion and defects, which is favorable to forming more oxygen vacancies. Thus, the increased oxygen vacancy concentration would facilitate the process in which the active oxygen species existing on the subsurface migrate toward the surface of the catalysts, resulting in increasing catalytic activity. Moreover, the size of the CeO2 crystallites (Table 1) can also explain the growth characteristics of the exposed crystal planes; for example, the exposed {100} (78.49 Å) and {110} (84.77 Å) planes of rod-CeO2–MnOx grow on the orientated attachment with a [110] growth direction. Further, this is in agreement with the results of the HRTEM (discussed below).
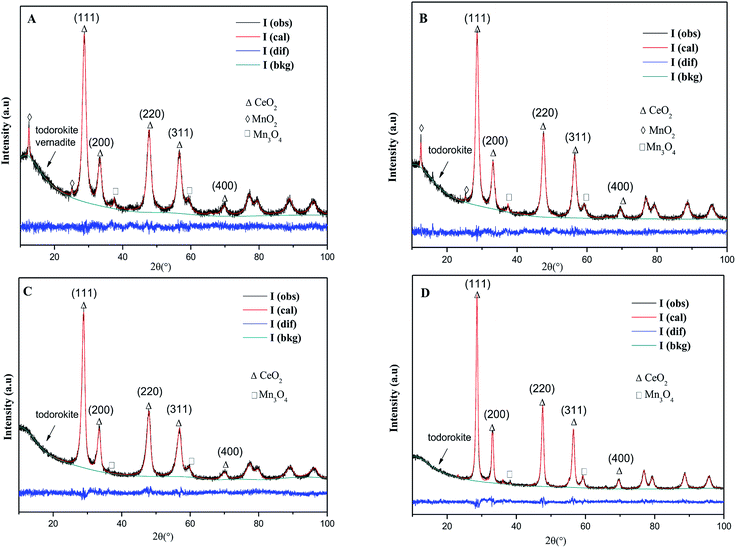 | ||
| Fig. 3 XRD and Rietveld XRD patterns of CeO2–MnOx catalysts with different morphologies: (A) rod-CeO2–MnOx, (B) plate-CeO2–MnOx, (C) polyhedra-CeO2–MnOx, and (D) cube-CeO2–MnOx. | ||
| Samples | Component | S.G. | a/Å | b/Å | c/Å | CeO2 crystallite (Å) | R.M.S. microstrain/CeO2 |
|---|---|---|---|---|---|---|---|
| Rod-CeO2–MnOx | CeO2 | Fm![[3 with combining macron]](https://www.rsc.org/images/entities/char_0033_0304.gif) m m |
5.376 | — | — | ||
| MnO2 | I4/m | 10.049 | — | 2.371 | {111}:79.10 | {111}:0.005 | |
| Mn3O4 | I41/amd | 5.765 | — | 9.450 | {100}:78.49 | {100}:0.013 | |
| Todorokite | P2/m:b | 7.905 | 2.237 | 10.535 | {110}:84.77 | {110}:0.008 | |
| Vernadite | I4/m | 9.445 | — | 2.855 | |||
| Plate-CeO2–MnOx | CeO2 | Fm![[3 with combining macron]](https://www.rsc.org/images/entities/char_0033_0304.gif) m m |
5.381 | — | — | {111}:86.10 | {111}:0.003 |
| MnO2 | I4/m | 10.049 | — | 2.371 | {100}:80.49 | {100}:0.009 | |
| Mn3O4 | I41/amd | 5.765 | — | 9.450 | {110}:82.75 | {110}:0.006 | |
| Todorokite | P2/m:b | 7.916 | 2.248 | 10.533 | |||
| Polyhedra-CeO2–MnOx | CeO2 | Fm![[3 with combining macron]](https://www.rsc.org/images/entities/char_0033_0304.gif) m m |
5.389 | — | — | {111}:105.62 | {111}:0.004 |
| Mn3O4 | I41/amd | 5.765 | — | 9.450 | {100}:103.79 | {100}:0.005 | |
| Todorokite | P2/m:b | 7.989 | 2.253 | 10.563 | {110}:113.74 | {110}:0.003 | |
| Cube-CeO2–MnOx | CeO2 | Fm![[3 with combining macron]](https://www.rsc.org/images/entities/char_0033_0304.gif) m m |
5.398 | — | — | {111}:116.62 | {111}:0.004 |
| Mn3O4 | I41/amd | 5.765 | — | 9.450 | {100}:107.73 | {100}:0.004 | |
| Todorokite | P2/m:b | 7.934 | 2.247 | 10.559 | {110}:110.29 | {110}:0.003 |
| Samples | Surface composition (at%) | Mn distribution (at%) | O distribution (at%) | Mn/Ce | Ce3+/Ce4+ | |||||
|---|---|---|---|---|---|---|---|---|---|---|
| Ce 3d | Mn 2p | O 1s | Mn4+ | Mn3+ | Mn2+ | Olatt | Osur | |||
| Rod-CeO2–MnOx | 16.12 | 11.25 | 72.63 | 6.04 | 1.49 | 3.56 | 43.47 | 29.16 | 0.70 | 0.48 |
| Plate-CeO2–MnOx | 19.09 | 9.85 | 71.06 | 4.89 | 1.40 | 3.45 | 44.71 | 26.35 | 0.52 | 0.42 |
| Polyhedra-CeO2–MnOx | 23.45 | 8.66 | 67.89 | 4.21 | 2.93 | 1.42 | 46.75 | 21.14 | 0.37 | 0.36 |
| Cube-CeO2–MnOx | 26.79 | 7.72 | 65.49 | 4.74 | 2.08 | 0.84 | 48.37 | 17.12 | 0.29 | 0.28 |
3.3 Morphologies of catalysts
As shown in Fig. 5, CeO2–MnOx mixed oxides with different morphologies were successfully synthesized. Fig. 5A and B show that rod-CeO2–MnOx catalyst is a long rod-like nanoparticle with dimensions of (10.5 ± 1.6) nm × (50–200) nm, clearly showing three different lattice plane spacings ascribed to the {111} (0.31 nm), {002} (0.28 nm), and {110} (0.19 nm) facets. Interestingly, when observed and calculated along the long attitudinal axis, the plane-intersecting angle of 45° further proves that rod-CeO2–MnOx mainly exposes the {100} (0.26 nm) facet and preferentially grows along the direction of the {110} facet.33 Fig. 5C and D reveal that plate-CeO2–MnOx is a rhombic plate with a diameter of 18 nm and thickness of ∼4 nm, exposing two facets, namely, {111} (0.31 nm) and {200} (0.27 nm). From Fig. 5E, polyhedra-CeO2–MnOx is an irregular hexagonal nanoparticle, which comprises truncated octahedra with an average size of about 20 ± 1.5 nm. From Fig. 5F, the polyhedra-CeO2–MnOx shows {200}, {111}, and {220} facets corresponding to the interplanar spacings of 0.26, 0.33, and 0.19 nm, respectively, indicating that it exposes the {111} and {100} facets.34 From Fig. 5G and H, it can be seen that cube-CeO2–MnOx is a more uniform cube block with a size of 20–25 nm and has a bigger particle size than the others. Further, it is only enclosed by the {100} facet. Generally, the exposed crystal face plays an important role in the catalytic performance of the catalysts. The {111} facet is much more stable than the {110} and {100} facets with a higher surface energy; the former is inactive as compared to the latter facets. Therefore, rod-CeO2–MnOx that mainly exposed the {100} facet exhibits higher catalytic activity for CB degradation. Although cube-CeO2–MnOx is enclosed by the {100} facets, it has a bigger particle size and lower concentration of oxygen vacancies, resulting in a dramatic decrease in the catalytic activity for CB oxidation in the low-temperature range. Moreover, the chemical composition is also identified by high-resolution EDS. As shown in Fig. 5A, manganese and cerium species are detected in rod-CeO2–MnO2, implying the existence of Mn species on the surface of CeO2.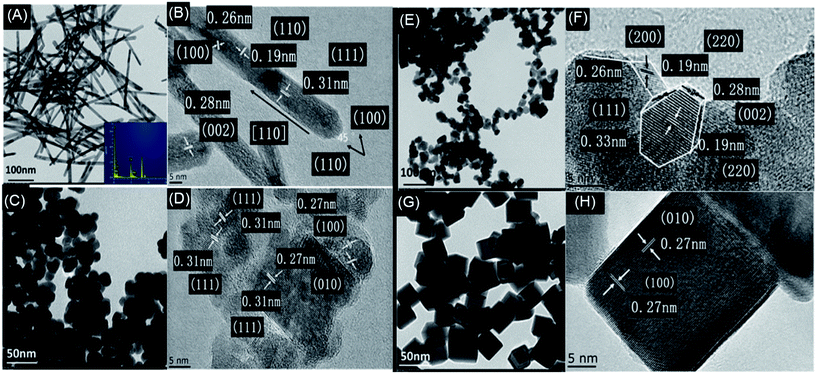 | ||
| Fig. 5 TEM and HRTEM images of CeO2–MnOx catalysts with rod (A and B), plate (C and D), polyhedral (E and F) and cube (G and H) morphologies. | ||
3.4 Redox properties of catalysts
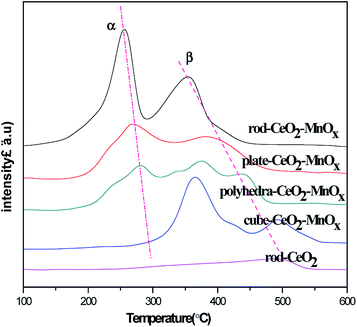
The redox properties of CeO2–MnOx mixed oxides with different morphologies were tested by H2-TPR, and the related profiles are shown in Fig. 6. As shown in Fig. 6, for pure rod-CeO2, the reduction peak below 600 °C is rather weak, which corresponds to the reduction of two kinds of oxygen species that are present on the surface and subsurface. It implies that CeO2 represents poor oxidation performance at lower temperatures. For CeO2–MnOx mixed oxides, except for polyhedra-CeO2–MnOx, two obvious reduction peaks (α and β) are observed, which belong to the reduction of MnOx species and oxygen species on the surface/subsurface of CeO2. Generally, at lower temperatures, peak α corresponds to the reduction of MnOx species that are highly dispersed and interact with ceria. As for peak β, it may be attributed to the combined reduction of Mn2O3 to MnO or MnOx species with larger particles and surface/subsurface oxygen species of ceria.35–37 Further, for polyhedra-CeO2–MnOx, the profile of H2-TPR shows multiple peaks, which may be related to more exposed planes and heterogeneous polyhedral particles.38 Among them, rod-CeO2–MnOx catalyst has the best reducibility, while cube-CeO2–MnOx catalyst has the worst. The reducibility of mixed oxides decreases in the following order: rod-CeO2–MnOx > plate-CeO2–MnOx > polyhedra-CeO2–MnOx > cube-CeO2–MnOx. However, as reported in the literature,39 the temperatures for the reduction of pure MnOx are much higher than those for MnOx species in CeO2–MnOx mixed oxides. This implies that there is a strong interaction between CeO2 and MnOx, which promotes the mobility of active oxygen species and further enhances the catalytic activity for CB oxidation.3.5 OSC properties of catalysts
The OSC value has a substantial impact on the catalytic performance for deep oxidation. Thus, the OSC measurement of CeO2–MnOx mixed oxides with different morphologies was carried out at 400 °C, and the data is listed in Table 3. The OSC value of rod-CeO2–MnOx (574 μmol O2 g−1) is the highest and much larger than that of cube-CeO2–MnOx (106 μmol O2 g−1). The OSC value decreases in the following order: rod-CeO2–MnOx > plate-CeO2–MnOx > polyhedra-CeO2–MnOx > cube-CeO2–MnOx, which is consistent with the results of the catalytic activity test. According to the literature,40 the OSC values of CeO2-based mixed oxides are intrinsic to their structures. A more homogeneous structure would create more oxygen that would result in an increase in the OSC value. Moreover, it is worth noting that the variation of the OSC value is consistent with those of their BET surface area (SBET) and OSC/SBET values, suggesting that the OSC value of the catalysts is also limited to its surface and particle size. As the BET surface area dramatically decreases, the available oxygen species on the surface also decline, which leads to a decrease in the OSC value. In addition, for rod-CeO2–MnOx and plate-CeO2–MnOx, their OSC/SBET values are also higher than the theoretical ones (calculated OSCs). This result indicates that the mobility of active oxygen species in rod-CeO2–MnOx and plate-CeO2–MnOx is better, which increases the migration rate of bulk oxygen toward the surface, thereby improving the catalytic activity for CB oxidation.| Samples | Exposed facets | OSC (μmol O2 g−1) | SBET (m2 g−1) | OSC/SBET (μmol O2 m−2) | Calculated OSC (μmol O2 m−2)a |
|---|---|---|---|---|---|
| a Calculated according to the theoretical OSC of the {100}, {110}, and {111} facets for CeO2.41b Assumption: balanced distribution of oxygen species on different facets.42 | |||||
| Rod-CeO2–MnOx | {100} + {110} | 574 | 75.6 | 7.5 | 4.9b |
| Plate-CeO2–MnOx | {200} + {111} | 479 | 70.8 | 6.8 | 6.6 |
| Polyhedra-CeO2–MnOx | {100} + {111} | 256 | 48.1 | 5.3 | 6.6b |
| Cube-CeO2–MnOx | {100} | 106 | 33.7 | 3.1 | 5.7 |
4. Conclusion
Four CeO2–MnOx mixed oxides with different morphologies were prepared by simple hydrothermal methods and characterized using XRD, XPS, HRTEM, N2 adsorption–desorption, and H2-TPR techniques. Rod-CeO2–MnOx mainly exposes the {100} facet and preferentially grows along the {110} facet direction. Plate-CeO2–MnOx is dominated by the {111} facet and polyhedra-CeO2–MnOx exposes the {111} and {100} facets, while cube-CeO2–MnOx with a bigger particle size is only enclosed by the {100} facet. The XRD Rietveld refinement results show that CeO2 and MnOx in the CeO2–MnOx mixed oxides are highly dispersed with respect to each other. Two new phases of both todorokite and vernadite with a special tunnel-like structure are found. The todorokite phase (S.G.: P2/m:b) exists in all the MnOx–CeO2 mixed oxides, while the vernadite phase (S.G.: I4/m) only exists in rod-MnOx–CeO2. Moreover, the lattice microstrain generated from the lattice distortion and defects decreases in the following order: rod-CeO2–MnOx > plate-CeO2–MnOx > polyhedra-CeO2–MnOx > cube-CeO2–MnOx, which is consistent with their OSC values. The results of UV-Raman and XPS spectra reveal that rod-CeO2–MnOx and plate-CeO2–MnOx have higher concentrations of Ce3+ and Mn2+ as compared to the other catalysts, particularly when compared to cube-CeO2–MnOx, which is favorable for the promotion of lattice oxygen mobility and further enhancing the catalytic activity for Cl-VOCs oxidation. Moreover, Mn enrichment and more Mn4+ species on the CeO2–MnOx surface are also beneficial toward improved catalytic activity. The H2-TPR and OSC results show that the catalytic performance of the catalysts can be enhanced because CeO2 and MnOx strongly interact with each other, while their OSC properties are not only intrinsic to their structures but also limited to their surfaces and by their particle sizes.Conflicts of interest
There are no conflicts to declare.Acknowledgements
The financial supports from the National Key Research and Development Program of China (2016YFC0204300) and the Natural Science Foundation of China (No. 21477109) are gratefully acknowledged.References
- E. C. Moretti, Practical Solutions for Reducing Volatile Organic Compounds and Hazardous Air Pollutants, 2001 Search PubMed.
- S. Maghsoodi, J. Towfighi, A. Khodadadi and Y. Mortazavi, Chem. Eng. J., 2013, 215–216, 827–837 CrossRef.
- Q. G. Dai, X. Y. Wang and G. Z. Lu, Appl. Catal., B, 2008, 81, 192–202 CrossRef.
- X. Y. Wang, L. Ran, Y. Dai, Y. J. Lu and Q. G. Dai, J. Colloid Interface Sci., 2014, 426, 324–332 CrossRef PubMed.
- X. Y. Wang, Q. Kang and D. Li, Appl. Catal., B, 2009, 86, 166–175 CrossRef.
- X. D. Ma, X. Feng, X. He, H. W. Guo, L. Lv, J. Guo, H. Q. Cao and T. Zhou, Microporous Mater., 2012, 158, 214–218 CrossRef.
- B. de Rivas, R. López-Fonseca, M. Á. Gutiérrez-Ortiz and J. I. Gutiérrez-Ortiz, Appl. Catal., B, 2011, 101, 317–325 CrossRef.
- P. Yang, Z. N. Shi, S. S. Yang and R. X. Zhou, Chem. Eng. Sci., 2015, 126, 361–369 CrossRef.
- Z. N. Shi, P. Yang, F. Tao and R. X. Zhou, Chem. Eng. J., 2016, 295, 99–108 CrossRef.
- X. W. Xie, Y. Li, Z. Q. Liu, H. Masatake and W. J. Shen, Nature, 2009, 458, 746–748 CrossRef PubMed.
- H. X. Mai, L. D. Sun, Y. W. Zhang, R. Si, W. Feng, H. P. Zhang, H. C. Liu and C. H. Yan, J. Phys. Chem. B, 2005, 109, 24380–24385 CrossRef PubMed.
- Q. Dai, H. Huang, Y. Zhu, W. Deng, S. Bai, X. Wang and G. Lu, Appl. Catal., B, 2012, 117–118, 360–368 CrossRef.
- W. T. Chen, K. B. Chen, M. F. Wang, S. F. Weng, C. S. Lee and M. C. Li, Chem. Commun., 2010, 46, 3286–3288 RSC.
- G. Qi, R. T. Yang and R. Chang, Appl. Catal., B, 2004, 51, 93–106 CrossRef.
- P. Zhang, H. Lu, Y. Zhou, L. Zhang, Z. Wu, S. Yang, H. Shi, Q. Zhu, Y. Chen and S. Dai, Nat. Commun., 2015, 6, 8446 CrossRef PubMed.
- F. Arena, B. Gumina, A. F. Lombardo, C. Espro, A. Patti, L. Spadaro and L. Spiccia, Appl. Catal., B, 2015, 162, 260–267 CrossRef.
- Z. Wang, G. Shen, J. Li, H. Liu, Q. Wang and Y. Chen, Appl. Catal., B, 2013, 138, 253–259 CrossRef.
- H. Mai, L. Sun, Y. Zhang, R. Si, W. Feng, H. Zhang, H. Liu and C. Yan, J. Phys. Chem. B, 2005, 109, 24380–24385 CrossRef PubMed.
- C. Pan, D. Zhang and L. Shi, J. Solid State Chem., 2008, 181, 298–1306 CrossRef.
- F. Lu, F. Meng, L. Wang, J. Luo and Y. Sang, Mater. Lett., 2012, 73, 154–156 CrossRef.
- M. Kułażyński, J. G. van Ommen, J. Trawczyński and J. Walendziewski, Appl. Catal., B, 2002, 36, 239–247 CrossRef.
- H. Windawi and Z. C. Zhang, Catal. Today, 1996, 30, 99–105 CrossRef.
- C. E. Hetrick, F. Patcas and M. D. Amiridis, Appl. Catal., B, 2011, 101, 622–628 CrossRef.
- T. Fei, S. S. Yang, P. Yang, Z. N. Shi and R. X. Zhou, J. Rare Earths, 2016, 34, 381–389 CrossRef.
- Z. Chen, F. Wang, H. Li, Q. Yang, L. Wang and X. Li, Ind. Eng. Chem. Res., 2012, 51, 202–212 CrossRef.
- G. Park, L. Bartolome, K. G. Lee, S. J. Lee, D. H. Kim and T. J. Park, Nanoscale, 2012, 4, 3879–3885 RSC.
- L. Li, F. Chen, J.-Q. Lu and M.-F. Luo, J. Phys. Chem. A, 2011, 15, 7972–7977 CrossRef PubMed.
- T. Taniguchi, T. Watanabe, N. Sugiyama, A. K. Subramani, H. Wagata, N. Matsushita and M. Yoshimura, J. Phys. Chem., 2009, 113, 19789–19793 Search PubMed.
- P. Sudarsanam, K. Kuntaiah and B. M. Reddy, New J. Chem., 2014, 38, 5991–6001 RSC.
- P. Sudarsanam, B. Hillary, M. H. Amin, S. B. A.Hamid and S. K. Bhargava, Appl. Catal., B, 2016, 185, 213–224 CrossRef.
- H. C. Yao and Y. F. Yu Yao, J. Catal., 1984, 86, 254–265 CrossRef.
- H. Y. Chen, A. Sayari, A. Adnot and F. Larach, Appl. Catal., B, 2001, 32, 195–204 CrossRef.
- Z. Zhang, C. Hu, Y. Xiong, R. Yang and Z. L. Wang, Nanotechnology, 2007, 18, 465–504 Search PubMed.
- Z. L. Wang and X. Feng, J. Phys. Chem. B, 2003, 107, 13563–13566 CrossRef.
- D. Terribile, A. Trovarelli, C. De Leitenburg, A. Primavera and G. Dolcetti, Catal. Today, 1999, 47, 133–140 CrossRef.
- X. Tang, Y. Li, X. Huang, Y. Xu, H. Zhu, J. Wang and W. Shen, Appl. Catal., B, 2006, 62, 265–273 CrossRef.
- D. Delimaris and T. Ioannides, Appl. Catal., B, 2008, 84, 303–312 CrossRef.
- H. J. Li, G. S. Qi, T. Na, X. J. Zhang, W. Li and W. J. Shen, Catal. Sci. Technol., 2011, 1, 1677–1682 RSC.
- J. L. Ayastuy, E. Fernández-Puertas, M. P. González-Marcos and M. A. Gutiérrez-Ortiz, Int. J. Hydrogen Energy, 2012, 37, 7385–7397 CrossRef.
- H. Vidal, J. Kaspar, M. Pijolat, G. Colon, S. Bernal, A. Cordón, V. Perrichon and F. Fally, Appl. Catal., B, 2001, 30, 75–85 CrossRef.
- E. López-Navarrete, A. Caballero, A. R. González-Elipe and M. Ocaña, J. Eur. Ceram. Soc., 2004, 24, 3057–3062 CrossRef.
- J. R. McBride, K. C. Hass, B. D. Poindexter and W. H. Weber, J. Appl. Phys., 1994, 76, 2435–2441 CrossRef.
Footnote |
| † These authors contributed equally to this work. |
| This journal is © The Royal Society of Chemistry 2018 |

