DOI:
10.1039/C8RA03924K
(Paper)
RSC Adv., 2018,
8, 21577-21584
One-pot preparation of MnOx impregnated cotton fibers for methylene blue dye removal
Received
8th May 2018
, Accepted 28th May 2018
First published on 13th June 2018
Abstract
Using natural cotton fibers (CF) as a matrix, a series of novel MnOx impregnated cotton fibers (designated as Mn-X@BCF) were prepared in this study through a one-pot sono-assisted KMnO4 reduction process with no additional reducers. The as-prepared Mn-X@BCF was covered by a uniform and dense layer of MnOx nanospheres (10–30 nm), the amount of which was significantly improved by CF pretreatment and linearly correlated with KMnO4 concentration. Specifically, when KMnO4 concentrations increased from 5 mmol L−1 to 100 mmol L−1, the impregnation ratios of MnOx on BCF increased from 0.34% to 14.98% accordingly. Mn-X@BCF showed substantial removal for the typical dye MB. Under the studied conditions, MB removal equilibrium was reached within 10 minutes and solution pH showed no significant influence over a wide pH range (2–11). MB adsorption by Mn-25@BCF obeyed the pseudo-second-order kinetic model and Langmuir model well. The calculated maximum adsorption capacity (Qm) of Mn-25@BCF was 46.3 mg g−1, close to the cumulative adsorption capacity (Qc 45 mg g−1) of MB determined during the eight cycles of adsorption. It was proposed that adsorption followed by partial oxidation was the main mechanism of MB removal by Mn-X@BCF. The as-prepared Mn-25@BCF has great potential as an efficient and low-cost material for dye wastewater treatment because of its inexpensive and renewable source of raw materials, fast MB removal kinetics, wide working pH range and easy solid–liquid separation.
1. Introduction
Manganese oxides (MnOx) have wide applications in environmental remediation because of their excellent adsorption, oxidation and catalytic degradation properties. It was reported that MnOx could be used solely as the adsorbent or oxidant or coupled with other oxidants like hydrogen peroxide (H2O2), potassium peroxymonosulfate (PMS), and ozone (O3) in the catalytic oxidation system for removal of organometallic complexes and organic pollutants (e.g. substituted phenols, dyes, aromatic amines, pesticides) (Table 1).1–3 For example, Cao et al.1 prepared α/β-MnO2 nanorods by a hydrothermal method and found that their removal of rhodamine B (RB) and methylene blue (MB) was extremely high in the presence of H2O2 (i.e. 95%) as compared with that in the absence of H2O2 (i.e. 10%). This indicated that α/β-MnO2 functioned mainly as the catalyst for degradation of dyes using H2O2 as the oxidant. However, the widespread application of MnOx in the form of powders or nanoparticles is limited due to their easy self-aggregation, difficult solid/liquid separation, serious dust contamination, etc. Therefore, direct synthesis of nanomaterials on solid matrixes is attracting increasing interest in terms of engineering applications and synthetic challenges.
Table 1 Preparation of MnOx and MnOx-based composites for pollutant removal
| Material |
Synthetic method |
Pollutant |
Ref. |
| MB-methylene blue. RB-rhodamine B. IC-indigo carmine. CR-Congo red (CR). |
| MnO2 nanorods |
Hydrothermal |
Dyes MBa, RBb |
1 |
| MnO2 nanocorals |
KMnO4–MnSO4 reaction |
Dye MB |
2 |
| MnOx |
Calcination |
Phenol |
3 |
| δ-MnO2@clay |
KMnO4–MnSO4 reaction |
Dye MB |
4 |
| MnO2@cellulose fiber |
KMnO4 reduction at RT (by ethanol) |
Pb2+ |
5 |
| MnO2@cellulose fiber |
KMnO4 reduction at RT (by oleic acid) |
HCHO |
6 |
| MnO2@fique fiber |
KMnO4 reduction under sonication |
Dye ICc |
7 |
| MnO2@cellulose nanofiber |
KMnO4 reduction under sonication |
Dye MB |
8 |
| MnO2@cotton fiber |
KMnO4–MnSO4 reaction |
Cu2+, Pb2+, CRd, MB |
9 |
| MnO2@PET fiber |
KMnO4 reduction at 90 °C (by oxalate) |
HCHO |
10 |
| MnO2/PDA/PAN fiber |
KMnO4 reduction at 80 °C |
Pb2+ |
11 |
| MnO2@MWCNTs |
Co-precipitation |
HCHO |
12 |
| MnO2@chitin |
KMnO4 reduction at RT |
Dye MB |
13 |
| MnO2@Al2O3 |
MnAc2 impregnation and calcination |
NO |
14 |
Several matrixes have been studied for immobilization of MnOx powders including clays, chitin, MWCNTs, Al2O3, natural and synthetic fibers, etc. (Table 1).4–14 Among them, fibers seem to be one of the most promising matrixes in the practical use due to their various application forms (e.g. filaments, nonwoven fabrics, threads, and cloths), small mass transfer distance, fast reaction kinetic and extremely low pressure drop as compared with traditional materials.15 For example, using a natural fique fiber as the matrix, Chacón-Patiño et al.7 prepared a novel MnO2@fique fiber by the sono-assisted KMnO4 reduction method. The bionanocomposite was able to remove up to 98%, in less than 5 minutes, of the colour present in indigo carmine (IC) contaminated water samples and it can be reused with no substantial drop in dye degradation efficiency. Using a commercial cotton fiber as the matrix, Jiao et al.9 prepared a novel cotton fiber-MnO2 hierarchical composite (C-MHCs) by a two-step strategy “ion exchange-KMnO4–MnSO4 redox reaction” method. The composite showed efficient removal for various pollutants like Cu2+, Pb2+, MB and Congo red (CR), probably through the adsorption mechanism. Using an electrospun polyacrylonitrile (PAN) fiber as the matrix, Li et al.11 prepared a novel MnO2/PDA/PAN fiber by the KMnO4 reduction method at 80 °C. Results showed that PDA coating on PAN fibers was necessary for loading uniform MnO2, and MnO2 and PDA both contributed to the extremely high Pb2+ adsorption capacity (i.e. 185 mg g−1).
Our interest in natural fibers arises from the fact that they offer a sustainable, resourceful and environment friendly venue to create novel functional materials. Cotton, the most widely used natural fiber in the world, is low-cost and clean to produce, and has wide applications in textile cloth, daily care, and medicine.16,17 The main component of cotton fiber is cellulose, made up of repeating units of α-glucose. Previous studies showed that various reagents like organic acids (e.g. oleic acid, oxalate), alcohols (e.g. ethanol), polysaccharides (e.g. glucose, chitin) and low-valence Mn (e.g. MnSO4) could be used as the reducing agents for KMnO4 for preparation of MnOx and its composites.4–11,13 Therefore, it's reasonable to propose that cotton fiber, composed primarily of α-glucose, can be used to reduce KMnO4 itself, without any additional reducing agents. Besides, the abundant OH groups in cotton structure are apt to interact and stabilize MnOx nanostructures, which is beneficial for MnOx uniform deposition.
Methylene Blue (MB), as a cationic phenothiazine dye, has a wide application in industries like textile, paper, rubber, plastics, cosmetics and food, etc.13 Besides, it can also be used as chemical indicators, biological stains and drugs. However, due to its potential hazards to humans and high resistance to biodegradation, MB has become one of the most attracting environmental pollutants that should be removed by various methods, among which adsorption and catalytic degradation are deemed as the most efficient methods.1,2,4,8,9,13,18–22 As summarized in Table 2, all of the studied materials, either MnOx-based materials or other materials showed significant removal for MB. However, there is still a controversy about whether or not oxidants, microwave, UV-Vis radiation or other additives should be applied as assistants for the MnOx-based materials. Moreover, it is still imperative to develop more efficient and cost-effective materials that are more appropriate to practical applications.
Table 2 Removal of MB by previously reported materials
| Material |
MB removal property |
Ref. |
| MnO2 nanocorals |
98.6% in 20 min (C0 5 mg L−1) Qm 41 mg g−1 |
2 |
| δ-MnO2@clay |
92% in 100 min (C0 80 mg L−1) |
4 |
| MnO2@cellulose nanofiber |
99.8% in 2 min (C0 80 mg L−1) |
8 |
| MnO2@cotton fiber |
Qm 247 mg g−1 |
9 |
| MnO2@chitin |
99.9% in 2.5 min (C0 20 mg L−1) |
13 |
| MnOx |
Qm 230 mg g−1 (microwave) or 27 mg g−1 (MnOx alone) |
18 |
| Co–Mn–Fe complex oxide |
92% in 60 min (C0 50 mg L−1) |
19 |
| Fe3O4 nanoparticles |
99.9% in 2 min (C0 10 mg L−1) |
20 |
| ZnO/Ag/CdO |
98.3% in 90 min |
21 |
| Guar gum-cerium(IV) tungstate |
96% in 120 min (C0 0.32 mg L−1) |
22 |
In this study, we used medical absorbent cotton fiber as the matrix and developed a one-pot sono-assisted KMnO4 reduction approach to deposit MnOx uniformly onto cotton fiber. The as-synthesized composites were characterized by Fourier transform infrared spectroscopy (FTIR), X-ray photoelectron spectroscopy (XPS), and scanning electron microscope (SEM). Their removal performance and the related mechanism for the typical MB dye were studied by both static adsorption tests and instrumental analyses. These composites can not only avoid the disadvantages of MnOx powders encountered in water treatment but also improve the MnOx performance, providing promising potentials in a variety of practical applications.
2. Experimental
2.1 Materials
Commercial medical absorbent cotton fibers (CF, filament length 3–7 cm, tensile strength 0.02–0.06 N) were used as the matrix for preparation of the MnOx composites. Spectroscopic grade KBr (purity above 99.0%) was purchased from Sinopharm Chemical Reagent Co. Ltd. (China) for FTIR analyses. All other chemicals like methylene blue (MB, purity above 96.0%), HCl, NaOH, KMnO4 were of analytical grade and used as received.
2.2 Preparation of Mn-X@BCF
Prior to use, the fibers were washed thoroughly by deionized (DI) water, then pre-treated sequentially by 5% HCl-DI water–6% NaOH-DI water, and finally oven-dried at 60 °C until constant weight (the product was designated as BCF). Then, certain amount of raw CF or pre-treated BCF were submerged into a series of KMnO4 solutions (5–100 mmol L−1), and the mixtures were irradiated under sonication (28 kHz, 140 W) for 1 hour. MnOx nanoparticles were deposited in situ on the surface of CF or BCF. After standing overnight, the final products were separated, washed with DI water for 3 times to remove any possible residuals, dried at 60 °C until constant weight and then stored in a desiccator prior to use. The products were labelled as Mn-X@CF and Mn-X@BCF (X equals to 5–100, indicating KMnO4 concentrations). Amounts of MnOx on the composites were determined by the mass gain (G, %) calculated using the following equation| |
 | (1) |
where M0 and Mf (g) are mass of fibers before and after MnOx deposition, respectively.
2.3 Characterization of Mn-X@BCF
Deposition of MnOx on BCF surfaces were investigated by SEM, FTIR and XPS. Surface morphologies of the samples were observed by SEM (S-4800, Hitachi, Japan) with 1000-, 5000-, 20![[thin space (1/6-em)]](https://www.rsc.org/images/entities/char_2009.gif) 000- and 100000-fold magnification. FTIR spectra were collected in 400–4000 cm−1 using a Thermo Nicolet IR 200 instrument (Thermo Electron Corp., USA). Chemical compositions of the sample surface were analysed by XPS on an Axis Ultra spectrometer (Kratos Analytical, UK). XPS peak 4.1 software was used to peak-fit the high resolution spectra of C1s, Mn2p, S2p and N1s after being calibrated to the binding energy of C1s at 284.6 eV.23
000- and 100000-fold magnification. FTIR spectra were collected in 400–4000 cm−1 using a Thermo Nicolet IR 200 instrument (Thermo Electron Corp., USA). Chemical compositions of the sample surface were analysed by XPS on an Axis Ultra spectrometer (Kratos Analytical, UK). XPS peak 4.1 software was used to peak-fit the high resolution spectra of C1s, Mn2p, S2p and N1s after being calibrated to the binding energy of C1s at 284.6 eV.23
2.4 Batch adsorption tests
Batch tests were conducted to assess MB removal properties by the as-synthesized Mn-X@BCF samples. In a typical test, 0.1 g of fiber was mixed with 50 mL of MB solution (pH0 2–11, C0 20 mg L−1) on a shaking table (THZ-98C, Shanghai, China) at 25 °C and 150 rpm. After reaching equilibrium, the fibers were taken out and analysed by FTIR, SEM and XPS, while the filtrate was analysed for MB concentration by spectrophotometer (UV1800, Shimadzu, Japan) at 664 nm according to previously reported procedure.24 Every sample was analysed in duplicate to guarantee accuracy of the data. MB removal rate (R, %) and adsorption capacity (Qe, mg g−1) were obtained using the equations| |
 | (2) |
| |
 | (3) |
where C0 and Ce (mg L−1) are initial and equilibrium concentrations of MB, V (L) is volume of MB solution, and M (g) is dry mass of adsorbents.
3. Results and discussion
3.1 Preparation of Mn-X@BCF
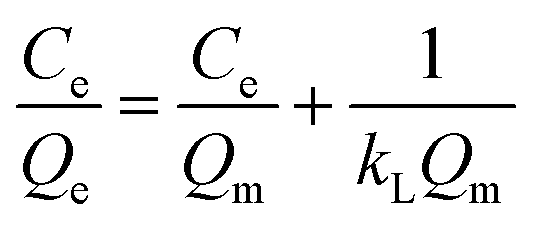
Deposition of MnOx was evaluated as a function of matrix properties and KMnO4 concentrations. Preliminary tests showed pre-treatment of CF affected MnOx deposition substantially. For the raw CF, MnOx was hardly deposited as indicated from the nearly zero mass gain and the resulting very pale brown colour. However, for the pre-treated BCF, significant amounts of MnOx were deposited as a function of KMnO4 concentrations. As shown in Fig. 1, when KMnO4 concentration was 5 mmol L−1, the mass gain of BCF was 0.34%. Increasing KMnO4 concentrations up to 10–100 mmol L−1 resulted in a steady increase of mass gain of BCF to 1.13–14.98%. Under the studied conditions, the mass gain of BCF could be fitted linearly with KMnO4 concentrations, and the fitting correlation coefficient R2 was 0.995. Depending on MnOx amount, colour of Mn-X@BCF turned brown or dark brown. As compared with the study of Jiao et al.,9 a more convenient one-pot method was used in this study to deposit MnOx directly on cotton fiber.
 |
| | Fig. 1 Effect of KMnO4 concentration on BCF mass gain (G, %) and MB removal (R, %). | |
3.2 Characterization of Mn-X@BCF
SEM photographs. Morphologies of the samples were analysed by SEM with 1000-, 5000-, 20000- and 100000-fold magnification. As shown in Fig. 2, it was obvious that BCF used in this study was flat rather than round, with a diameter of 10–20 μm and numerous lines parallel to the length of the fiber. After MnOx deposition, a dense and uniform layer of particles were formed on the BCF surface. By close observation, these particles were nanospheres mostly in the diameter of 10–30 nm. Further analyses by Nano Measurer software of randomly selected 100 particles showed that the average particle size of MnOx nanospheres on Mn-25@BCF, Mn-100@BCF and Mn-25@BCF with MB were 19.5 ± 5.3 nm, 16.7 ± 4.6 nm, 20.0 ± 6.8 nm, respectively (Fig. 2), much smaller than the previously reported MnO2 granules (i.e. 200–350 nm).9 It was obvious that even at an extremely high KMnO4 concentration, the fibers retained their morphology and shape well during the modification reactions. Besides, particle size of MnOx nanoparticles, distributed uniformly on BCF surface, did not show a substantial increase as compared with that prepared at low KMnO4 concentration. This indicated that nanoparticle aggregation, reported in previous literature,7 did not occur in this study, probably because of the dual function of sonication and cotton fiber stabilization. Furthermore, MB adsorption showed no significant influence on morphology and particle size of the nanostructured MnOx.
 |
| | Fig. 2 Upper: SEM photographs of (a) BCF, (b) Mn-25@BCF, (c) Mn-100@BCF and (d) Mn-25@BCF with MB with the magnification of (-1) ×1000, (-2) ×5000, (-3) ×20000 and (-4) ×100000. Bottom: particle size distribution of MnOx nanospheres on (b) Mn-25@BCF, (c) Mn-100@BCF and (d) Mn-25@BCF with MB as calculated from the Nano Measurer software. | |
FTIR spectra. Fig. 3 showed FTIR spectra of the (a) BCF, (b) Mn-25@BCF, (c) Mn-25@BCF with MB, and (d) MB. Characteristic peaks of BCF coincided well with that reported in ref. 5, 6 and 25, testifying that the main component of cotton fiber was cellulose. Typical peaks included 3400 cm−1 (O–H stretching vibration in hydroxyl group), 2892 cm−1 (C–H stretching vibration in methylene group), 1639 cm−1 (O–H stretching vibration in adsorbed water), 1423 cm−1 (C–H scissoring vibration in methylene group), 1373 cm−1 (C–H deformation vibration), 1064 cm−1 (C–OH stretching vibration), and 898 cm−1 (C–O–C stretching vibration in glucoside bond). After MnOx deposition, there were some minor changes in IR spectra of Mn-25@BCF, which included appearance of weak peaks at 615 and 516 cm−1 corresponding to MnOx,9 blue shift of O–H stretching vibration in adsorbed water from 1639 to 1616 cm−1, and slight attenuation of C–O–C stretching vibration in glucoside bond at 898 cm−1. These changes indicated that MnOx deposition has a slight effect on the chemical structure of BCF, probably due to the redox reaction between KMnO4 and cotton fibers. A similar oxidization phenomenon was also reported by Mopoung and Bunterm26 in modification of the pineapple leaf fiber waste by KMnO4. After contact with MB, characteristic peaks of MB at 1592 and 884 cm−1 appeared on Mn-25@BCF, demonstrating that MB transferred from solution to Mn-25@BCF structures.24
 |
| | Fig. 3 FTIR spectra of (a) BCF, (b) Mn-25@BCF, (c) Mn-25@BCF with MB, and (d) MB. | |
XPS spectra. Surface chemical compositions of the samples were analyzed from XPS spectra. As shown in Table 3, BCF was composed primarily of C (60.83 atom%) and O (38.73 atom%), of which C originated from the skeleton structure of cellulose, while O originated from the abundant hydroxyl and other oxygen-containing groups in cellulose. After MnOx deposition, a significant amount of Mn was introduced on BCF surface and its content increased from 0.92 to 1.38 atom% with the increase of KMnO4 concentration from 25 to 100 mmol L−1. This coincided well with the mass gain result, indicating that amount of MnOx was closely related to the concentration of KMnO4. In addition, MnOx deposition introduced a certain amount of O, resulting in an increase of O/C ratio from the initial 0.64 (BCF) to 0.71 (Mn-25@BCF) and 0.78 (Mn-100@BCF), respectively. After contact with MB, contents of C and N increased significantly and S appeared in accordance with the slight decrease of Mn content.
Table 3 Elemental composition of the fibrous samples
| Samples |
Atomic concentration, % |
|
| C |
O |
N |
S |
Mn |
O/C |
| BCF |
60.83 |
38.73 |
0.44 |
— |
— |
0.64 |
| Mn-25@BCF |
57.72 |
40.99 |
0.37 |
— |
0.92 |
0.71 |
| Mn-100@BCF |
55.41 |
42.95 |
0.27 |
— |
1.38 |
0.78 |
| Mn-25@BCF, with MB |
62.24 |
36.04 |
0.83 |
0.27 |
0.62 |
0.58 |
Detailed surface information of the samples was further deduced by the high-resolution scan of C1s, Mn2p, S2p and N1s (Fig. 4). From the C1s scan, it can be seen that C1s spectra of BCF could be grouped into three peaks with binding energy (BE) being centred at 284.6, 286.2 and 287.6 eV, corresponding to skeleton carbon (C–C/C–H, C1), single oxygen bonded carbon (C–O, C2), and glucoside bonded carbon or single oxygen double-bonded carbon (O–C–O/C![[double bond, length as m-dash]](https://www.rsc.org/images/entities/char_e001.gif) O, C3), respectively.23 After MnOx loading, especially at a high KMnO4 concentration (e.g. 100 mmol L−1), a small amount of carboxyl carbon (OC–O, C4, 292.6 eV) appeared and the ratio of C3 increased obviously. This was probably due to the redox reaction between KMnO4 and BCF. In accordance with the reduction of KMnO4 to MnOx, some amounts of carbon in low oxidation states (e.g. C1, C2) were oxidized to their high oxidation states (e.g. C3, C4). This indicated that BCF used in this study functioned not only as the stabilizer for MnOx, but also as the reducer for MnOx formation. Peak fitting of the Mn2p scan illustrated that Mn2p could be fitted with one doublet-peak (ΔBE = 11.6 eV) with Mn2p3/2 being situated at 641.7 eV, which could be ascribed to Mn2O3 in agreement with the earlier reports.5,14 It should be noted that KMnO4 concentration and MB adsorption showed no significant influence on MnOx existing forms. After contact with MB, characteristic peaks of S2p (164.5 eV) and N1s (398.5 eV) appeared on XPS spectra of Mn-25@BCF.24,27,28 The symmetric shape of N1s peak demonstrated that there was only one state of nitrogen because a positive charge in MB+ was evenly distributed in the molecule due to the p-conjugated effect.27,28 While the S2p3/2 BE was similar to that of MB as reported previously, which was very close to S2p3/2 of thiophene (164.3 eV).28 These results illustrated that the chemical environment of N and S heterocycle was relatively stable and MB was removed by Mn-25@BCF mainly through the adsorption mechanism.
O, C3), respectively.23 After MnOx loading, especially at a high KMnO4 concentration (e.g. 100 mmol L−1), a small amount of carboxyl carbon (OC–O, C4, 292.6 eV) appeared and the ratio of C3 increased obviously. This was probably due to the redox reaction between KMnO4 and BCF. In accordance with the reduction of KMnO4 to MnOx, some amounts of carbon in low oxidation states (e.g. C1, C2) were oxidized to their high oxidation states (e.g. C3, C4). This indicated that BCF used in this study functioned not only as the stabilizer for MnOx, but also as the reducer for MnOx formation. Peak fitting of the Mn2p scan illustrated that Mn2p could be fitted with one doublet-peak (ΔBE = 11.6 eV) with Mn2p3/2 being situated at 641.7 eV, which could be ascribed to Mn2O3 in agreement with the earlier reports.5,14 It should be noted that KMnO4 concentration and MB adsorption showed no significant influence on MnOx existing forms. After contact with MB, characteristic peaks of S2p (164.5 eV) and N1s (398.5 eV) appeared on XPS spectra of Mn-25@BCF.24,27,28 The symmetric shape of N1s peak demonstrated that there was only one state of nitrogen because a positive charge in MB+ was evenly distributed in the molecule due to the p-conjugated effect.27,28 While the S2p3/2 BE was similar to that of MB as reported previously, which was very close to S2p3/2 of thiophene (164.3 eV).28 These results illustrated that the chemical environment of N and S heterocycle was relatively stable and MB was removed by Mn-25@BCF mainly through the adsorption mechanism.
 |
| | Fig. 4 High resolution XPS spectra of (A) C1s, (B) Mn2p, (C) S2p, and (D) N1s. | |
3.3 MB removal by Mn-X@BCF
Comparison of fiber samples. CF pre-treatment and KMnO4 concentration showed significant influence on MB removal by the as-synthesized fiber samples. Fig. 1 and 5 compared MB removal rate and UV-Vis spectra of MB solution after adsorption by different fiber samples. Two characteristic peaks (614 and 664 nm) were observed from the starting solution of MB which was attributed to typical MB peaks.24,29 The absorption peaks weakened or even diminished depending on the fibers applied, accordingly the solution turned light blue or colourless. Raw CF showed some adsorption affinity for MB, and the removal rate was 40% under the studied conditions. Mn-10@CF showed a similar adsorption property as compared with CF, because that MnOx was hardly deposited on the raw CF. Pre-treatment of CF could improve the MnOx deposition (G = 1.13%, Fig. 1), and thus increased the MB removal up to 84% by Mn-10@BCF. KMnO4 concentration influenced the Mn-X@BCF adsorption performances a lot. With the increment of KMnO4 concentration, Mn-X@BCF adsorption for MB increased significantly. For example, above a KMnO4 concentration of 25 mmol L−1, MB removal rate kept above 96%. By comparing UV-Vis spectra of MB before and after Mn-X@BCF adsorption, it can be seen there were no by-products that causing UV-Vis absorption in 200–800 nm produced in the MB solution.
 |
| | Fig. 5 UV-Vis absorption spectra of MB solution (C0 20 mg L−1, 25 mL) after contact with various fibers (dosage 50 mg); solution pH unadjusted (ca. 7). | |
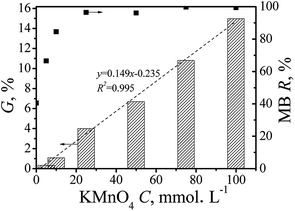
Adsorption kinetic. As shown in Fig. 6(A), the adsorption rate of Mn-X@BCF for MB was very fast, and the adsorption equilibrium can be reached within about 10 minutes, with above 96% MB adsorbed. The experimentally collected kinetic adsorption data were fitted into the pseudo-second-order kinetic model as
 |
| | Fig. 6 MB adsorption by Mn-25@BCF; (A) adsorption kinetic and (B) the fitting plot by pseudo-second-order kinetic model; MB C0 20 mg L−1, Mn-25@BCF dosage 50 mg/25 mL MB solution, solution pH unadjusted (ca. 7). | |
Pseudo-second-order kinetic model:
| |
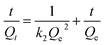 | (4) |
where
k2 (g (mg min)
−1) is the pseudo-second-order adsorption rate coefficient,
Qt and
Qe (mg g
−1) are the adsorption capacity at equilibrium and at any time
t (min), respectively.
Fig. 6(B) showed that the experimental data could be well fitted by the pseudo-second-order rate equation, with a straight line and an excellent regression coefficient (
R2) higher than 0.99. The calculated amount of MB adsorbed by the Mn-25@BCF (
i.e. 9.91 mg g
−1) correlated closely with the experimental value (
i.e. 9.79 mg g
−1). The results suggested that MB was removed by Mn-25@BCF primarily through a chemical reaction mechanism.
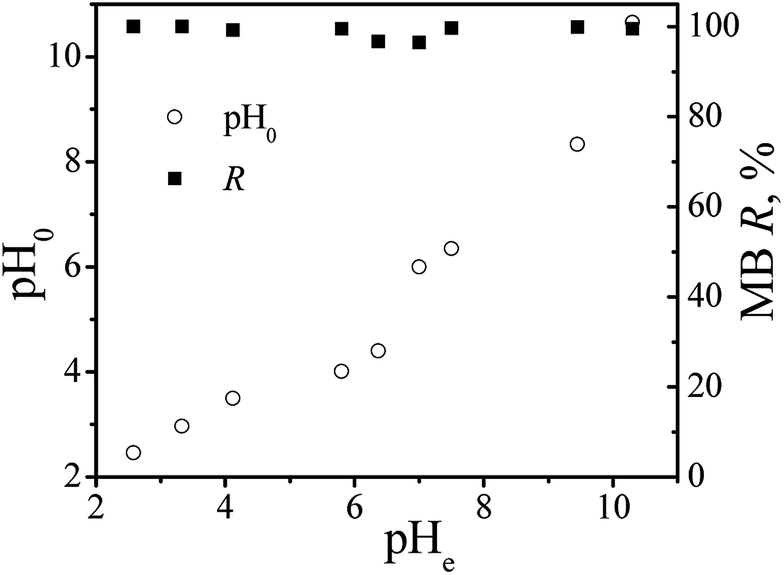
Impact of pH. Solution pH showed ignorable impact on the removal performance of MB by Mn-25@BCF (Fig. 7). Within the studied pH range of 2–11, removal rate of MB kept above 96%, and the pH value (pHe) of the solution was always higher than the initial pH value of the solution (pH0). It should be noted that if MB was removed completely through adsorption, MB removal was expected to decrease with decreasing pH due to increased protonation of Mn-25@BCF surface (pHpzc ca. 2.3).4,13 The relatively stable MB removal across the wide pH range suggested that oxidation might be the other mechanism. As previously reported, a decrease in pH would cause an increase in reducing potential of Mn oxides and a consequent increase in MB oxidation.4 The dual function of adsorption and oxidation made Mn-25@BCF a highly competitive product when being applied in practical wastewater treatment.
 |
| | Fig. 7 Impact of solution pH on MB adsorption by Mn-25@BCF; MB C0 20 mg L−1, Mn-25@BCF dosage 50 mg/25 mL MB solution, solution pH 2–11 adjusted by 0.1 mol L−1 HCl and NaOH. | |
Adsorption isotherm. Fig. 8(A) shows MB adsorption isotherm onto Mn-25@BCF (Qe versus Ce plots) at unadjusted pH at 25 °C. The experimentally collected equilibrium adsorption data were fitted into Langmuir equation as
 |
| | Fig. 8 MB adsorption by Mn-25@BCF; (A) adsorption isotherm at 25 °C, and (B) the fitting plot by Langmuir model; MB C0 10–200 mg L−1, Mn-25@BCF dosage 50 mg/25 mL MB solution, solution pH unadjusted (ca. 7). | |
Langmuir:
| |
 | (5) |
where
Ce (mg L
−1) is MB equilibrium concentration,
Qe (mg g
−1) is equilibrium adsorption capacity,
Qm (mg g
−1) is the maximum adsorption capacity,
kL is the Langmuir constant. The fitting results were presented in
Fig. 8(B). It was observed from the correlation coefficient (
R2) that the experimental data could be well fitted by Langmuir model, indicating that adsorption of MB by Mn-
X@BCF was probably a monolayer mechanism. The calculated
Qm was 46.3 mg g
−1, close and comparable to the adsorption capacity obtained when other Mn oxides were used in the literatures,
e.g. 41 mg g
−1 for manganese oxide nanocorals.
2
Reusability of fiber. Fig. 9 compares the cyclic removal performance of CF and Mn-25@BCF for MB. The fiber samples were simply washed by DI water and then dried between the two cycles. As can be seen from Fig. 9, MB removal rate by the raw CF was relatively low (i.e. 40%) during the first cycle, and then dropped sharply to 5.9%, 4.6%, and 0%, indicating the adsorption sites of CF were saturated with MB very quickly. By contrast, Mn-25@BCF showed a significantly improved removal performance for MB. MB removal rate by Mn-25@BCF during the first cycle was 96%, and then decreased gradually to 79%, 68%, 62%, 54%, 42%, 29%, and 20%. Further calculation showed that the cumulative adsorption capacity (Qc) of MB was 5 mg g−1 for CF and 45 mg g−1 for Mn-25@BCF, respectively. It was interesting to find that the cumulative adsorption capacity was similar with the Qm calculated by Langmuir equation. This indicated that Mn-25@BCF couldn't be regenerated by a simple DI washing-drying process as proposed in previous studies.7 With the progress of adsorption–readsorption cycles, the adsorption sites in the fiber structure were continuously occupied either by MB or MB partial-oxidation by-products, resulting in a decrease of MB removal performance.
 |
| | Fig. 9 Decolorization of MB with the recycled CF and Mn-25@BCF; MB C0 20 mg L−1, adsorbent dosage 50 mg/25 mL MB solution, solution pH unadjusted (ca. 7). The adsorbents were merely separated, rinsed with DI water and then dried for the next cycle of adsorption. | |
MB removal mechanism by Mn-X@BCF. Dye removal mechanisms by MnOx composites are still controversial at present. As proposed by Chacón-Patiño et al.7 and Dassanayake et al.,13 IC and MB dye removal by the MnO2 hybrids was via an oxidative decolourization mechanism, without any participation of other oxidants. While, as proposed by Li et al.,11 Asfaram et al.30 and Wang et al.,31 dyes like CR and MB are removed by the MnO2 composites primarily via an adsorption mechanism, but with the assistance of additional oxidants like H2O2, the adsorbed dye could be catalytic degraded, resulting in regeneration of the MnO2 composites for its further dye adsorption. In this study, through a comprehensive study of FTIR, UV-Vis, XPS and MB removal performance, it was concluded that MB removal by Mn-X@BCF was mainly based on the adsorption properties of MnOx for MB. Partial oxidative degradation of MB might also occur, especially at low pH values, but the degradation was incomplete so that it can't regenerate Mn-X@BCF for stable consecutive removal recycles. Additional oxidants like H2O2, PMS and O3 should be investigated to fully regenerate the Mn-X@BCF in our future study.
4. Conclusions
A series of novel MnOx impregnated cotton fibers were prepared in this study through a one-pot sono-assisted KMnO4 reduction process. Both of cotton fiber pre-treatment and KMnO4 concentrations impacted the impregnation ratio of MnOx a lot, which ranged from 0.34% to 14.98%. Analyses of FTIR, SEM and XPS showed that MnOx existed primarily as Mn2O3 nanospheres (10–30 nm) and distributed uniformly on Mn-X@BCF surface with no obvious particle aggregation even at a high KMnO4 concentration (i.e. 100 mmol L−1). The optimal Mn-25@BCF showed an extremely fast removal for MB, with ignorable impact by solution pH in a wide pH range (i.e. pH 2–11). Moreover, Mn-X@BCF can be easily separated from the solution by simply taking the fiber out, making it a competitive material for dye removal in practical applications.
Conflicts of interest
There are no conflicts to declare.
Acknowledgements
Funding for this research was provided by the Major Science and Technology Special Projects of Henan Province (grant 181100310100). The anonymous reviewers are gratefully acknowledged for their valuable comments and suggestions that help to substantially improve this manuscript.
Notes and references
- G. Cao, L. Su, X. Zhang and H. Li, Mater. Res. Bull., 2010, 45, 425 CrossRef.
- M. A. Salam, Chem. Eng. J., 2015, 270, 50 CrossRef.
- E. Saputra, S. Muhammad, H. Sun, H. M. Ang, M. O. Tadé and S. Wang, Appl. Catal., B, 2013, 142, 729 CrossRef.
- M. Zhu, Z. Wang, S. Xu and T. J. Li, J. Hazard. Mater., 2010, 181, 57 CrossRef PubMed.
- S. M. Maliyekkal, K. P. Lisha and T. Pradeep, J. Hazard. Mater., 2010, 181, 986 CrossRef PubMed.
- L. Zhou, J. He, J. Zhang, Z. He, Y. Hu, C. Zhang and H. He, J. Phys. Chem. C, 2011, 115, 16873 Search PubMed.
- M. L. Chacón-Patiño, C. Blanco-Tirado and J. P. Hinestroza, Green Chem., 2013, 15, 2920 RSC.
- Y. Wang, X. Zhang, X. He, W. Zhang, X. Zhang and C. Lu, Carbohydr. Polym., 2014, 110, 302 CrossRef PubMed.
- C. Jiao, J. Tao, S. Xu, D. Zhang, Y. Chen and H. Lin, RSC Adv., 2017, 7, 31475 RSC.
- J. Wang, R. Yunus, J. Li, P. Li, P. Zhang and J. Kim, Appl. Surf. Sci., 2015, 357, 787 CrossRef.
- Y. Li, R. Zhao, S. Chao, B. Sun, C. Wang and X. Li, Chem. Eng. J., 2018, 344, 277 CrossRef.
- J. Miao, C. Li, H. Liu and X. Zhang, J. Nanosci. Nanotechnol., 2018, 18, 3982 CrossRef PubMed.
- R. S. Dassanayake, E. Rajakaruna, H. Moussa and N. Abidi, Int. J. Biol. Macromol., 2016, 93(Pt A), 350 CrossRef PubMed.
- F. Lin, Z. Wang, Q. Ma, Y. Yang and R. Whiddon, Appl. Catal., B, 2016, 198, 100 CrossRef.
- J. Wang, L. Zhao, W. Duan, L. Han and Y. Chen, Ind. Eng. Chem. Res., 2012, 51, 13655 CrossRef.
- J. Wang, B. Zhao, L. Zhao, X. Zhang and D. Zhao, Synth. Met., 2015, 204, 10 CrossRef.
- C. Liu, X. Lei, X. Liang, J. Jia and L. Wang, RSC Adv., 2017, 7, 9744 RSC.
- X. Wang, L. Mei, X. Xing, L. Liao, G. Lv, Z. Li and L. Wu, Appl. Catal., B, 2014, 160–161, 211 CrossRef.
- D. Huang, J. Ma, C. Fan, K. Wang, W. Zhao, M. Peng and S. Komarneni, Appl. Clay Sci., 2018, 152, 230 CrossRef.
- M. Ghaedi, S. Hajjati, Z. Mahmudi, I. Tyagi, S. Agarwal, A. Maity and V. K. Gupta, Chem. Eng. J., 2015, 268, 28 CrossRef.
- R. Saravanan, K. M. Mansoob, V. K. Gupta, E. Mosquera, F. Gracia, V. Narayanan and A. Stephen, J. Colloid Interface Sci., 2015, 452, 126 CrossRef PubMed.
- V. K. Gupta, D. Pathania, P. Singh, A. Kumar and B. S. Rathore, Carbohydr. Polym., 2014, 101, 684 CrossRef PubMed.
- J. Wang, B. Deng, H. Chen, X. Wang and J. Zheng, Environ. Sci. Technol., 2009, 43, 5223 CrossRef PubMed.
- K. Zhang, J. Wang, Y. Wang, L. Zhao and Q. Xu, Chem. Eng. J., 2014, 247, 50 CrossRef.
- N. Abidi, L. Cabrales and C. H. Haigler, Carbohydr. Polym., 2014, 100, 9 CrossRef PubMed.
- S. Mopoung and T. Bunterm, Am. J. Appl. Sci., 2016, 13, 814 CrossRef.
- X. Yang, L. Xiong, X. Hu, B. He and G. Chu, Res. Chem. Intermed., 2012, 38, 67 CrossRef.
- L. Zhao, X. Wang, Y. Guo, N. Wu and Y. Xie, Acta Phys.-Chim. Sin., 2003, 19, 896 Search PubMed.
- Y. Li, J. Qu, F. Gao, S. Lv, L. Shi, C. He and J. Sun, Appl. Catal., B, 2015, 162, 268 CrossRef.
- A. Asfaram, M. Ghaedi, A. Goudarzi and S. Hajati, RSC Adv., 2015, 5, 72300 RSC.
- N. Wang, X. Li, J. Yang, Y. Shen, J. Qu, S. Hong and Z. Yu, RSC Adv., 2016, 6, 88897 RSC.
|
| This journal is © The Royal Society of Chemistry 2018 |
Click here to see how this site uses Cookies. View our privacy policy here. 
 Open Access Article
 This Open Access Article is licensed under a Creative Commons Attribution-Non Commercial 3.0 Unported Licence
 *,
Lidong Kou,
Zuohua Huang and
Liang Zhao
*,
Lidong Kou,
Zuohua Huang and
Liang Zhao