 Open Access Article
Localized surface plasmon resonance enhanced photocatalysis: an experimental and theoretical mechanistic investigation
Michele Lemos de Souza*ac,
Diego Pereira dos Santosbc and
Paola Corioc
aDepartment of Chemistry, Fluminense Federal University (UFF), Campus Volta Redonda, RJ, Brazil
bInstitute of Chemistry, University of Campinas (UNICAMP), Campinas, SP, Brazil
cInstitute of Chemistry, University of São Paulo (USP), SP, Brazil. E-mail: paola@iq.usp.br
First published on 13th August 2018
Abstract
Titanium dioxide (TiO2) is an advantageous material in catalytic photodegradation due to its low cost, high stability, and considerably higher efficiency when compared to other semiconductors. However, the need for artificial radiation sources in the UV range is a limitation to its use in wastewater remediation. In this context, Localized Surface Plasmon Resonance (LSPR) has been shown to enhance the photoexcitation of charge carriers in the semiconductor. In the present work, the investigation of catalytic photodegradation of phenol solution under distinct excitation by UV-visible or just visible radiation, employing three TiO2 based plasmonic catalysts, was conducted. Spherical silver nanoparticles which present LSPR along the TiO2 bandgap energy and electrically insulated silver nanoparticles were employed. Gold nanoparticles, which present low energy LSPR, were also employed in order to compare the excitation efficiency. Discrete dipole approximation simulations were carried out in order to verify the electric field enhancement and penetration at the semiconductor surface of each plasmonic catalyst. The results presented here may help to shed some light with respect to the contribution of plasmonic photocatalysts and the charge transfer mechanism in catalysts containing plasmonic structures.
Introduction
Titanium dioxide (TiO2) is a semiconductor largely employed as a catalyst in processes such as wastewater recovery, energy conversion and in dye-sensitized solar cells (DSSC). It is an advantageous material due to its low cost, high stability, and considerably higher efficiency when compared to similar semiconductors. The excitation process on TiO2 occurs strictly under high-energy radiation (λexc < 380 nm) due to its high bandgap energy (Egap) of approximately 3.2 eV in anatase and 3.0 eV in rutile, the most common TiO2 polymorphs.1 Even though the most stable TiO2 polymorph is anatase, several research groups have indicated that mixtures of anatase and rutile present better photoactivity than either of the pure phases.2,3 Therefore, commercial TiO2 Degussa P25 (P25, approximately 75% anatase and 25% rutile) is employed as a standard material in photocatalysis processes in several studies published in past years due to its high catalytic efficiency.2,4Under high energy excitation, the photogenerated electron–hole pair (e−/h+ pair) in the semiconductor catalyst is responsible for oxidative and reductive processes in adsorbed species.5 Organic or water molecules adsorbed onto the catalyst surface may undergo oxidation processes by the positively charged site (h+) at the VB while reduction processes within oxygen and water molecules are carried out by the negatively charged site (e−) at the CB. The generation of the e−/h+ pair yields free radicals in aqueous solution, consequently triggering photodegradation or photoconversion processes.
The need for artificial UV sources in catalytic photodegradation processes increases costs, and thus it is considered a limitation in wastewater remediation. Therefore, recent scientific and industrial interest lies in the development of composite materials that are more efficient under visible light or that exhibit improvement on the e−/h+ pair generation events under UV light, in order to employ sunlight as a radiation source in wastewater treatment, for instance.1,6,7
In this context, Localized Surface Plasmon Resonance (LSPR) has played an important role in recent advances.5,6,8 LSPR is a charge density oscillation confined to metallic nanoparticles (so-called plasmonic nanostructures) under resonance with specific wavelengths of the incident electromagnetic field and which results in the enhancement of local and far electromagnetic fields.8,10 Its optical properties are strongly dependent on particle size, shape, coinage metal and dielectric surroundings.9,11 LSPR has been largely employed in the enhancement of Raman spectroscopy through Surface-Enhanced Raman Scattering (SERS) since the early 1970s; recently it has also been applied as an enhancement mechanism for photocatalysts, resulting in so-called plasmonic photocatalysis.10,11,15 Thus photoexcitation may benefit from the LSPR of plasmonic nanoparticles attached to the semiconductor surface in resonance within the bandgap energy. Therefore, plasmonic nanostructures immobilized to the catalyst may enhance the photocatalysis efficiency through the intense local electromagnetic field.8,12
Plasmonic photocatalysis has been widely discussed in the literature.5,6,11–14 However, some research groups assign the improvement in photocatalysis efficiency strictly to the charge transfer from the metal nanoparticle to the semiconductor CB and the formation of a Schottky barrier.6,13,19
Distinct methods of immobilization of plasmonic structures onto TiO2 aiming to investigate photocatalytic efficiency have been developed based on optimization of synthesis parameters. These plasmonic catalysts have shown a reasonable efficiency response on the generation of H2 and O2 from water decomposition and also on dye photodegradation.14,15
The present work aimed to be a systematic investigation of the excitation mechanism of plasmonic catalysts. In this way, photocatalysis under UV-visible and strictly visible irradiation (UV range filtered) employing plasmonic catalysts was investigated. The plasmonic catalysts were prepared with silver and gold nanoparticles chemically attached to the TiO2 Degussa P25 surface. Furthermore, a plasmonic catalyst was designed with silver nanoparticles capped with silicon dioxide as an electric insulator in order to evaluate the contribution of charge transfer between the semiconductor and the metal nanoparticle, and the formation of a Schottky barrier, as widely proposed in the literature.
Phenol is a chemical compound that is considered to be an important industrial wastewater pollutant. This molecule was employed as a photodegradation target in the present work due to its strong adsorption to TiO2 through hydrogen bonds, which facilitates direct photodegradation. It is important to note that phenol molecules present no light absorption (electronic transition) in the visible range and do not contribute to the electron injection in TiO2 VB as in dye-sensitized photocatalysis, a common issue when employing dyes as degradation targets. However, both phenol and its degradation products exhibit light absorption in the UV region. Thus, the monitoring of phenol degradation directly employing UV-visible spectroscopy is inefficient. This issue was overcome by chemical modification of the remaining phenol molecules in the aliquots retrieved after photodegradation, a common procedure in water treatment plants.16 The colorimetric method resulted in an absorption band at 510 nm by the reaction of phenol molecules and 4-aminoantipyrine.
Phenol photodegradation experiments employing a plasmonic catalyst capped with the insulator shell under strictly visible excitation aided in the confirmation of LSPR enhanced catalysis in comparison to the experiment containing pure P25 and the catalyst with non-insulated plasmonic nanostructures. On the other hand, photocatalysis under UV-visible radiation excitation was not expected to show a considerable difference between plasmonic catalysts and pure P25, since direct excitation of TiO2 is more intense than LSPR excitation. The photocatalysis experiment using a plasmonic catalyst with Au nanoparticles presented little intensification, and the results of DDA aided interpretation of the experimental results.
Experimental
Materials
Silver nitrate (AgNO3, >99%), 3-mercaptopropionic acid (MPA), sodium borohydride (NaBH4), sodium citrate dihydrate (Na3(C6H5O7)·H2O), polyvinylpyrrolidone 10000 (PVP 10000), phenol, 1-ethyl-3-(3-dimethylaminopropyl) carbodiimide hydrochloride (EDC), oxalic acid, 4-aminoantipyrine, potassium persulfate and tetraethyl orthosilicate (TEOS) were purchased from Sigma-Aldrich, and TiO2 P25 Aeroxide® (P25) was purchased from Degussa-Evonik. All chemicals were used without further purification.A high-pressure 125 W Hg lamp (Philips HPL-N) without the glass bulb was employed as the radiation source. The lamp exhibits Hg emission lines at 690, 579, 576, 548, 491, 435, 407, 404 and 365 nm. The Museum Glass® from True Vue™ was employed as a UV cut-off filter, placed between the lamp and the photodegradation vessel, by attenuating the 365 nm line and higher energy emission by two orders of magnitude. A Shimadzu UV-3101 PC spectrophotometer was used to monitor the photocatalysis and to characterize the photocatalysts through Diffuse Reflectance (DR) spectra by using an integrating sphere. Transmission Electron Microscopy (TEM) and energy dispersive X-ray spectroscopy (EDS) analysis were carried out on a Philips CM 200 Microscope operating at 200 kV.
P25 + Ag NPs: NPs synthesis and immobilization onto TiO2
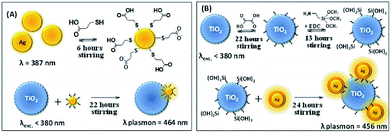
The synthesis of silver nanoparticles (Ag NPs) was carried out following the Creighton, Blatchford and Albrecht report17 with some modifications. In an Erlenmeyer flask containing 150 mL of ice-cold NaBH4 (2.0 mM) in a sonicator with an ice bath and under vigorous stirring in order to aid monodispersity, 50 mL of AgNO3 (1.0 mM) was added. The resulting pale yellow colored suspension was kept in the sonicator for an additional 5 minutes. The resulting suspension was heated on a heating plate and intercalated between heating and manually stirring away from the heating plate, in order to remove the BH4− excess. This was performed with caution so that the solution did not boil. During the heating process, as soon as the suspension started to get dark in color, the Erlenmeyer flask was removed from the heating plate and vigorously stirred until the suspension returned to a yellow color. This procedure was repeated until the suspension stabilized at a yellow color. The resulting suspension presented an extinction band maximum at 435 nm.In a beaker, 75 mL of the Ag NPs colloidal suspension was diluted in 525 mL of deionized water under stirring. To this diluted suspension, 1.20 mL of MPA solution in acetonitrile (0.10 M) was added dropwise. The suspension was kept under stirring for 6 h in order to adsorb the MPA to the Ag NPs by the thiol functional group, leaving the carboxylic acid functional group free. A suspension containing 75 mL of deionized water and 3.0 g of P25 was added to the suspension of thiol-modified Ag NPs and kept under stirring for 22 h in the dark. The Ag NPs containing carboxylic acid groups tend to adsorb onto the TiO2 surface through the carboxylic acid group. After the adsorption of the thiol-modified Ag NPs onto TiO2, the suspension was filtered and washed abundantly with deionized water until the pH of the waste solution reached neutral pH. The yellowish solid was dried in a desiccator for 24 h, mechanically powdered and stored in a flask protected from light. The Ag immobilization onto TiO2 is represented in Scheme 1A.
P25 + Ag@SiO2 NPs: NPs synthesis, growth of SiO2 shell and immobilization onto TiO2
The synthesis of Ag NPs coated with SiO2 (Ag@SiO2 NPs) was described by Shanthil and co-workers.18 An Erlenmeyer flask containing 250 mL of AgNO3 aqueous solution (1.06 mM) was heated until the solution boiled and 10 mL of sodium citrate dihydrate aqueous solution (38.8 mM) was added dropwise under vigorous stirring. The solution was kept under heating and stirring for 1 h and then cooled to room temperature. The Ag NPs suspension was centrifuged (5000 rpm) for 20 min and dispersed in distilled water (250 mL). To this solution, 2 mL of an aqueous solution containing 50 mg of PVP 10000 was added and it was kept under stirring for 24 h. The PVP stabilized NPs (Ag-PVP NPs) were purified by an abundant washing and centrifugation (5000 rpm) procedure for 30 min, and then dispersed in distilled water (25 mL).The Ag-PVP NPs suspension (25 mL) was added to 225 mL of isopropanol under vigorous stirring. To the above solution, ammonium hydroxide (25% v/v, 4.8 mL) and TEOS (50% v/v, 100 μL) solutions were added. The silicon dioxide polymerization was carried out by keeping the above suspension at room temperature (∼28 °C) for 15 min and then it was transferred to a refrigerator to allow the silicon dioxide shell to grow. The solution temperature reached a minimum of 10 °C. The mixture was left to react for 90 min and then abundantly washed with deionized water and centrifuged at 5000 rpm in order to separate the remaining unreacted material from the Ag@SiO2 NPs. The purification procedure was repeated three times. The colloidal suspension presented a maximum extinction band at 435 nm, in agreement with the literature.
The Ag@SiO2 immobilization procedure into the Degussa P25 was executed in a three step method based on Caro and co-workers' report.19 An Erlenmeyer flask containing 400 mL of deionized water, 0.252 g of oxalic acid (5.0 mM) and 2.0 g of Degussa P25 was kept under stirring in the dark for 22 h in order to chemically activate the TiO2 surface due to the adsorption of the dicarboxylic acid. After this procedure, the modified TiO2 (TiO2–COOH) was exhaustively washed with deionized water until pH stabilization (pH 4.30) due to the acid dynamic equilibrium.
The second step concerned the reaction between the carboxylic acid function at the TiO2 surface and the amine group on the APTMS by the action of EDC, a dehydration agent, towards amide formation. The APTMS (200 μL) and EDC (3 mg) were added to the TiO2–COOH suspension simultaneously, resulting in a 1![[thin space (1/6-em)]](https://www.rsc.org/images/entities/char_2009.gif) :
:![[thin space (1/6-em)]](https://www.rsc.org/images/entities/char_2009.gif) 1 mol/mol proportion, and kept under vigorous stirring for 13 h. This suspension was abundantly washed, centrifuged and suspended in 400 mL of deionized water in a sonicator bath. The semiconductor surface in this stage reacted forming amide groups and leaving free hydrolyzed silane groups (TiO2–Si(OH)3) from the APTMS.
1 mol/mol proportion, and kept under vigorous stirring for 13 h. This suspension was abundantly washed, centrifuged and suspended in 400 mL of deionized water in a sonicator bath. The semiconductor surface in this stage reacted forming amide groups and leaving free hydrolyzed silane groups (TiO2–Si(OH)3) from the APTMS.
After the semiconductor functionalization, the third step concerned the joining of Ag@SiO2 to modified TiO2 (TiO2–Si(OH)3). The nanocomposite preparation was carried out by adding 2 mL of colloidal Ag@SiO2 to TiO2–Si(OH)3 in an aqueous solution and this was kept under stirring for 24 h. The nanocomposite TiO2–Ag@SiO2 was abundantly washed and filtered. The resulting pale yellow solid was dried in a desiccator for 24 h, mechanically powdered and stored protected from light. The SiO2 shell thickness and the Ag NPs average diameter were estimated through the analysis of TEM images employing ImageJ software. The Ag@SiO2 immobilization onto TiO2 is represented in Scheme 1B.
P25 + Au NPs: NPs synthesis and immobilization in TiO2
The synthesis of gold nanoparticles (Au NPs) was carried out, as reported by Frens20 based on Turkevich's procedure, resulting in nanostructures with an average diameter of 40 nm. Therefore, 50 mL of a HAuCl4 solution (0.01%) was heated to boil. To this solution, 0.50 mL of a sodium citrate dihydrate solution (1%) was added and it was kept under heating and vigorous stirring. The solution turned dark blue in a few seconds and then became brilliant red, indicating the formation of monodisperse spherical particles. The complete reaction lasted 5 minutes and the resulting suspension presented an extinction maximum at 525 nm. The Au NPs immobilization in Degussa P25 was followed as described for Ag NPs immobilization in Degussa P25. The Au immobilization onto TiO2 is similar to that represented in Scheme 1A.Photocatalytic degradation
The photodegradation process was performed in a reactor containing a high-pressure 125 W Hg lamp without the glass bulb (irradiation of ca. 108 W m−2 for λ > 254 nm) as the radiation source. The radiation source was placed 20 cm immediately above an open-to-air top borosilicate cylindrical cell of 6 cm diameter with lateral input/output of water for thermal conditioning connected to a thermostatic bath (20 ± 0.1 °C). The degraded solution temperature was monitored by a thermostat connected to an external multimeter. Museum Glass® from True Vue™ was placed between the radiation source and the reaction vessel as a UV cut-off filter.As a photocatalytic target, phenol solution (100 mL of a 1.0 mM aqueous solution) containing 0.5 g L−1 of one of the photocatalysts (pure Degussa P25, P25 + Ag NPs, P25 + Ag@SiO2 NPs or P25 + Au NPs) was employed. Initially, the suspension was kept in the dark under stirring for 1 hour in order to stabilize the adsorption equilibrium between phenol and the photocatalyst. The irradiation was initialized after the suspension reached the adsorption equilibrium. Aliquots of 2 mL were withdrawn periodically during the degradation processes and centrifuged twice at 13![[thin space (1/6-em)]](https://www.rsc.org/images/entities/char_2009.gif) 400 rpm to separate the supernatant to allow further analysis by UV-VIS spectroscopy. Photocatalytic experiments were performed three times with each catalyst in order to obtain a more accurate result.
400 rpm to separate the supernatant to allow further analysis by UV-VIS spectroscopy. Photocatalytic experiments were performed three times with each catalyst in order to obtain a more accurate result.
The phenol removal was analyzed through UV-VIS spectroscopy following the chemical modification with 4-aminoantipyrine by the colorimetric procedure, described as follows.21 A solution containing 1.9 mL of water, 200 μL of ammonium buffer solution (NH4+/NH3 pH 10.0 ± 0.2), and 100 μL of a degraded phenol aliquot was mixed. To this solution, 200 μL of 4-aminoantipyrine solution (2%) and 200 μL of potassium persulfate (5%) were added. The resulting solution presented an absorbance at 510 nm. In order to verify the relative absorbance decay, an analytic blank was prepared by employing 2 mL of pure water instead of using phenol solution. The phenol removal was evaluated through the normalized absorbance intensity by the initial absorbance (t = 0 min). The relative absorbance at 510 nm as a function of the irradiation time was employed to evaluate the efficiency of the catalyst.
Discrete dipole approximation simulations
Discrete Dipole Approximation (DDA) simulations were performed using the DDSCAT 7.1 program developed by Draine and Flatau.22 All simulations assumed a composite model containing one plasmonic nanoparticle, adsorbed to a 50 nm diameter TiO2 spherical particle, spaced by 1 nm and immersed in water as a surrounding dielectric medium. To model the P25 + Ag@SiO2 composite, a silicon dioxide shell of 4 nm thickness was considered. The plasmonic structures Ag, Ag@SiO2, and Au were each set to have a 30 nm diameter for the metal nanoparticle. All materials were simulated in terms of experimental wavelength-dependent dielectric function data. For silver and gold, data from studies by Palik,23 and Johnson and Cristy24 were used, respectively, whereas for SiO2 and TiO2 we used the data from ref. 25 and 26, respectively.Results and discussion
Catalyst characterization
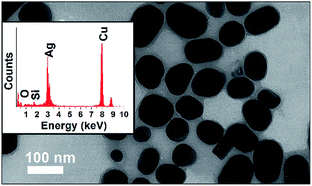
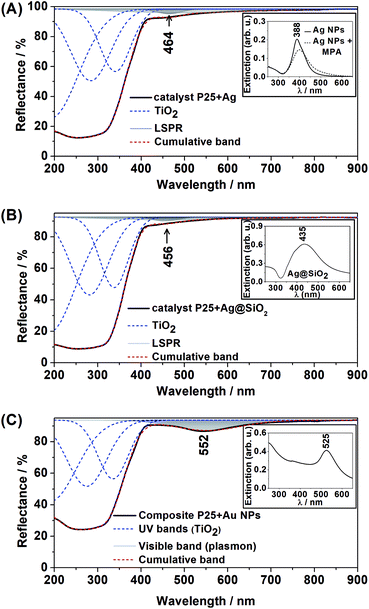
The Ag@SiO2 NPs TEM image shown in Fig. 1 presents a thin shell in light grey assigned to SiO2 in contrast to the dark grey core assigned to Ag spheres. The EDS inset in Fig. 1 confirms the presence of Ag (peak at 3.00 keV) and Si (peak at approximately 1.80 keV), while the Cu peak is due to the TEM grid. The Ag NPs presented an average diameter of 27.2 ± 12.6 nm (analysis of 38 nanoparticles) and the SiO2 shell thickness, of approximately 15 nm, is able to provide electric isolation and then prevent electron scavenge from the excited TiO2 to the metallic NP during the semiconductor excitation.The DR spectra of the plasmonic semiconductor composites are shown in Fig. 2(A)–(C). Band deconvolution was performed for all DR spectra, demonstrating the strong absorbance bands for TiO2 in the UV region and a small absorbance band in the visible range for all plasmonic composites.
The bands at 464 nm and 456 nm in Fig. 2(A) and (B), respectively, are assigned to Ag LSPR, and the band at 552 nm in Fig. 2(C) is assigned to Au LSPR. This result is in agreement with the UV-VIS spectra of Ag NPs, Ag@SiO2 and Au NPs aqueous suspensions (Fig. 2 inset), which show extinction bands at 388 nm, 435 nm and 525 nm respectively. In addition, it is clear that the adsorption of MPA at the Ag NPs surface had a low effect on the LSPR, as shown in Fig. 2(A) inset. The observed redshift in the DR spectra for all composites was due to the change in the surrounding nanoparticle dielectric (from water to air/TiO2).
The presence of Au NPs in the P25 + Au composite was confirmed by the characteristic LSPR maximum in long wavelengths in the visible range of the DR spectrum. On the other hand, the presence of Ag NPs in the P25 + Ag composite was not confirmed by the DR spectra. Thus, TEM images and EDS measurements were acquired to confirm the presence of Ag NPs in the composite material, as shown in Fig. 3. In Fig. 3 the EDS demonstrates strong Ag and Ti peaks, confirming the abundance of plasmonic structures in the composite.
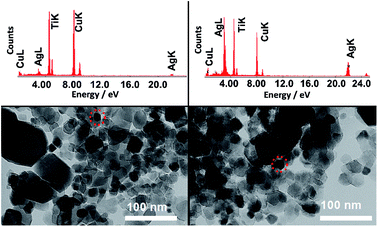 | ||
| Fig. 3 TEM images of two representative regions of the copper grid with a P25 + Ag NPs sample. The EDS above each TEM image refers to the respective area highlighted by the dashed circle. | ||
Photocatalysis under visible light excitation
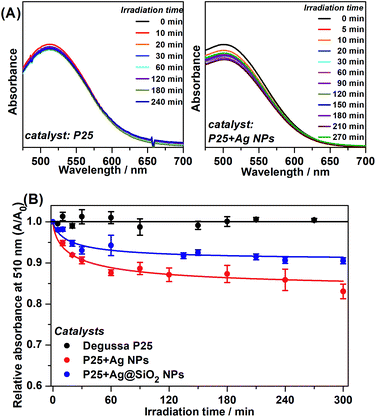
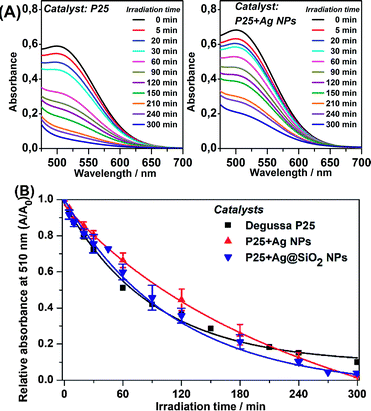
Phenol photodegradation in an aqueous solution was performed under visible light irradiation. The UV radiation was filtered by placing the Museum Glass® between the light source and the catalysis vessel. The photocatalysis employing pure P25 and the Ag plasmonic composites was carried out in order to investigate a possible enhancement of photodegradation efficiency under such conditions and its main mechanism. Fig. 4(A) presents the UV-VIS spectra of the photodegraded phenol solution after the colorimetric treatment as a function of the irradiation time as catalyzed by pure P25 and P25 + Ag NPs under visible irradiation. The absorbance at 510 nm is due to the chemical modification reaction between the remaining phenol solution and 4-aminoantipyrine.Fig. 4(A) shows a clear decay in relative absorbance as a function of time for the system P25 + Ag NPs whereas for pure P25 the absorbance remains approximately constant. The decrease in this absorption is an indication of a decrease in phenol concentration and, therefore, it is an indirect observation of a better catalytic performance for the metal-containing system.
The graphs of the relative absorbance decay at 510 nm, as a function of irradiation time to all catalyzed photodegradation processes, are presented in Fig. 4(B).
The photocatalysis kinetics fitted to pseudo-second-order kinetics and the obtained relative rate constant (kobs) for each photodegradation is shown in Table 1.
| kobs | Phenol removal after 300 min visible irradiation/% | |
|---|---|---|
| P25 | 1 | 0.90 ± 0.040 |
| P25 + Ag NPs | 304 | 16.9 ± 1.80 |
| P25 + Ag@SiO2 | 270 | 9.50 ± 0.710 |
Although there was low removal by the plasmonic catalyst after 300 minutes, it is important to highlight that the irradiation source was strictly in the visible range, which is evident by the absence of phenol removal by employing pure P25. These experiments pointed out the advantageous plasmonic effect on the photocatalytic degradation under visible irradiation compared to pure P25. The best kinetics are demonstrated by the kobs values obtained for P25 + Ag NPs and P25 + Ag@SiO2. After 300 minutes of photocatalysis employing pure P25, there was no substantial phenol removal from the initial solution. This may be explained by the small probability of the low energy irradiation (visible range) being sufficient to excite the semiconductor e−/h+ pair separation. The little degradation from P25 catalysis (0.90 ± 0.040%) may be due to a residual UV radiation that may have been incompletely filtered.
The phenol removal percentage after 300 minutes of photodegradation catalyzed by the plasmonic catalyst (between 9.5% and 16.9%), may be associated with the presence of Ag NPs with LSPR at the edge between the UV and visible ranges. The Ag NPs LSPR and the P25 bandgap present an absorption/extinction band overlap in this wavelength region, causing an increase in the probability of excitation of the e−/h+ pair in the catalyst. The kobs indicated considerably greater degradation kinetics when Ag NPs and Ag@SiO2 NPs and the semiconductor are present. In addition, between P25 + Ag NPs and P25 + Ag@SiO2 composites, it should be considered that in the P25 + Ag@SiO2 the LSPR intensity decays with the distance from the metallic NP surface. Therefore, the SiO2 layer acts as a spacer between the P25 and the Ag NP, resulting in a decrease in the electromagnetic local field intensity from the LSPR, and so lowers the excitation efficiency and thus catalysis efficiency. The results confirmed the influence of Ag NPs plasmonic enhancement under visible radiation on photocatalysis.5,8,11,27
The purpose of an SiO2 shell for the Ag NPs in the P25 + Ag@SiO2 composite was to supply an electrical insulator between the Ag NPs and the semiconductor in order to prevent charge transfer and the Schottky barrier during the photocatalysis. If this mechanism was dominating, we should not observe improvement in the photocatalysis by using Ag@SiO2 particles. In fact, not only do we observe an increase in the photocatalytic efficiency, but we also observe that this efficiency is even comparable to the results seen after using Ag NPs, for which we observe a greater phenol decomposition rate and reduced phenol content after 300 min of light irradiation. Therefore, the catalysis employing non-insulated Ag NPs and insulated Ag@SiO2 NPs presented similar kinetic efficiencies and the amount of content removed, indicating that the observed improvement in catalysis should not be assigned to charge transfer,28 but to LSPR enhancement at the catalyst surface.
The relative absorbance as a function of time employing plasmonic catalysts presented a plateau after approximately 120 minutes of irradiation. This behavior might be explained by the detachment of the plasmonic NPs from Degussa P25 restoring the pure semiconductor activity which has no catalytic efficiency under visible radiation.
Photocatalysis under UV-visible excitation
Under UV-visible irradiation the plasmonic catalysts may present both mechanisms simultaneously: (i) direct semiconductor excitation by the UV radiation; and (ii) semiconductor excitation through the LSPR excitation by the visible radiation. Since UV light presents energy with a larger probability for the excitation of e−/h+ pairs, we expect the first mechanism to be more efficient than the latter. Fig. 5(A) shows the UV-VIS spectra after photodegradation of phenol, through the colorimetric method, employing P25 and P25 + Ag NPs as a function of the UV irradiation time. The spectra in Fig. 5(A) show that both catalysts presented similar efficiency under UV-visible irradiation, confirming the semiconductor excitation under UV radiation. The relative absorbances at 510 nm as a function of time for the distinct catalysts are shown in Fig. 5(B).The catalysis under UV-visible irradiation adjusts to a pseudo-first-order kinetic law, with a larger rate than the catalysis under visible irradiation, as expected, since the direct excitation is very efficient and also because the two mechanisms are taking place simultaneously in this experiment.
The phenol photocatalytic degradation byproducts (catechol, resorcinol and hydroquinone) present absorption maxima in solution at 275 nm, 278 nm and 288 nm, respectively. When attached to TiO2 these molecules may be responsible for enhancing the semiconductor excitation, as in dye-sensitized catalysis.29 However, this effect has a low influence on the amount of content removed and the kinetics. In addition, the UV direct excitation is more efficient than the indirect LSPR excitation, explaining the pseudo-first-order kinetics. Table 2 shows the pseudo-first-order relative rate constant (kobs) and the removal percentage after 300 minutes of UV-visible irradiation.
| kobs | Phenol removal after 300 min of UV-visible irradiation/% | |
|---|---|---|
| Degussa P25 | 1.00 | 90.0 ± 1.00 |
| P25 + Ag NPs | 0.57 | 97.7 ± 0.200 |
| P25 + Ag@SiO2 | 1.06 | 97.0 ± 1.00 |
The phenol photocatalytic degradation reached 97.7% after 300 minutes of irradiation employing the plasmonic nanocomposites. At the end of the catalysis, a plateau was observed (after 240 minutes) in Fig. 5(B), which may be attributed to catalyst poisoning by phenol byproducts. Such byproducts occupy the catalyst sites on the TiO2 surface blocking phenol and water molecules from undergoing oxidation and reduction processes.30
Table 2 shows that the plasmonic catalysts presented an increase of approximately 7% with respect to phenol removal compared to the regular P25 catalyst. The improvement can probably be attributed to the plasmonic effect. The observations for P25 + Ag NPs, and the P25 + Ag@SiO2 system under UV-visible radiation confirmed the plasmonic enhanced mechanism proposed in the case of the visible irradiation experiment. The plasmonic effect was an additive effect to the direct excitation of P25, as presented for the photocatalysis under visible excitation.
Investigation of the LSPR influence on catalysis: theoretical and experimental results
The ascertainment of the LSPR influence over TiO2 excitation under visible radiation was carried out through the verification of the catalytic efficiency out of resonance, when the plasmonic resonance has lower energy than required to excite the semiconductor, by the use of Au NPs, for instance.Fig. 6(A), (B) and (C) present DDA simulations of absorption (black) and scattering (red) spectra of composites of TiO2 + Ag NPs, TiO2 + Ag@SiO2 NPs and TiO2 + Au NPs, respectively. The experimental DR spectra in Fig. 2, along with the DDA simulations in Fig. 6, clearly show that the Ag catalysts present plasmon resonance at high energies and thus the LSPR may influence TiO2 excitation for enhanced catalysis under visible irradiation. On the other hand, the Au NPs composite presents LSPR with much lower energy than the TiO2 band-gap, and it may not influence the catalysis efficiency.
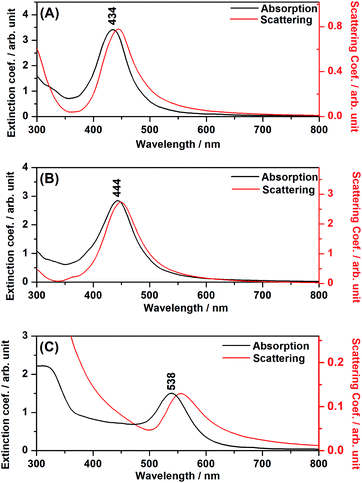 | ||
| Fig. 6 DDA simulations for the composites. (A) TiO2 + Ag NPs; (B) TiO2 + Ag@SiO2; (C) TiO2 + Au NPs. | ||
In the DDA simulations, the LSPR maxima for the Ag and Au NPs suffered a shift to longer wavelengths, as compared to the plasmonic nanoparticles in aqueous suspension, due to the interaction between the metal nanoparticle and the adjacent semiconductor material. It is clear from Fig. 2 that the shifts occurred in all composites, indicating the attachment of the plasmonic nanostructure to the semiconductor and the electromagnetic interaction among both moieties.
It is interesting to note, from Fig. 6, the redshift for the scattering spectrum with respect to the absorption spectrum, especially in the cases where the metal nanoparticles are in close contact with the TiO2 surface (Fig. 6(A) and (C)). As it will be discussed below, in the case of the simulated systems, such interactions may involve an image-dipole in the semiconductor (Scheme 2), which may strongly affect the scattering properties of the system.
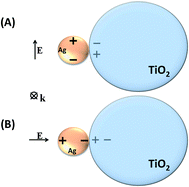 | ||
| Scheme 2 Image-dipole representation (A) parallel; (B) perpendicular to the electromagnetic field oscillation. | ||
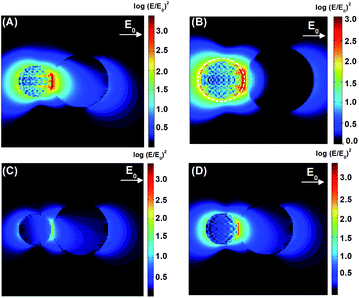
The DDA simulations allowed for the construction of theoretical maps of the enhancement of the electric field radiation intensity (E/E0)2 of the composites at the maximum wavelength, corresponding to the LSPR of each composite. A theoretical field map was also built for P25 + Au NPs far from the LSPR maximum, that is, at the minimum energy needed to excite the TiO2. These maps are shown in Fig. 7.
The LSPR electromagnetic field may couple with the semiconductor dielectric resulting in a dipolar resonance parallel or perpendicular to the surface (Scheme 2). The oscillating electron density in the metal due to the plasmon resonance induces an image charge oscillation into the interior of the dielectric material. This leads to a destructive interference in the case of the dipolar resonance parallel to the surface (Scheme 2A). On the other hand, in the case of the dipolar resonance perpendicular to the surface (Scheme 2B), the dipole is projected into the dielectric semiconductor resulting in an enhancement of local electric field amplitude in the interparticle region.
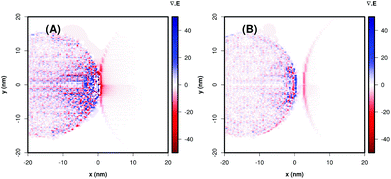
The P25 + Ag NPs and P25 + Ag@SiO2 maxima LSPR are close to the minimum energy required for the excitation of TiO2. The field maps at 434 nm and 444 nm, from the P25 + Ag NPs and P25 + Ag@SiO2 composites shown in Fig. 7(A) and (B), indicate an enhancement of the incident field of approximately 103-fold at the TiO2 surface. Fig. 7(A) and (B) also demonstrate a considerable electromagnetic field penetration into the semiconductor interior in agreement with the catalytic degradation efficiency already discussed in this work. As can be seen in the maps (Fig. 7(B)), the SiO2 layer acts as a spacer, decreasing the electromagnetic coupling between the metal nanoparticle excited dipolar plasmon mode and the induced image dipole in the semiconductor surface. This leads to a smaller electric field enhancement on the TiO2 surface in the presence of the electrically insulated particle, contributing to a smaller probability rate of e−/h+ pair formation, thereby influencing the rate constant and the amount of phenol photodegradation, as can be observed in Table 1. There is another important parameter that may also be affected by the plasmonic electromagnetic field. Fig. 8 shows a representation of charge densities (divergence of the local electric field)31 under the same conditions as in Fig. 7. Since the charge densities at the metal nanoparticle are much larger than in TiO2, we applied a cutoff in the results to make visualization of charges in the semiconductor possible. Nevertheless, Fig. 8 shows that for TiO2 + Ag NP, the induced charge density in the semiconductor is larger than for the system TiO2 + Ag@SiO2, which indicated a system with a larger degree of charge separation induced by the plasmonic field. This suggests that we can expect a smaller rate of e−/h+ pair recombination in the absence of the insulator, contributing to better photocatalytic performances.
The P25 + Au NPs system exhibits no wavelength overlap between the maximum LSPR and the minimum energy required for TiO2 excitation (Fig. 6). The field intensity map shown in Fig. 7(C) presented an enhancement of less than 101 at 434 nm as compared to the incident light (roughly 3.6 times). Conversely, at 538 nm (P25 + Au NPs LSPR at resonance) the normalized electric field map shows a 102.5-fold enhancement, although the energy that penetrates the semiconductor material is not high enough to excite the e−/h+ pair and does not contribute to the catalytic degradation efficiency.
The photocatalytic degradation experiments employing pure P25, P25 + Ag NPs and P25 + Au NPs were performed and the relative absorbance was obtained by the colorimetric method as shown in Fig. 9.
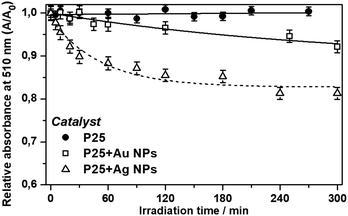 | ||
| Fig. 9 Relative absorbance maxima at 510 nm as a function of time for the photocatalytic degradation of phenol under visible irradiation for bare P25, P25 + Ag NPs and P25 + Au NPs. | ||
The 3.6 fold-increase of the field intensity at 434 nm for the P25 + Au NPs composite was responsible for the occurrence of slight photocatalytic efficiency (8% of degradation after 300 minutes) as presented in Fig. 9. The main reason for such a great difference between Ag and Au NPs lies with the LSPR wavelength resonance match with the semiconductor band gap.
Thus, the proposed mechanism in plasmonic photocatalysis, based on the present experimental and theoretical results, considers the LSPR of Ag NPs at the semiconductor surface to be excited under visible irradiation, and the local electric field enhancement in resonance with the semiconductor bandgap energy amplifies the probability of e−/h+ pair formation and separation.
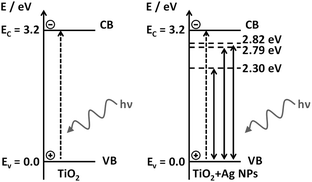
The energy diagrams in Scheme 3 represent the valence (VB) and conduction (CB) bands of TiO2 (solid horizontal lines), accepting the VB as a reference, and the energies of the gap levels are labeled with respect to VB. TiO2 excitation occurs under UV radiation (dashed vertical line in the left diagram), and the LSPR energies due to the presence of Ag NPs, energy levels in 2.82, 2.79 and 2.30 eV, with respect to 434, 444 and 538 nm excitation (dashed horizontal lines in the right diagram). The LSPR energy values correspond to the maximum extinction band, however, a certain amount of the local electric field with greater and lower energy than the maxima at 2.82 and 2.79 eV are also present. The greater energy LSPR may be enough to excite the TiO2 e−/h+ pair and may be responsible for the indirect excitation of the TiO2, causing the e−/h+ pair generation.
We argue that the LSPR band overlap with the semiconductor bandgap energy is the main mechanism responsible for the plasmonic enhancement of photocatalysis. This proposed mechanism was confirmed by the investigation of the behavior of electrically insulated Ag@SiO2 NPs, which prevented the charge transfer from occurring, as well as preventing the formation of a Schottky barrier. In addition, in the photocatalysis under UV-visible irradiation direct TiO2 excitation may occur simultaneously with the LSPR effect of the Ag NPs, with a small improvement of the catalytic efficiency of the plasmonic P25 in comparison to pure P25 in such conditions.
Conclusions
The proposed mechanisms responsible for plasmonic enhancement in photocatalysis were evaluated through experiments under visible irradiation, employing plasmonic catalytic composites with resonance energies near to and far from the semiconductor bandgap energy. Phenol was employed as a target photodegradation molecule because it has no light absorption in the visible range and does not act as a sensitizer to TiO2 under visible irradiation. The plasmonic catalysts presented good efficiency under visible excitation while pure P25 had no considerable catalytic efficiency. There was a comparable level of degradation between P25 + Ag@SiO2 and P25 + Ag composites with respect to both irradiation energies, with better efficiency in the case of non-insulated metal nanoparticles. These observations gave rise to the conclusion that the main mechanism responsible for the enhancement of plasmonic photocatalysis is probably the local enhancement in the intensity of the incident field due to the LSPR excitation. DDA simulations and experimental results are in very good agreement with this interpretation that suggests an LSPR effect by electric field enhancement and penetration at the semiconductor surface. Photocatalysis employing P25 + Au NPs presented very low efficiency as expected. Through DDA simulations it was observed that Au nanoparticles present intense electric field enhancement at low energies and Ag nanoparticles present electric field enhancement at higher energies. Although Au nanoparticles at the semiconductor surface present considerable LSPR intensity, the LSPR has insufficient energy to excite the semiconductor.Conflicts of interest
There are no conflicts to declare.Acknowledgements
The authors thank FAPESP [grants 2008/03636-5 and 2016/21070-5], CNPq [grants 307943/2014-3, 407447/2016-4 and 408985/2016-0] and CAPES for the financial support; Prof. Pedro Kiohara (Physics Institute, USP) for the TEM measurements; and the Contemporaneous Art Museum of USP (MAC-USP) for providing the Museum Glass®.References
- N. Venkatachalam, M. Palanichamy and V. Murugesan, Mater. Chem. Phys., 2007, 104, 454 CrossRef.
- T. Ohno, K. Tokieda, S. Higashida and M. Matsumura, Appl. Catal., A, 2003, 244, 383 CrossRef.
- D. C. Hurum, A. G. Agrios, K. A. Gray, T. Rajh and M. C. Thurnauer, J. Phys. Chem. B, 2003, 107(19), 4545 CrossRef; J. Zhang, P. Zhou, J. Liu and J. Yu, Phys. Chem. Chem. Phys., 2014, 16, 20382 RSC.
- T. Ohno, K. Sarukawa, K. Tokieda and M. Matsumura, J. Catal., 2001, 203, 82 CrossRef; D. C. Hurum, K. A. Gray, T. Rajh and M. C. Thurnauer, J. Phys. Chem. B, 2005, 109, 977 CrossRef PubMed.
- C. E. Bonancêa, G. M. do Nascimento, M. L. de Souza, M. L. A. Temperini and P. Corio, Appl. Catal., B, 2008, 77(3–4), 339 CrossRef; C. E. Bonancêa, G. M. do Nascimento, M. L. de Souza, M. L. A. Temperini and P. Corio, Appl. Catal., B, 2006, 69(1–2), 34 CrossRef.
- P. S. Ali and A. Ashkarran, Colloids Surf., A, 2018, 537(20), 155 Search PubMed.
- J. Low, S. Qiu, D. Xu, C. Jiang and B. Cheng, Appl. Surf. Sci., 2018, 434, 423 CrossRef; K. S. Yang, Y. R. Lu, Y. Y. Hsu, C. J. Lin, C. M. Tseng, S. Y. H. Liou, K. Kumar, D. H. Wei, C. L. Dong and C. L. Chen, J. Phys. Chem. C, 2018, 122(12), 6955 CrossRef.
- W. Hou, Z. Liu, P. Pavaskar, W. H. Hung and S. B. Cronin, J. Catal., 2011, 277(2), 149 CrossRef; P. Wang, B. Huang, Y. Dai and M.-H. Whangbo, Phys. Chem. Chem. Phys., 2012, 14(28), 9813 RSC; K. Awazu, et al., J. Am. Chem. Soc., 2008, 130(5), 1676 CrossRef PubMed; Z. W. Liu, W. B. Hou, P. Pavaskar, M. Aykol and S. B. Cronin, Nano Lett., 2011, 11(3), 1111 CrossRef PubMed; K. Czelej, K. Cwieka, J. C. Colmenares, K. J. Kurzydlowski and Y.-J. Xu, ACS Appl. Mater. Interfaces, 2017, 9(37), 31825 CrossRef PubMed; M. L. de Souza, D. C. Tristao and P. Corio, RSC Adv., 2014, 4(44), 3351 RSC.
- N. Harris, S. Li and G. C. Schatz, AIP Conf. Proc., 2012, 1504, 31 CrossRef; E. Hutter and J. H. Fendler, Adv. Mater., 2004, 16(19), 1685 CrossRef.
- E. Hutter and J. H. Fendler, Adv. Mater., 2004, 16(19), 1685 CrossRef; A. Shiohara, S. M. Novikov, D. M. Solís, J. M. Taboada, F. Obelleiro and L. M. Liz-Marzán, J. Phys. Chem. C, 2015, 119(20), 10836 CrossRef.
- E. Hao, G. C. Schatz and J. T. Hupp, J. Fluoresc., 2004, 14, 331 CrossRef PubMed.
- K. L. Kelly, E. Coronado, L. L. Zhao and G. C. Schatz, J. Phys. Chem. B, 2003, 107(3), 668 CrossRef.
- W. Hou and S. B. Cronin, Adv. Funct. Mater., 2013, 23, 1612 CrossRef; P. Wang, B. Huang, Y. Daia and M.-H. Whangbo, Phys. Chem. Chem. Phys., 2012, 14, 9813 RSC.
- J. I. Gersten, Phys. Rev. Lett., 1979, 43(2), 147 CrossRef; J. Li, S. K. Cushing, J. Bright, F. Meng, T. R. Senty, P. Zheng, A. D. Bristow and N. Wu, ACS Catal., 2013, 3(1), 47 CrossRef; S. W. Verbruggen, M. Keulemans, M. Filippousi, D. Flahaut, G. V. Tendeloo, S. Lacombe, J. A. Martens and S. Lenaerts, Appl. Catal., B, 2017, 156–157, 116 Search PubMed.
- C. Hägglund, M. Zäch and B. Kasemo, Appl. Phys. Lett., 2008, 92(1), 1 CrossRef.
- K. L. Kelly, E. Coronado, L. L. Zhao and G. C. Schatz, J. Phys. Chem. B, 2003, 107(3), 668 CrossRef.
- J. A. Creighton, C. G. Blatchford and M. G. Albrecht, J. Chem. Soc., Faraday Trans., 1979, 2(75), 790 RSC.
- M. Shanthil, R. Thomas, R. S. Swathi and K. G. Thomas, J. Phys. Chem. Lett., 2012, 3, 1459, DOI:10.1021/jz3004014.
- C. Caro, C. López-Cartes, P. Zaderenko and J. A. Mejías, J. Raman Spectrosc., 2008, 39, 1162 CrossRef.
- G. Frens, Nat. Phys. Sci., 1973, 241, 31 CrossRef.
- G. U. Houghton and R. G. Pelly, Analyst, 1937, 62, 117 RSC.
- B. T. Draine and P. J. Flatau, J. Opt. Soc. Am. A, 1994, 11, 1491 CrossRef.
- E. D. Palik, Handbook of optical constants of solids, Academic Press, 1998, (accessed November 4, 2017), https://www.sciencedirect.com/science/book/9780125444156 Search PubMed.
- P. B. Johnson and R. W. Christy, Phys. Rev. B: Solid State, 1972, 6, 4370 CrossRef.
- C. Z. Tan, J. Non-Cryst. Solids, 1998, 223, 158 CrossRef.
- J. R. DeVore, J. Opt. Soc. Am., 1951, 41, 416 CrossRef; M. B. Ettinger, C. C. Ruchhoft and H. J. Lishka, Anal. Chem., 1951, 23, 1783 CrossRef.
- L. Gomathi Devi and K. Mohan Reddy, Appl. Surf. Sci., 2010, 256, 3116 CrossRef; W. Smith, S. Mao, G. Lu, A. Catlett, J. Chen and Y. Zhao, Chem. Phys. Lett., 2010, 485, 171 CrossRef; Z. W. Liu, W. B. Hou, P. Pavaskar, M. Aykol and S. B. Cronin, Nano Lett., 2011, 11, 1111 CrossRef PubMed.
- P. Christopher, D. B. Ingram and S. Linic, J. Phys. Chem. C, 2010, 114, 9173 CrossRef; W. Hou, P. Pavaskar, Z. Liu, J. Theiss, M. Aykol and S. B. Cronin, Energy Environ. Sci., 2011, 4, 4650 RSC.
- W. H. Lai, Y. H. Su, L. G. Teoh and M. H. Hon, J. Photochem. Photobiol., A, 2008, 195(2–3), 307 CrossRef; B. Zhao, F. Chen, Y. Jiao, H. Yang and J. Zhang, J. Mol. Catal. A: Chem., 2011, 348(1–2), 114 CrossRef; X. Jiang, et al., J. Phys. Chem. C, 2012, 116(27), 14650 CrossRef.
- V. Iliev, D. Tomova, L. Bilyarska, A. Eliyas and L. Petrov, Appl. Catal., B, 2006, 63, 266 CrossRef; U. Terranova and D. R. Bowler, J. Phys. Chem. C, 2010, 114(14), 6491 CrossRef; S. Suresh, V. C. Srivastava and I. M. Mishra, Int. J. Energy Environ. Eng., 2012, 3, 32 CrossRef.
- J. P. Kottmann, O. J. F. Martin, D. R. Smith and S. Schultz, New J. Phys., 2000, 2, 27.1 CrossRef.
| This journal is © The Royal Society of Chemistry 2018 |

