 Open Access Article
Creative Commons Attribution 3.0 Unported Licence
Facile synthesis of a hollow Ni–Fe–B nanochain and its enhanced catalytic activity for hydrogen generation from NaBH4 hydrolysis†
Jie Guo ,
Yongjiang Hou* and
Bo Li
School of Environmental Science and Engineering, Hebei University of Science and Technology, Shi Jiazhuang 050018, China. E-mail: houyongjiang122@163.com
First published on 19th July 2018
Abstract
A hollow Ni–Fe–B nanochain is successfully synthesized by a galvanic replacement method using a Fe–B nanocomposite and a NiCl2 solution as the template and additional reagent, respectively. Both the concentration of Ni and the morphology of the resulting Ni–Fe–B alloy are controlled by varying the duration of the replacement process during the synthesis. The Ni–Fe–B sample synthesized for 60 min (Ni–Fe–B-60) shows the best catalytic activity at 313 K, with a hydrogen production rate of 4320 mL min−1 gcat−1 and an activation energy for the NaBH4 hydrolysis reaction of 33.7 kJ mol−1. The good performance of Ni–Fe–B-60 towards the hydrolysis of NaBH4 can be ascribed to both hollow nanochain structural and electronic effects. Furthermore, the effects of temperature, catalyst amount, and concentration of NaOH and NaBH4 on the hydrolysis process are systematically studied, and an overall kinetic rate equation is obtained. The hollow Ni–Fe–B nanochain catalyst also shows good reusability characteristics and maintained its initial activity after 5 consecutive cycles.
1. Introduction
In recent years, hydrogen has come to be widely accepted as a source of clean energy and possible replacement for fossil fuels, which are responsible for smog, acid rain, and greenhouse effect issues.1 Unlike fossil fuels, the only combustion product of hydrogen is water, which is very gentle on the environment.2,3 However, storage and transportation of hydrogen have become crucial concerns in the development of hydrogen energy technologies. In recent years, chemical borohydride materials, such as LiBH4, NH3BH3, and NaBH4, which have high hydrogen density and low molecular weight, have drawn considerable interest as promising hydrogen storage materials.4–6 Among the chemical borohydrides in contention, NaBH4 is considered the most promising source of hydrogen owing to its stability in alkaline solutions, easily controllable hydrogen generation rate (HGR), moderate reaction temperature, and nontoxic hydrolytic byproducts.7–9 NaBH4 releases 4 mol of H2 in the presence of a catalyst, as shown in eqn (1):3,10| NaBH4 + (2 + x)H2O → NaBO2·xH2O + 4H2 + Heat | (1) |
A large amount of work has focused on the research and development of the appropriate catalyst to be used. Noble metal (e.g., Pt, Ru, and Pd) materials11–17 have been reported to promote high catalytic activity for the hydrolysis of NaBH4. However, they have many limitations in real applications due to their high costs and short lifetimes. In this sense, catalysts based on cheap transition metals such as Fe, Co, Ni, and Cu have attracted significant attention.18–29 Moreover, it is necessary to study the preparation methods of non-noble metal catalysts with high efficiency. The catalysts generally synthesized through traditional chemical reduction of metal ions with borohydride (BH4−) would have limited catalytic activity resulting from agglomeration and low surface area issues, poor electronic conductivity (for e− transportation), and difficult separation from the reaction media after the reaction. To further improve catalytic activity, these problems must be addressed. One strategy is to reduce the catalyst particle size to increase surface area. The synthetic method involves the chemical reduction of a nickel complex precursor (such as hydrazine, ethylenediamine) while controlling the rate of the exothermic reaction to form fine small-sized particles.30–32 However, the smaller the nanoparticle, the harder it is to avoid agglomeration. Another method is to synthesize bimetallic catalysts and adjust the optimal molar ratio of two metals. More recently, Nie et al. found that the Ni–Fe–B catalysts have an enhanced catalytic activity with respect to Ni–B powders.33 The synergetic effect of the most suitable ratio of two metal atoms can facilitate hydrolysis. However, the degree of mixing bimetallic catalysts synthesized by chemical reduction methods is limited in their ability to reach the atomic cluster level. Thus, adjusting the distribution and dispersion of metal atoms is not possible, which could weaken the synergetic effect.
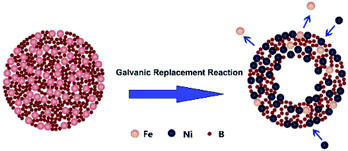
High surface area hollow nanostructure catalysts with well-controlled properties can be facile prepared using the galvanic replacement method.34 Currently, this technique has been used for preparing binary noble metal catalysts35,36 or combinations of transition and noble metals.37,38 In this context, a hollow Ni–Fe–B catalyst for NaBH4 hydrolysis was first synthesized by galvanic replacement reaction. The synthetic mechanism was illustrated in Fig. 1.
Fe–B nanocomposites were used as templates and a NiCl2 solution served as an additive. Upon addition of an aqueous NiCl2 solution to an aqueous suspension of Fe–B nanocomposites, the galvanic replacement started immediately at the site with the high surface energy. Fe atoms were then oxidized and incorporated into the solution. Simultaneously, the electrons quickly migrate to the surface of the nanoparticle and become captured by Ni2+ ions, generating Ni atoms by reduction. The newly formed Ni atoms tend to deposit epitaxial on the surface of the Fe–B nanocomposite. The deposition of Ni was accompanied by the formation of a homogenous alloy of Fe with the Ni on surface, which is more thermodynamically stable than a mixture of segregated Ni and Fe. Continuous dissolution of Fe from the template resulted in the transformation of the nanoparticle into a nanostructure characterized by a hollow interior and an alloyed shell. The obtained hollow Ni–Fe–B was tested for hydrogen generation from the hydrolysis of NaBH4. It exhibited high surface area and excellent catalytic activity for the hydrolysis reaction.
2. Material and methods
2.1 Catalyst preparation
In a typical procedure, Fe–B nanocomposite was used as the template, which was prepared by reducing a 0.5 M ferric chloride [FeCl3·6H2O] (Aladdin Reagent Co., Shanghai, China) and 0.5 M tartaric acid (Aladdin Reagent Co., Shanghai, China) mixed solution (10 mL each) with potassium borohydride (Chuandong Chemical Co., Ltd., Chongqing, China). The products were then filtered and washed several times with deionized water and ethanol. For the synthesis of Ni–Fe–B samples by the galvanic replacement reaction, the Fe–B template was mixed in 10 mL of 0.5 M nickel chloride [NiCl2·6H2O] (Aladdin Reagent Co., Shanghai, China) solution and sonicated for 30, 60 and 120 min, which were aliquoted out and marked as Ni–Fe–B-30, Ni–Fe–B-60 and Ni–Fe–B-120, respectively. Finally, the as-obtained Ni–Fe–B samples were then filtered, washed several times with deionized water and ethanol, and vacuum dried at 330 K. A Ni–Fe–B sample denoted as Ni–Fe–B-c was prepared by traditional chemical reduction, produced by reducing a 0.5 M ferric chloride [FeCl3·6H2O] and 0.5 M nickel chloride [NiCl2·6H2O] aqueous mixed solution (10 mL each) with potassium borohydride. The Ni–B sample was prepared by reducing 10 mL of a 0.5 M nickel chloride [NiCl2·6H2O] aqueous solution with potassium borohydride.2.2 Catalyst characterization
The morphologies of the Ni–Fe–B samples were characterized by transmission electron microscopy (TEM, JEOL, JEM-2100). The quantitative chemical compositions of catalysts were determined with energy-dispersive X-ray spectroscopy (EDX, Genesis Spectrum, 200 kV). The structures of the catalysts were analyzed by X-ray diffraction (XRD, Rigaku, D/max 2500PC) with Cu Kα radiation (γ = 1.5418 Å) in the 2θ range of 10–80. X-ray photoelectron spectroscopy (XPS, Perkin, PHI-1600 ESCA) measurements were recorded with a spectrophotometer using a Mg X-ray (hν = 1253.6 eV) source for excitation; the binding energy (BE) values were calibrated using C 1s = 284.6 eV as a reference. Hydrogen temperature-programmed desorption (H2-TPD) measurements were performed on a TP-5076 instrument (Tianjin Xianquan Instrument Co. Ltd., China). The BET surface area was measured using a surface area analyzer (Quantachrome Instruments, Autosord-IQ).2.3 Hydrolysis of NaBH4 measurements
Water displacement method was used to measure the rate of hydrogen generation.8,9 The reaction was carried out in a glass reactor equipped with thermostatic bath. Then, a flask filled with water was connected to the reaction chamber to measure the volume of hydrogen gas to be evolved from the reaction. Typically, the hydrolytic dehydrogenation of NaBH4 was determined at 313 K. NaBH4 (1 wt%) and NaOH (2 wt%) were mixed in a reactor containing 10 mL of water and 10 mg of catalyst. The reaction was started by closing the reactor. The volume of hydrogen gas evolved was measured by recording the displacement of the reactor's water level. During the reaction process, a wet gas meter was used to measure the cumulative volume of the hydrogen generation rate (mL min−1). The experiments were performed using a stirring speed of 500 rpm to exclude external mass-transfer limitations. To study the effect of the reaction temperature on the reaction rate, NaBH4 hydrolysis was performed at different temperatures (303, 308, 313, and 318 K).3. Results and discussion
3.1 Characterization of catalysts
Fig. 2 shows TEM micrographs of the Ni–Fe–B samples. As shown in Fig. 2a, the Ni–Fe–B-c sample spontaneously formed chain structures because of their magnetism. The specific surface area of the Ni–Fe–B-c sample was 52.9 m2 g−1.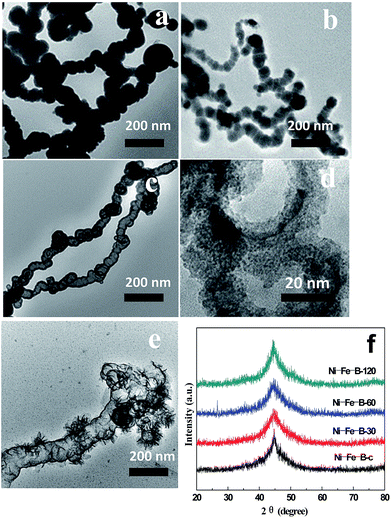 | ||
| Fig. 2 TEM images of (a) Ni–Fe–B-c, (b) Ni–Fe–B-30, (c) Ni–Fe–B-60, (d) Ni–Fe–B-60 at higher magnification, (e) Ni–Fe–B-120, and (f) XRD patterns of Ni–Fe–B samples. | ||
A highly energetic galvanic replacement reaction took place immediately upon the addition of an aqueous NiCl2 solution to the aqueous suspension of Fe–B nanochains, which is based on the reduction potentials39 according to the following equations:
| Ni2+(aq) + 2e− → Ni(s), −0.25 V vs. SHE | (2) |
| Fe(s) → Fe2+(aq) + 2e+, −0.44 V vs. SHE | (3) |
| Fe(s) + Ni2+(aq) → Fe2+(aq) + Ni | (4) |
As a result, Fe atoms were oxidized and incorporated into the solution, leading to the formation of loose Ni–Fe–B-30 in the sample. Simultaneously, the electrons migrate quickly to the surface of the nanoparticle and were captured by Ni2+ ions, generating Ni atoms on the Fe–B surface via reduction. The specific surface area of the Ni–Fe–B-30 sample was 85.5 m2 g−1 (Fig. 2b). Further dealloying (Ni–Fe–B-60) resulted in larger holes, producing hollow nanochain showing (Fig. 2c and d) a maximum specific surface area of 118.6 m2 g−1. As shown in Fig. 2e, Ni–Fe–B-120 showed disintegrated hollow structures which were subsequently reassembled, resulting in a material with less surface area (74.8 m2 g−1). By increasing the replacement reaction time, the structure of the Ni–Fe–B samples became increasingly loose, producing materials with higher specific surface areas. After 120 min of reaction, the hollow nanochain structures disappeared, decreasing the specific surface areas. Fig. 2f shows the XRD spectra of the Ni–Fe–B samples. Only one broad peak, at a 2q of 45°, was observed, this pattern being characteristic of anamorphous structure and in line with previous results on Ni–Fe–B amorphous alloys.16
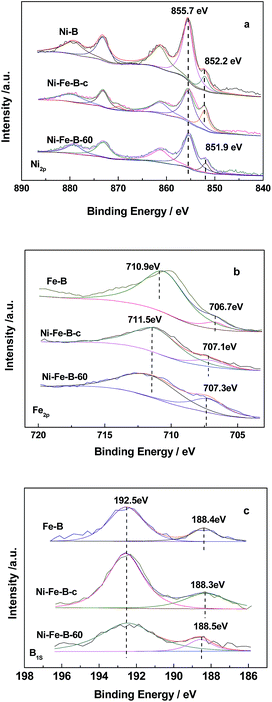
Fig. 3 shows the XPS analysis of the catalysts. Fig. 3a shows the Ni spectra of the catalysts, with two peaks in the Ni2p3/2 level being observed for Fe–B, Ni–B, Ni–Fe–B-c, and Ni–Fe–B-60. These results indicated that Ni was present in both elemental and oxidized states, the latter of which resulted from partial oxidation reactions during sample preparation before XPS measurements.40 The binding energy (BE) of the elemental nickel for both of Ni–B and Ni–Fe–B-c catalysts were 852.2 eV. Compared to the BE of the elemental nickel with that of Ni–B and Ni–Fe–B-c catalysts, there is negative shift of 0.3 eV for the Ni–Fe–B-60 (851.9 eV). Two peaks were also observed for the Fe2p3/2 level in the Fe–B, Ni–Fe–B-c, and Ni–Fe–B-60 samples (Fig. 3b). In the case of Fe–B, the peaks at BE values of 706.7 and 710.9 eV were representative of elemental and oxidized iron species, respectively. These two peaks were shifted to higher BE values (by 0.4 and 0.6 eV) for the Ni–Fe–B-c sample as compared to that of Fe–B, which are related to the electron transfer from Fe to Ni. In the case of the Ni–Fe–B-60 sample, these values were both shifted to higher values by 0.6 eV. As shown in Fig. 3c, two peaks were observed for the B1s level in all the cases and ascribed to elemental and oxidized boron species. The BE values of elemental B in Fe–B (188.4 eV), Ni–Fe–B-c (188.3 eV), and Ni–Fe–B-60 (188.5 eV) were shifted to higher values than pure amorphous B (187.1 eV),30 indicating some electron transfer from the alloyed B to the metal (Ni or Fe) in all samples. The BE values of elemental B and Fe for the Ni–Fe–B-60 sample were higher than those of Ni–Fe–B-c. These results suggested that more electrons transfer from B and Fe to Ni in the Ni–Fe–B-60 sample, which caused the BE of the elemental nickel to undergo a negative shift. Specifically, there were more electron-enriched Ni active sites on the surfaces of the Ni–Fe–B-60 sample.
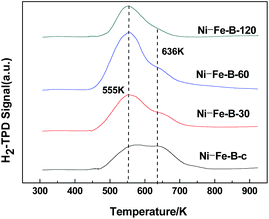
Fig. 4 shows the H2-TPD spectra exhibited two peaks at 555 K and 636 K in all cases, indicating the presence of two adsorption sites on the surface of the samples. The area of the peak at higher temperature decreased significantly with the duration of the replacement reaction. The active sites on the surface of the catalysts tended to be uniform. The Ni–Fe–B-60 sample showed a significantly larger peak area at 555 K compared to the other peak, revealing more uniform distribution of Ni active sites compared to the rest of the Ni–Fe–B samples.
3.2 Catalytic hydrolysis reaction of sodium borohydride
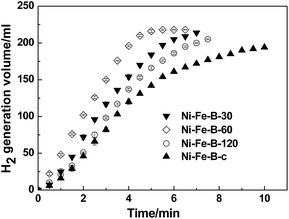
The above characterizations imply that the as-synthesized Ni–Fe–B-60 sample may be catalytically active for the NaBH4 hydrolysis reaction. Therefore, we further compared the catalytic properties of four different catalysts (Ni–Fe–B-c, Ni–Fe–B-30, Ni–Fe–B-60, and Ni–Fe–B-120 at 313 K) in Fig. 5. The H2 generation rate of all catalysts first increased until reaching a maximum, then decreased, revealing an order of the reaction kinetic different than zero. Ni–Fe–B-60 showed the best catalytic performance towards the NaBH4 hydrolysis reaction, with a maximum hydrogen generation rate of 4320 mL min−1 gcat−1. The hydrogen generation rates for the rest of the catalysts are presented in Table 1.| Catalyst | Maximum hydrogen generation rate (mL min−1 g−1 catalyst) |
|---|---|
| a Hydrolysis was carried out using NaBH4 (1 wt%) and NaOH (2 wt%) solution by 10 mg catalyst. | |
| Ni–Fe–B-c | 1940 |
| Ni–Fe–B-30 | 2734 |
| Ni–Fe–B-60 | 4320 |
| Ni–Fe–B-120 | 3058 |
The high catalytic activity of Ni–Fe–B-60 can be explained by three main factors: (i) the hollow structure of the Ni–Fe–B-60 nanochain, (ii) enhanced adsorption of BH4− on electron-enriched Ni active sites, and (iii) hydrogen spillover on Fe. A hollow structure with a larger specific surface area facilitated the catalytic reaction. Most of the Ni generated by a galvanic replacement that avoided agglomeration was on the Fe–B surface and completely exposed for catalytic reaction, as presented in Fig. 1 and 2. Fe showed low catalytic activity for the hydrolysis of the NaBH4 solution.21 The active sites in the Ni–Fe–B catalysts are Ni. The large number of uniform electron-enriched Ni active sites deposited on the surface of Ni–Fe–B-60 can be explained by the electron transfer from B and Fe to Ni, as analysis in XPS and H2-TPD.
Currently, it is generally accepted that metal (M)-catalyzed hydrolysis of NaBH4 involves the dissociative chemisorption of BH4− on the catalyst surface as the first kinetic step.41–45 Because of this, our experiments showed enhanced adsorption of the BH4− species on electron-enriched Ni active sites on the Ni–Fe–B-60 surface. BH4− then dissociates to form Ni–BH3− and Ni–H intermediates. According to Holbrook and Twist,46 Ni–BH3− subsequently reacts with H2O, possibly via a BH3 intermediate, to generate another Ni–H species and BH3(OH)−, as presented in eqn (5)–(8).
| 2Ni + BH4− ⇄ Ni–BH3− + Ni–H | (5) |
| Ni–BH3− ⇄ BH3 + Ni×e− | (6) |
| Ni×e− + H2O → Ni–H + OH− | (7) |
| BH3 + OH− → BH3(OH)− | (8) |
The former undergoes stepwise replacement of B–H bonds by B–OH− bonds and finally yields Ni–B(OH)3−, as presented in eqn (9)–(11); the latter combines with two Ni–H to yield H2 and to regenerate the active sites, as presented in eqn (12).
| 2Ni + BH3(OH)− → Ni–BH2(OH)− + Ni–H | (9) |
| 2Ni + BH2(OH)2− → Ni–BH(OH)2− + Ni–H | (10) |
| 2Ni + BH(OH)2− → Ni–B(OH)3− + Ni–H | (11) |
| Ni–H + Ni–H → Ni–H2 + Ni | (12) |
Obviously, the adsorption of H2 was also enhanced for electron-enriched Ni active sites. During the hydrolysis reaction, H2 agglomeration and coverage of the active sites could block the formation of new active sites for continuous adsorption of the BH4− and H2O species. Here, Fe could prompt hydrogen spillover from the system (eqn (13) to (14)) and facilitate the formation of new active sites for adsorption of the BH4− species, which was consistent with other studies.36
| Ni–H2 + Fe → Fe–H2 + Ni | (13) |
| Fe–H2 → Fe + H2 | (14) |
Most importantly, the catalytic hydrolysis process involves not only surface reactions but also the diffusion and release of hydrogen in the metal catalysts. Ni–Fe–B-60 has a well-dispersed Ni atomic cluster with optimal content on the surface of Fe–B, prepared using the galvanic replacement method, which could produce a better synergetic effect than the catalysts produced by the chemical reduction of Fe and Ni ions. The Ni/(Ni + Fe) molar ratios for the Ni–Fe–B-30, Ni–Fe–B-60, and Ni–Fe–B-120 catalysts were 0.31, 0.51, and 0.78, respectively, as determined by EDX (ESI, Fig. S1†). When the content of Ni exceeded a certain amount (Ni–Fe–B-120), the synergetic effect was weakened due to the decrease of the relative amount of Fe, resulting in a decline in catalytic activity.
3.3 Intrinsic kinetic study
NaBH4 hydrolysis reactions follow very complicated mechanisms when catalyzed by heterogeneous catalysts. It is of great significance to investigate the kinetics of the NaBH4 hydrolysis reaction since it can provide useful information about the role of many experimental factors affecting the hydrogen generation rate.7,22 So, it is necessary to study the kinetic properties of NaBH4 hydrolyzed by Ni–Fe–B-60. During the NaBH4 hydrolysis, the solution temperature, the amount of catalyst, and the concentrations of NaOH and NaBH4 determine the reaction rate.47 The hydrogen generation rate equation can be expressed as:
 | (15) |
The kinetics for the hydrolysis of NaBH4 depends on the performance of the catalysts. Kinetic studies at different temperatures were performed using the optimized solution conditions described above (i.e., 1 wt% NaBH4 + 2 wt% NaOH and 10 mg Ni–Fe–B-60). Fig. 6a depicts the hydrogen generation rates from 303 to 318 K. The reaction rate increased significantly with temperature. The inset Arrhenius plot of ln(r) is plotted against the reciprocal of the absolute temperature (1/T). From the slope of the straight line, Ea was calculated to be 33.7 kJ mol−1. Hydrogen generation properties for the hydrolysis of NaBH4 catalyzed by various reported catalysts are displayed in Table 2. As shown, our obtained Ea value was lower than that of previously reported catalysts, such as Ni–Fe–B,33 Co–B@Ni/RGO,45 and plasma treated Co–B–P,48 but it was higher than that of Co–Fe–B,19 p(AAGA)-Co,24 p(AAc)-Co25 and Cu–Co.49 The hydrogen generation rate of the hollow Ni–Fe–B nanochain catalyst is higher than most of the other catalysts listed in Table 2, except for Co–W–P/γ-Al2O3 (ref. 27) and Co–Ni–Mo–P/γ-Al2O3.28
 | ||
| Fig. 6 Effects of temperature (a), NaOH concentration (b), amount of catalyst (c), and NaBH4 concentration (d) on NaBH4 hydrolysis using the Ni–Fe–B-60 catalyst. | ||
| Catalyst | Morphology | BET surface (m2 gcat−1) | Remaining activity | Activation energy (kJ mol−1) | Hydrogen generation rate (mL min−1 gcat−1) | Reference |
|---|---|---|---|---|---|---|
| a —, Not reported or no detailed data are available. | ||||||
| Ni–Co/r-GO | Particle | — | 53.5% after 5 cycles | 55.12 | 1280 | 6 |
| Co–Fe–B | Particle | 128.3 | — | 29.09 | 4310 | 19 |
| Cu–Fe–B | Nanosheet | 186.7 | 75% after 3 cycles | 57 | — | 22 |
| Ni–Fe–B | Particle | — | — | 57 | 2910 | 33 |
| Co–B@Ni/RGO | Particle | — | 95% after 3 cycles | 44.1 | — | 45 |
| Plasma treated Co–B–P | Particle | 38.29 | — | 49.11 | 3976 | 50 |
| Cu–Co | 3D foam-like | — | ∼75% after 5 cycles | 13.9 | 3300 | 49 |
| Ni–Co–B | Particle | 17.07 | — | — | 708 | 54 |
| p(HEMA)-Co | Porous | — | 57.72% after 5 cycles | 37.01 | 1596 | 26 |
| p(AAGA)-Co | Porous | — | 95% after 7 cycles | 26.62 | 3019 | 24 |
| Co–Ni–Mo–P/γ-Al2O3 | Particle | — | 80% after 5 cycles | 52.43 | 13![[thin space (1/6-em)]](https://www.rsc.org/images/entities/char_2009.gif) 842 842 |
28 |
| Co–W–P/γ-Al2O3 | Particle | 67% after 6 cycles | 49.58 | 11![[thin space (1/6-em)]](https://www.rsc.org/images/entities/char_2009.gif) 820 820 |
27 | |
| Ni–Fe–B-60 | Hollow nanochain | 118.6 | 90% after 5 cycles | 33.7 | 4320 | This study |
The hydrolysis of NaBH4 is affected by the NaOH concentration.22,33 To hinder NaBH4 self-hydrolysis, NaOH is often added to NaBH4 solutions as a stabilizer. The hydrolytic reaction at ambient temperatures is greatly accelerated upon addition of catalysts. Fig. 6b shows the effects of the NaOH concentration on the reaction rate at 313 K in a 1 wt% NaBH4 solution and 10 mg of catalyst. The variation in NaOH was 1, 2, 5 and 10 wt%. The results show the hydrogen generation rate decreased gradually with increasing NaOH concentrations. At a low NaOH concentration of 1 wt%, the reaction rate was quite fast, and the hydrogen production process completed within 4 min. When the NaOH concentration increased to 10 wt%, the hydrogen production rate reduced drastically, extending the whole reaction process to 15 min, more than 4 times as much time as when 1 wt% NaOH was used. The ln(r) versus ln(NaOH concentration) in the inset of Fig. 6b shows that the slope of the straight line was −0.58, confirming NaOH had a negative effect on the hydrogen generation rate. This is consistent with previous reports on Ni- and Co-based catalysts.33,50,51 Excessive concentration of NaOH reduces the solubility of NaBO2, and then the active sites are blocked by the precipitation of NaBO2 on the surface of the catalyst. Moreover, the high viscosity and stability of NaBH4 at high pH values are also responsible for the observed decrease in activity.52–54
The effect of varying catalyst loadings (5, 10, 15 and 20 mg) on the hydrogen generation rate was determined. As shown in Fig. 6c, the hydrogen generation rate increased with the amount of Ni–Fe–B-60 catalyst, indicating that the hydrogen generation rate can be controlled by varying the catalyst loading. In addition, the ln(r) versus ln(catalyst amount) is plotted in the inset of Fig. 6c, from which we can see the ln(r) changed almost linearly with the ln(catalyst amount) with the slope of the straight line being 0.74.
NaBH4 is the hydrogen source in the hydrolysis reaction, so its concentration is the crucial factor that determines the kinetics of the reaction. Therefore, the effect of NaBH4 concentration on the hydrogen generation rate was further studied using NaBH4 at different concentrations (0.2, 0.5, 1.0, 2.0 and 5.0 wt%). Fig. 6d shows the hydrogen generation curves with the concentration of NaBH4 varied from 0.2 wt% to 5.0 wt%. The hydrogen generation rate increased significantly when the concentration of NaBH4 increased from 0.2 wt% to 2 wt%. However, when the NaBH4 concentration further increased to 5 wt%, the hydrogen generation rate dropped remarkably. Hence, only the experiments with NaBH4 concentrations less than 5 wt% were used to determine the reaction order in the inset of Fig. 6d, where the slope was 0.44. This is consistent with previous reports on Ni- or Co-based catalysts.22,47
According to the above investigations, the activation energy and the x, y and z factors for the NaBH4 hydrolysis reaction were obtained, and the final overall kinetic equation with the concentration of NaBH4 less than 10 wt% can be expressed as:
 | (16) |
The results could provide valuable information to design a possible reactor for practical applications.
One of the limiting factors for the application of the catalyst is deactivation. To investigate the stability of the catalyst, the reusability of Ni–Fe–B-60 was tested. In our study, we used 10 mg of catalyst per 1 wt% of NaBH4 with respect to H2O (10 mL, i.e., 2 wt% NaOH). The experiment was conducted five times. After the reaction, the Ni–Fe–B-60 catalysts were separated by filtration. Since Fe and Ni are magnetic, the catalyst is easy to separate from the reaction solution, as illustrated by the magnetic strip in Fig. S2.† Then the catalyst was washed with distilled water and dried in a vacuum oven at 333 K before being reused for the next run. The results are depicted in Fig. 7. The catalytic activity of Ni–Fe–B-60 catalysts for the hydrolysis of NaBH4 did not decrease significantly after five runs, which demonstrated that the catalyst was stable in this system.
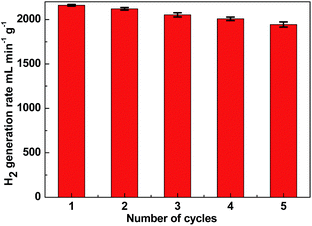 | ||
| Fig. 7 Hydrogen generation rate of Ni–Fe–B-60 reusability test of catalyst (10 mg) in successive five cycles. | ||
4. Conclusions
In summary, Ni–Fe–B catalysts were facile synthesized by a galvanic replacement method. The catalytic activity was proved to be correlated to the length of time of the replacement reactions. When the replacement time was 60 min, the as-prepared Ni–Fe–B-60 catalyst with a hollow nanochain structure presented the largest surface area and the highest catalytic activity toward hydrogen generation. The experimental studies have revealed that the optimized hydrogen generation performance of the Ni–Fe–B-60 can be explained by the structural effect of the hollow nanochain, the electron effect of electron-enriched Ni active sites, and hydrogen spillover on Fe. Additionally, the overall kinetics of the NaBH4 hydrolysis reaction catalyzed by the hollow Ni–Fe–B nanochain catalyst was obtained by a series of experiments. The reusability and separation tests for the hollow Ni–Fe–B nanochain catalyst confirmed that most of the materials' original activity was preserved after five consecutive runs. Thus, the hollow Ni–Fe–B nanochain would be promising catalyst for the generation of hydrogen from hydrides of NaBH4.Conflicts of interest
There are no conflicts to declare.Acknowledgements
The authors gratefully acknowledge the Natural Science Foundation of Hebei Province (B2018208188), the Science and Technology Projects for Returned Scholars of Hebei Province, China (No. CL201610).Notes and references
- H. Lee, J. W. Lee, D. Y. Kim, J. Park, Y. T. Seo, H. Zeng, I. L. Moudrakovski, C. I. Ratcliffe and J. A. Ripmeester, Nature, 2005, 434, 743–746 CrossRef PubMed
.
- L. Schlapbach and A. Zuttel, Nature, 2001, 414, 353–358 CrossRef PubMed
.
- L. Barreto, A. Makihira and K. Riahi, Int. J. Hydrogen Energy, 2003, 28, 267–284 CrossRef
.
- L. H. Jepsen, M. B. Ley, Y. S. Lee, Y. W. Cho, M. Dornheim and J. O. Jensen, Mater. Today, 2014, 17, 129–135 CrossRef
.
- D. G. Tong, X. L. Zeng, W. Chu, D. Wang and P. Wu, J. Mater. Sci., 2010, 45, 2862–2867 CrossRef
.
- F. H. Wang, Y. N. Wang, Y. J. Zhang, Y. M. Luo and H. Zhu, J. Mater. Sci., 2018, 53, 6831–6841 CrossRef
.
- W. Chen, L. Z. Ouyang, J. W. Liu, X. D. Yao, H. Wang, Z. W. Liu and M. Zhu, J. Power Sources, 2017, 359, 400–407 CrossRef
.
- M. Paladini, G. M. Arzac, V. Godinho, D. Hufschmidt, M. C. JiménezdeHaro, A. M. Beltrán and A. Fernández, Appl. Catal. B., 2017, 210, 342–351 CrossRef
.
- Z. Wu, X. Mao, Q. Zi, R. Zhang, T. Dou and A. C. K. Yip, J. Power Sources, 2014, 268, 596–603 CrossRef
.
- O. Akdim, U. B. Demirci and P. Miele, Int. J. Hydrogen Energy, 2009, 34, 9444–9449 CrossRef
.
- J. S. Zhang, W. N. Delgass, T. S. Fisher and J. P. Gore, J. Power Sources, 2007, 164, 772–781 CrossRef
.
- C. L. Hsueh, C. Y. Chen, J. R. Ku, S. F. Tsai, Y. Y. Hsu and F. Tsau, J. Power Sources, 2008, 177, 485–492 CrossRef
.
- Ö. Şahin, D. Kılınç and C. Saka, J. Energy Inst., 2016, 89(2), 182–189 CrossRef
.
- Z. Liu, B. Guo, S. H. Chan, E. H. Tang and L. Hong, J. Power Sources, 2008, 176, 306–311 CrossRef
.
- S. Yamakawa, R. Asahi and T. Koyama, Surf. Sci., 2014, 622, 65–70 CrossRef
.
- O. Song I, J.-M. Yan, H.-L. Wang, Z.-L. Wang and Q. Jiang, Int. J. Hydrogen Energy, 2014, 39, 3755–3761 CrossRef
.
- B. Lim, M. Jiang, P. H. C. Camargo, E. C. Cho, J. Tao, X. Lu, Y. Zhu and Y. Xia, Science, 2009, 324, 1302–1305 CrossRef PubMed
.
- H. Kahri, V. Flaud, R. Touati, P. Miele and U. B. Demirci, RSC Adv., 2016, 6, 102498–102503 RSC
.
- Y. P. Wang, Y. J. Wang, Q. L. Ren, L. Li, L. F. Jiao, D. W. Song, G. Liu, Y. Han and H. T. Yuan, Fuel Cells, 2010, 10, 132–138 Search PubMed
.
- R. Fernandes, N. Patel and A. Miotello, Appl. Catal., B, 2009, 92, 68–74 CrossRef
.
- M. Paladini, V. Godinho, G. M. Arzac, M. C. Jiménez de Haro, A. M. Beltrán and A. Fernández, RSC Adv., 2016, 6, 108611–108620 RSC
.
- H. L. Mohammad, F. S. Abdollah and K. Morteza, Energy, 2017, 126, 830–840 CrossRef
.
- O. Akdim, U. B. Demirci, A. Brioude and P. Miele, Int. J. Hydrogen Energy, 2009, 34, 5417–5421 CrossRef
.
- N. Sahiner, S. Butun and T. Turhan, Chem. Eng. Sci., 2012, 82, 114–120 CrossRef
.
- N. Sahiner and F. Seven, Energy, 2014, 71, 170–179 CrossRef
.
- F. Seven and N. Sahiner, Int. J. Hydrogen Energy, 2014, 39, 15455–15463 CrossRef
.
- L. N. Wang, Z. Li, X. Liu, P. P. Zhang and G. W. Xie, Int. J. Hydrogen Energy, 2015, 40, 7965–7973 CrossRef
.
- L. N. Wang, Z. Li, P. P. Zhang, G. X. Wang and G. W. Xie, Int. J. Hydrogen Energy, 2016, 41, 1468–1476 CrossRef
.
- Z. Li, L. Wang, Y. Zhang and G. W. Xie, Int. J. Hydrogen Energy, 2017, 42, 5749–5757 CrossRef
.
- Y. J. Hou, J. Guo, B. Li, Y. Q. Wang, Y. X. Cai and Z. H. Zhou, J. Nanosci. Nanotechnol., 2014, 14, 7319–7324 CrossRef PubMed
.
- J. Guo, Y. J. Hou, C. H. Yang, Y. Q. Wang and L. N. Wang, Mater. Lett., 2012, 67, 151–153 CrossRef
.
- J. Guo, Y. J. Hou, C. H. Yang, Y. Q. Wang, H. Q. He and W. Li, Catal. Commun., 2011, 16, 86–89 CrossRef
.
- M. Nie, Y. C. Zou, Y. M. Huang and J. Q. Wang, Int. J. Hydrogen Energy, 2012, 37, 1568–1576 CrossRef
.
- X. H. Xia, Y. Wang, R. Aleksey and Y. N. Xia, Materials, 2013, 1–20 Search PubMed
.
- Y. Sun and Y. Xia, J. Am. Chem. Soc., 2004, 126, 3892–3901 CrossRef PubMed
.
- J. Y. Chen, M. M. Joseph, S. Andrew, Y. J. Xiong, Z. Y. Li and Y. N. Xia, J. Am. Chem. Soc., 2006, 128(46), 14776–14777 CrossRef PubMed
.
- X. Lu, L. Au, J. McLellan, Z.-Y. Li, M. Marquez and Y. Xia, Nano Lett., 2007, 7, 1764–1769 CrossRef PubMed
.
- Y. J. Hu, Q. Shao, P. Wu, H. Zhang and C. X. Cai, Electrochem. Commun., 2012, 18, 96–99 CrossRef
.
- J. P. Hoare, Standard Potentials in Aqueous Solution, Marcel Dekker, New York, 1985 Search PubMed
.
- Y. Chen, Catal. Today, 1998, 44, 3–16 CrossRef
.
- R. Retnamma, A. Q. Novais and C. M. Rangel, Int. J. Hydrogen Energy, 2011, 36, 9772–9790 CrossRef
.
- H. B. Dai, Y. Liang and P. Wang, Catal. Today, 2011, 170, 27–32 CrossRef
.
- O. V. Netskina, D. I. Kochubey, I. P. Prosvirin, D. G. Kellerman, I. V. Simagina and O. V. Komova, J. Mol. Catal. A: Chem., 2014, 390, 125–132 CrossRef
.
- H. B. Dai, Y. Liang, L. P. Ma and P. Wang, J. Phys. Chem. C, 2008, 112, 15886–15892 CrossRef
.
- K. Rahul, M. F. Diana, D. Catarina, V. Joao and F. Cristina, Int. J. Hydrogen Energy, 2016, 41, 11498–11509 CrossRef
.
- K. A. Holbrook and P. J. Twist, J. Chem. Soc. A, 1971, 15, 890–894 RSC
.
- X. Zhang, Z. H. Wei, Q. J. Guo and H. J. Tian, J. Power Sources, 2013, 231, 190–196 CrossRef
.
- Ö. Şahin, D. E. Karakaş, M. Kaya and C. Saka, J. Energy Inst., 2017, 90, 466–475 CrossRef
.
- S. Eugenio, U. B. Demirci, T. M. Silva, M. J. Carmezim and M. F. Montemor, Int. J. Hydrogen Energy, 2016, 41, 8438–8448 CrossRef
.
- J. Wang, D. D. Ke, Y. Li, H. M. Zhang, C. X. Wang, X. Zhao, Y. J. Yuan and S. M. Han, Mater. Res. Bull., 2017, 95, 204–210 CrossRef
.
- W. L. Dai, M. H. Qiao and J. F. Deng, Appl. Surf. Sci., 1997, 120, 119 CrossRef
.
- R. Retnamma, A. Q. Novais and C. M. Rangel, Int. J. Hydrogen Energy, 2011, 36, 9772–9790 CrossRef
.
- S. Saha, V. Basak, A. Dasgupta, S. Ganguly, D. Banerjee and K. Kargupta, Int. J. Hydrogen Energy, 2014, 39, 11566–11577 CrossRef
.
- C. Wu, Y. Bai, D. X. Liu, F. Wu, M. L. Pang and B. L. Yi, Catal. Today, 2011, 170, 33–39 CrossRef
.
Footnote |
| † Electronic supplementary information (ESI) available. See DOI: 10.1039/c8ra03848a |
| This journal is © The Royal Society of Chemistry 2018 |

