DOI:
10.1039/C8RA03492C
(Paper)
RSC Adv., 2018,
8, 20852-20861
A polymer microsphere emulsion as a high-performance shale stabilizer for water-based drilling fluids
Received
23rd April 2018
, Accepted 24th May 2018
First published on 7th June 2018
Abstract
Interest in using nanomaterials to improve shale stability during drilling operations has been increasing. Herein, a polymer microsphere emulsion (PME) as a high-performance shale stabilizer for water-based drilling fluids (WDFs) was prepared via emulsion polymerization. The particle sizes in PME in aqueous solution ranged from 90 to 320 nm. PME was found to exhibit excellent salt tolerance and temperature resistance. The plugging performance of PME was tested through pressure transmission tests. The results indicated that the polymer microspheres in PME could effectively plug shale pores and reduce shale permeability. In addition, rolling recovery tests were used to evaluate the shale hydration inhibition performance of PME. It was found that PME showed great performance for decreasing shale hydration potential. These factors make PME a promising shale stabilizer for WDFs used to drill shale formations.
1. Introduction
Drilling fluids are known as “blood” in oil and gas drilling engineering. They have a variety of functions, such as transporting and suspending rock cuttings, balancing formation pressure, preventing wellbore collapse, and cooling and lubricating drilling bits.1–4 Based on their composition, drilling fluids are divided into three categories: water-based drilling fluids (WDFs); oil-based drilling fluids; and synthetic-based drilling fluids. Among these, WDFs are considered the drilling fluids with the most potential, because of their environmental friendliness, low cost and convenient preparation.5,6
In recent years, shale gas developments have played an important role in China and received increasing interest in some other countries.7–10 In drilling engineering, shale instability has always been a challenging and costly issue.11–13 Drilling shale formations with traditional WDFs may lead to series problems, such as wellbore collapse, tight holes, stuck pipes, and lost circulation.14,15 In contrast to traditional reservoirs, shale reservoirs possess specific physicochemical features. They are regarded as having low porosity and ultra-low permeability because they contain numerous micro- and nano-scale pores and cracks.16,17 During drilling in shale formations, pressure transmission in WDFs will cause an increase in pore pressure, thus resulting in shale instability.18–20 Therefore, the best possible approach to maintaining shale stability is to effectively seal the micro- and nano-scale pores and cracks that develop in shale formations.21,22 Therefore, a plugging agent of suitable size to obtain better sealing performance with WDFs is required. Recently, various nano-plugging materials have been introduced into WDFs, such as silica nanoparticles, graphite and polymer latex.18,23–25 Non-modified silica nanoparticles were first used as plugging agents in WDFs, and they could dramatically reduce the invasion of water into shale.26 However, they easily aggregate and it is difficult to achieve nano-plugging performance with them. To improve the dispersion stability of pure nanoparticles, some researchers performed a series of experimental studies and the nano-plugging effects were significantly enhanced.27–29 But little research has related to the dispersion stability of modified nanoparticles at high salt concentrations and high temperatures, which is essential for nanoparticles being applied in the field. In addition, shale is mainly composed of clay minerals and is thus water-sensitive. Water–shale interactions may result in shale swelling and dispersion.30,31 Hence, improving the shale hydration inhibition of WDFs is also the goal of researchers. Consequently, hunting for a novel high-performance shale stabilizer in combination with achieving plugging and hydration inhibition properties is a more valuable research issue.
In this study, a polymer microsphere emulsion was introduced into WDFs as a high-performance shale stabilizer. A nano-polymer microsphere emulsion was prepared via the emulsion polymerization of styrene (St), n-butyl acrylate (BA) and 2-acrylamide-2-methylpropanesulfonic acid (AMPS). In this polymer, St and BA units act as hydrophobic groups. AMPS units act as hydrophilic groups to improve the dispersion stability of polymer microspheres in WDFs. In addition, the presence of emulsifiers can not only improve the dispersion stability of nanoparticles, but can also decrease the surface tension and thus reduce capillary effects.32 A low amount of water-intake will be also beneficial for decreasing the shale hydration potential. The novel polymer microsphere emulsion was found to exhibit high salt tolerance and temperature resistance. Furthermore, the polymer microsphere emulsion carried out the dual roles of physical plugging and shale hydration inhibition.
2. Experimental
2.1 Materials
St (99%), BA (98%), NaOH (96%), NaCl (99.5%), CaCl2 (96%), KCl (99.5%), sodium dodecyl sulfate (SDS), and potassium persulfate (KPS, 99%) were provided by Sinopharm Chemical Corporation (Shanghai, China) and used without further purification. AMPS (98%), SiO2 nanoparticles (99.8%, 7–40 nm), and octylphenol polyoxyethylene ether (OP-10, 99%) were purchased from Aladdin Industrial Corporation (Shanghai, China). Polymeric alcohol (JHC) was obtained from China Oilfield Services (Sanhe, China). The shale samples used for the testing of plugging properties were kindly provided by Zhejiang oilfield, and the mineral content of the shale is shown in Table 1. The shale samples used for hydration inhibition performance testing were provided by Turpan Hami Basin, China, and the average concentration of different minerals is presented in Table 2.
Table 1 Mineral content of the shale samples used for plugging properties tests
| Component |
Content (wt%) |
Component of clay mineral |
Content (wt%) |
| Quartz |
50 |
Illite |
45 |
| Pyrite |
2 |
Chlorite |
24 |
| Siderite |
2 |
Illite/smectite mixed layer |
31 |
| Plagioclase |
15 |
|
|
| Clay mineral |
31 |
|
|
Table 2 Mineral content of the shale samples used for hydration inhibition performance tests
| Component |
Content (wt%) |
Component of clay mineral |
Content (wt%) |
| Quartz |
20 |
Illite |
12 |
| Calcite |
28 |
Chlorite |
3 |
| Plagioclase |
29 |
Kaolinite |
3 |
| Iron dolomite |
2 |
Illite/smectite mixed layer |
82 |
| Potassium feldspar |
6 |
|
|
| Clay mineral |
15 |
|
|
2.2 Preparation of the poly(St–BA–AMPS) microsphere emulsion
A poly(St–BA–AMPS) microsphere emulsion was prepared through emulsion polymerization. Fig. 1 shows a schematic diagram of the emulsion polymerization system. A 2.4 g amount of AMPS was dissolved in 55 mL of distilled water, and NaOH was used to adjust the pH value to about 6. The emulsifiers SDS (0.6 g) and OP-10 (0.6 g) were added to the solution under stirring. After the emulsifiers were dissolved in the solution, the mixture was transferred to a four-neck flask and stirred with a mechanical stirrer. The monomers St (28 g) and BA (12 g) were added into the mixture under vigorous stirring to prepare the pre-emulsion. Then, KPS was introduced into the reactor to initiate the reaction. The emulsion polymerization system was maintained at 80 °C for 4 h to obtain the polymer microsphere emulsion product, named PME.
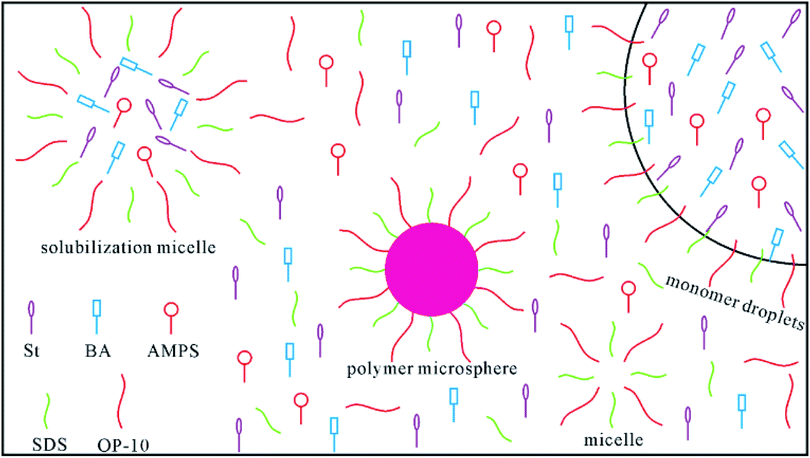 |
| | Fig. 1 A schematic diagram of the emulsion polymerization system. | |
2.3 Characterization
2.3.1 Instrumentation and characterization. The infrared spectrum of PME was obtained with a Fourier transform infrared spectrometer (FT-IR, Nicolet 6700, U.S.A.). The 1H-NMR spectrum of PME was measured with nuclear magnetic resonance apparatus (1H-NMR, Bruker AV500, Germany), and CDCl3 was used as the solvent. The structure and morphology of PME in aqueous solution were observed using a transmission electron microscope (TEM, JEM-2100UHR, Japan). The particle size distribution of PME was determined via dynamic light scattering using a nanoparticle size analyzer (PSD, NanoBrook Omni, U.S.A.). Thermogravimetric analysis of PME was conducted using a TGA/DTA thermal analyzer (TGA, NETZSCH 209F3, Germany) under a N2 atmosphere at a heating rate of 10 °C min−1.
2.3.2 Salt tolerance of PME. In order to investigate the dispersion stability of PME in NaCl and CaCl2 solutions of different concentrations, particle size distribution tests were carried out. Briefly, PME was dispersed in NaCl aqueous solutions with concentrations of 0, 5, 10, 15 and 20 wt%. After 16 h, photographs were taken to record the coagulation behaviours of PME in the aqueous solutions. In addition, the particle size distributions of PME in the solutions were also tested to further analyse the dispersion stability. The above method was also used to investigate the dispersion stability of PME in CaCl2 solutions with concentrations of 0, 1, 2, 3 and 4 wt%.
2.3.3 Temperature resistance of PME. PME was dispersed into aqueous solutions, and the concentration of PME in solution was fixed at 1 wt%. Then, the solutions were poured into sealed tanks, and they were placed into an XGRL-4 type rolling oven (Haitongda Company, China) for 16 h at a certain temperature. In this study, hot-rolling experiments were set at temperatures of 25, 60, 90, 120, 130, 140, and 150 °C. After being hot-rolled, photographs were taken to record the coagulation behaviours of PME in the aqueous solutions. In addition, the particle size distributions of PME in the solutions were also tested to further analyse the dispersion stability.
2.4 Plugging properties of PME
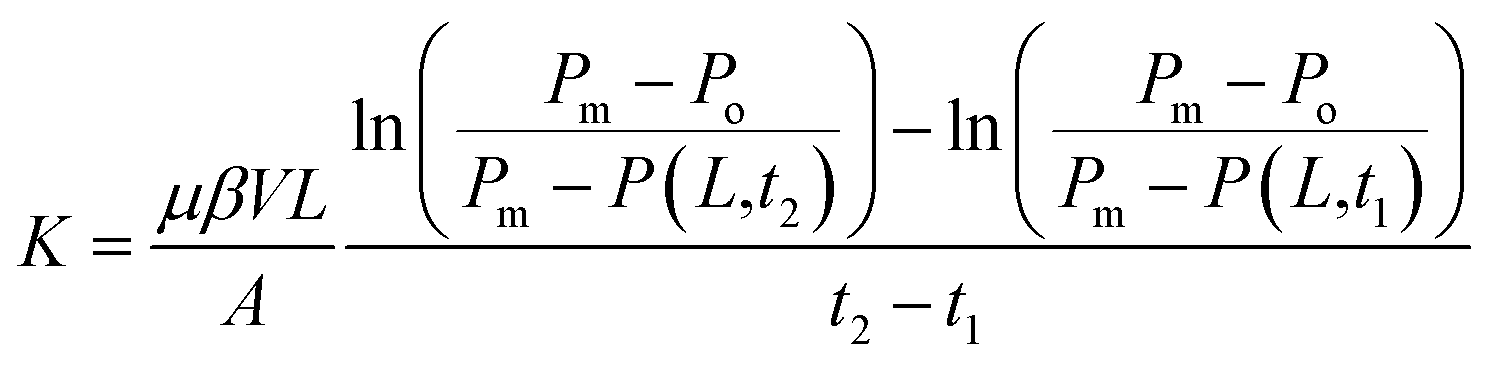
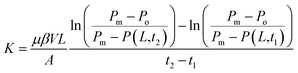
Pressure transmission tests were conducted to assess the sealing performance of PME.33 An experimental device for simulating hydro-mechanical coupling in shale was used for these tests. The shale specimens were cut into cylindrical cores (length: 6.0 mm; diameter: 25 mm), and 4% NaCl solution served as the reservoir brine. Commonly used plugging agents, including polymeric alcohol (JHC) and nano-silica (NS), were selected for comparison with PME. During the pressure transmission tests, shale cores were placed into the sealed chamber and the testing fluids flowed across the upper part of the shale cores continuously. The upstream pressure of the shale cores was kept at 2.0 MPa at all times, and the initial downstream pressure was set at 1.0 MPa. Under the pressure difference, the downstream pressure was raised gradually over time until a balance was reached. The downstream pressure build up was recorded as a function of time, and the increasing rate of downstream pressure could be used for calculating the shale permeability. The permeability values for shale before and after interaction with the test fluids were calculated using eqn (1):34| |
 | (1) |
where K is the permeability of the shale core, μm2; μ is the fluid viscosity, mPa s; β is the fluid compressibility, MPa−1; V is the enclosed volume of the bottom chamber, cm3; L is the length of the shale core, cm; A is the cross-sectional area of the shale core, cm2; t is the total test time, s; Pm is the upstream pressure, MPa; Po is the initial downstream pressure, MPa; and P(L, t) is the realtime downstream pressure, MPa.
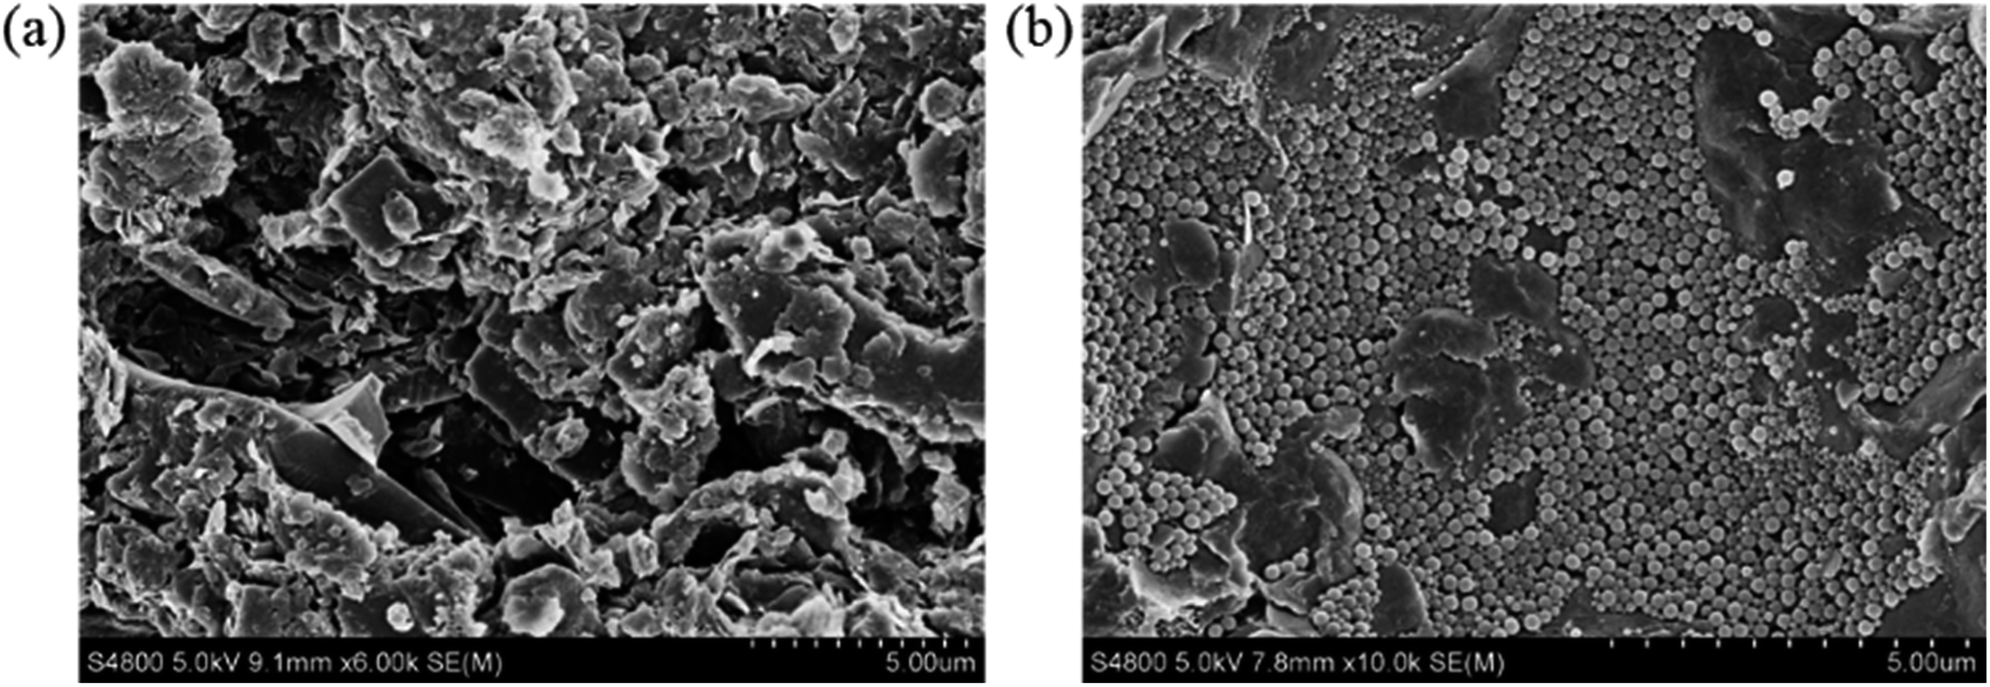
In order to further study the plugging mechanism of PME, the pore structures of shale samples before and after interacting with PME were characterized. Scanning electron microscopy (SEM, Hitachi S4800, Japan) photographs were obtained to intuitively describe the plugging properties of PME.
2.5 Hydration inhibition performance of PME
2.5.1 Rolling recovery tests. Rolling recovery tests can be used to analyse the shale hydration dispersion characteristics and assess the hydration inhibition properties of the test fluids.35 Commonly used shale hydration inhibitors, including polymeric alcohol (JHC) and potassium chloride (KCl), were selected for comparison with PME. First, 50 g of shale sample (particle sizes of 2–5 mm) was dried to a constant weight and placed in an aging tank with 350 mL of test fluid. Then, the aging tank was placed into a roller oven for 16 hours of hot rolling at a temperature of 77 °C. Finally, the sample was removed from the aging tank and washed with distilled water. Then, it was filtered through a 40 mesh sieve. The filtered sample was placed in a drying oven for 4 hours at a temperature of 105 °C. The remaining shale sample was weighed to calculate the shale recovery rate.
2.5.2 Surface tension measurements. Aqueous solutions of PME at different concentrations were prepared using deionized water. Surface tension measurements were carried out using a BZY-1 surface tensiometer (Shanghai Geng Instrument Company, China) using the platinum plate method. All the solutions were tested three times and the results averaged.
2.5.3 Contact angle measurements. A contact angle tester (JC2000D5M, China) was applied to carry out contact angle measurements. First, the shale surface was polished using sandpaper to remove the oxide film. Then, shale samples were placed into beakers containing PME at different concentrations. After immersing in the solutions for 6 h, the shale samples were removed from the beaker and left to air dry. Finally, a drop of distilled water was dropped on the shale surfaces with a syringe and pictures were captured. The contact angles were measured via image analysis with built-in software.
3. Results and discussion
3.1 Characterization of PME
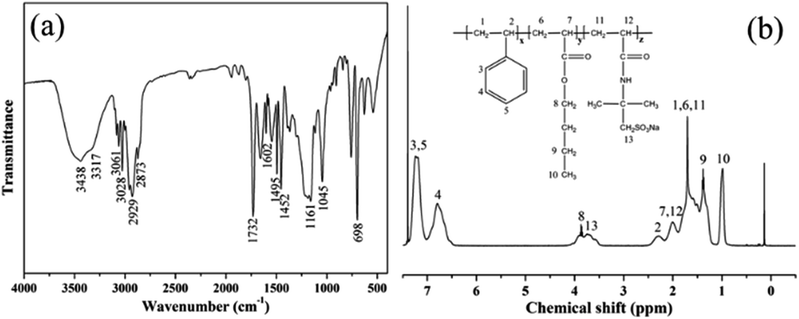
Fig. 2a shows the FT-IR spectrum of PME. The peaks appearing at 3061 cm−1, 3028 cm−1 and 2929 cm−1 correspond to the absorption peaks of C–H in a benzene ring. The peaks at 1602 cm−1, 1495 cm−1 and 1452 cm−1 are ascribed to stretching vibrations of a benzene skeleton, indicating that the product contained St chain segments. In addition, the peak appearing at 1732 cm−1 corresponds to a stretching vibration of C![[double bond, length as m-dash]](https://www.rsc.org/images/entities/char_e001.gif) O. The peak at 1161 cm−1 is ascribed to a stretching vibration of a C–O–C bond, indicating that the product contains BA chain segments. Furthermore, the peaks appearing at 3438 cm−1 and 3317 cm−1 correspond to a stretching vibration of –NH. The peak at 1045 cm−1 is ascribed to a stretching vibration of an SO bond, indicating that the product contains AMPS chain segments. The above discussion indicates that the newly-prepared PME is a copolymer of St, BA and AMPS.
O. The peak at 1161 cm−1 is ascribed to a stretching vibration of a C–O–C bond, indicating that the product contains BA chain segments. Furthermore, the peaks appearing at 3438 cm−1 and 3317 cm−1 correspond to a stretching vibration of –NH. The peak at 1045 cm−1 is ascribed to a stretching vibration of an SO bond, indicating that the product contains AMPS chain segments. The above discussion indicates that the newly-prepared PME is a copolymer of St, BA and AMPS.
 |
| | Fig. 2 (a) FT-IR spectrum of PME. (b) 1H NMR spectrum of PME. | |
The chemical structure of PME was further analysed via 1H NMR measurements, and the results are presented in Fig. 2b. The 1H chemical shifts of the copolymer are presented in the 1H NMR spectrum, and the corresponding peaks are marked. The results exhibit that the three monomers all successfully participated in the polymerization reaction. Therefore, the FT-IR and 1H NMR results show that PME was successfully prepared.
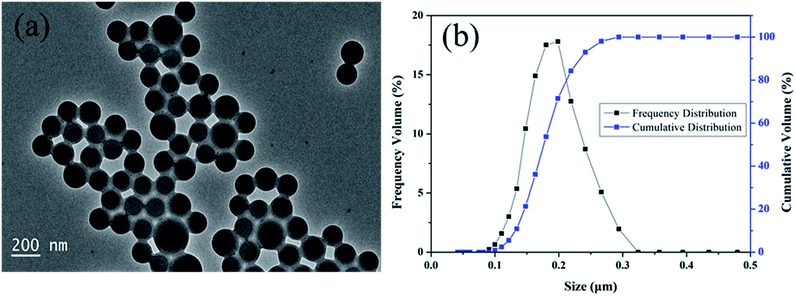
A typical TEM micrograph of a diluted PME sample is shown in Fig. 3a. The polymer nanoparticles were mainly spherical and they were well dispersed in aqueous solution. Through the TEM image, it can be seen that the average size of the polymer microspheres was about 180 nm and the particle sizes ranged from 110 nm to 270 nm. Fig. 3b demonstrates the particle size distribution of PME. The particle sizes of the polymer microspheres ranged from 90 nm to 320 nm with a D50 value (medium particle size) of 175 nm. The PSD measurement results basically coincide with the TEM characterization results. Large polymer microspheres (particle sizes larger than 270 nm) were not observed in the TEM image due to the small number present in PME.
 |
| | Fig. 3 (a) TEM image of PME. (b) Particle size distribution of PME. | |
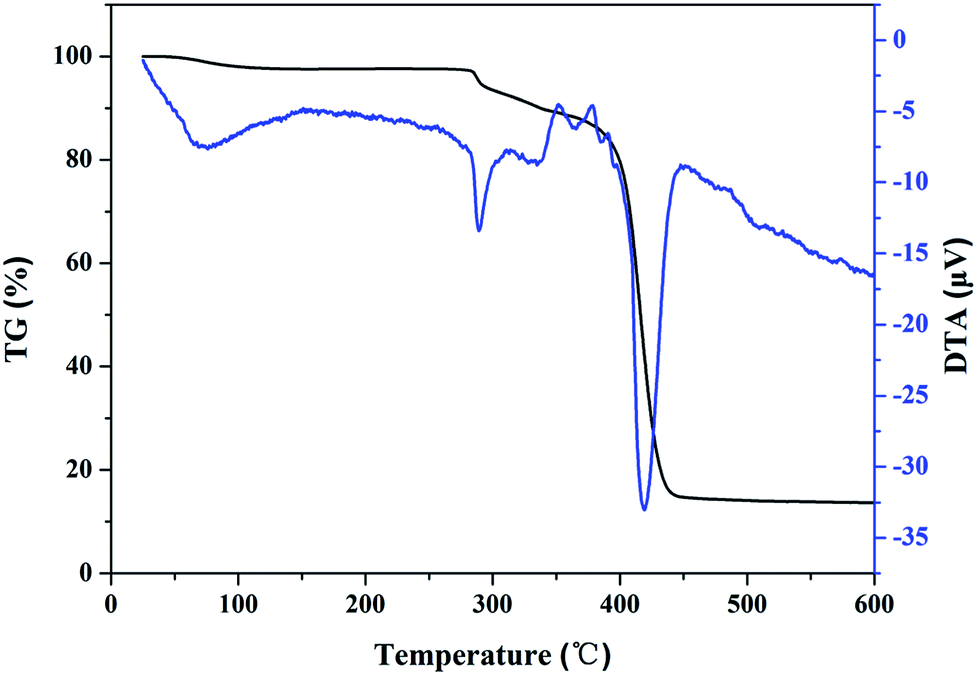
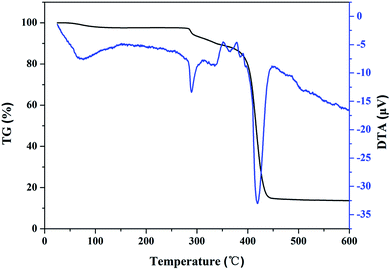
TGA and DTA curves of PME are presented in Fig. 4. It can be seen that the initial weight loss (around 2.57 wt%), from room temperature to 120 °C, can be ascribed to the evaporation of adsorbed water. The weight loss in the range of 275–385 °C could be due to the decomposition of AMPS.36 A sharp weight loss was observed at around 400 °C, which was attributed to the thermal decomposition of the polymer backbone. Therefore, PME showed good thermal stability.
 |
| | Fig. 4 TGA and DTA curves of PME. | |
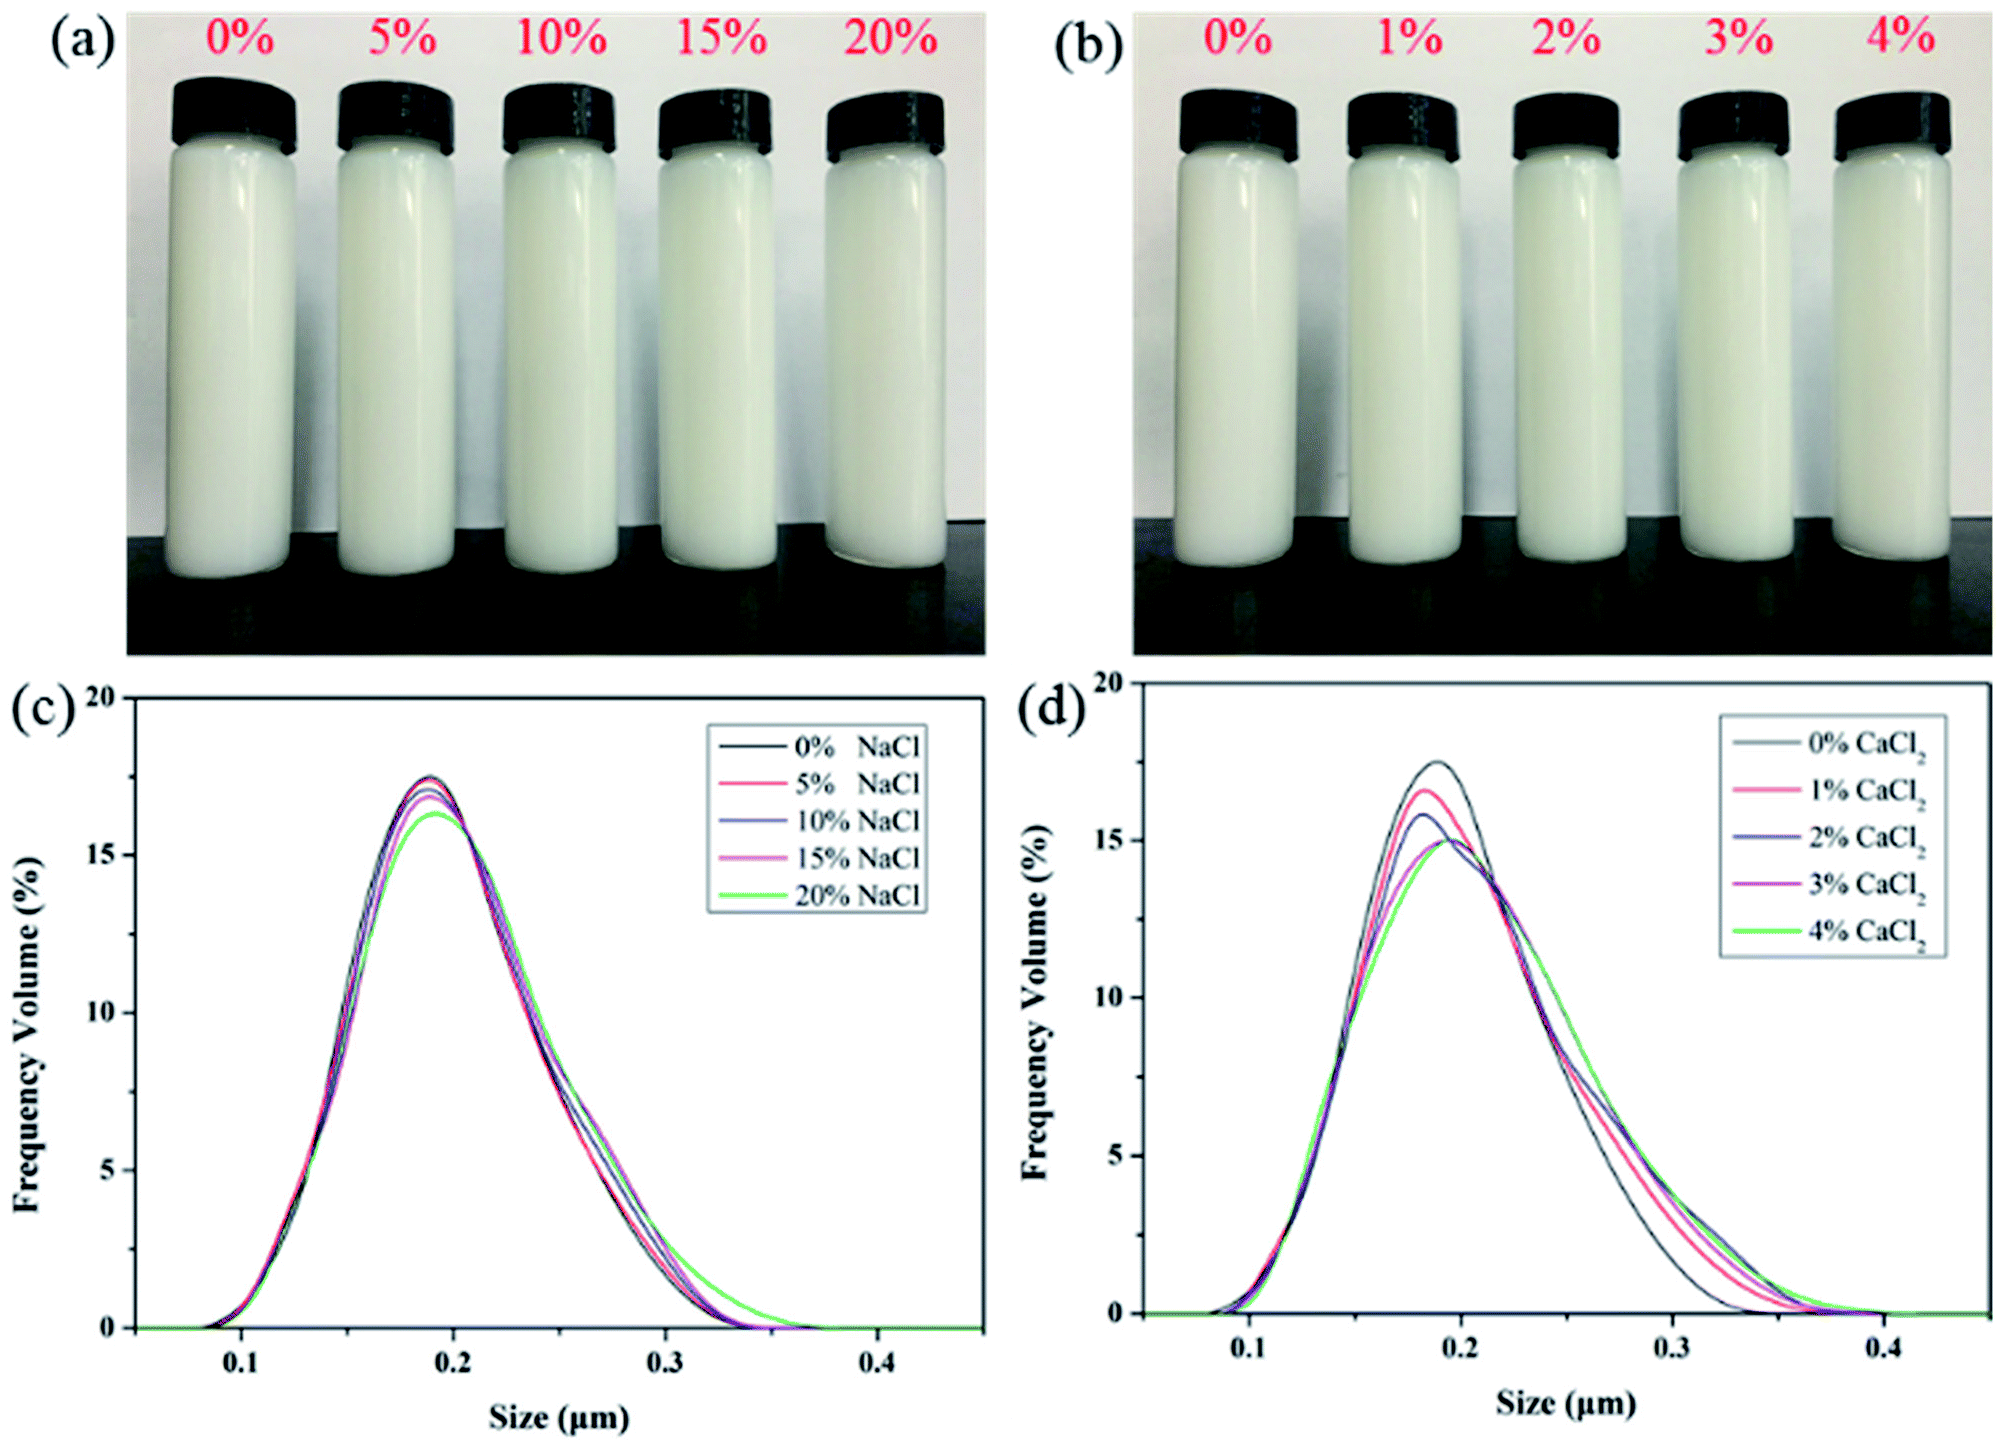
3.2 Salt tolerance of PME
Photographs of PME in NaCl and CaCl2 solutions of different concentrations are shown in Fig. 5a and b, respectively. After being dispersed in salt solution for 16 h, it can be seen that the polymer microsphere emulsion remained stably dispersed and no precipitation appeared in the solutions. This proves that PME possessed strong dispersion stability in salt solutions. In addition, particle size distribution measurements were conducted to further analyze the dispersion stability of PME in NaCl and CaCl2 solutions, the results of which are depicted in Fig. 5c and d, respectively. The salt solutions only created slight variations in the particle size distribution curves, which were only in the form of a little widening. It can be concluded that only a few nanoparticles in PME agglomerated, and the high salt tolerance of PME in NaCl and CaCl2 solutions was further confirmed. This can be explained through the adsorption of emulsifiers onto the polymer microspheres, which can greatly enhance the effects of steric hindrance and electrostatic repulsion in salt solutions of high concentration.32
 |
| | Fig. 5 Photographs of PME in (a) NaCl solutions and (b) CaCl2 solutions of different concentrations. Particle size distributions of PME in (c) NaCl solutions and (d) CaCl2 solutions of different concentrations. | |
3.3 Temperature resistance of PME
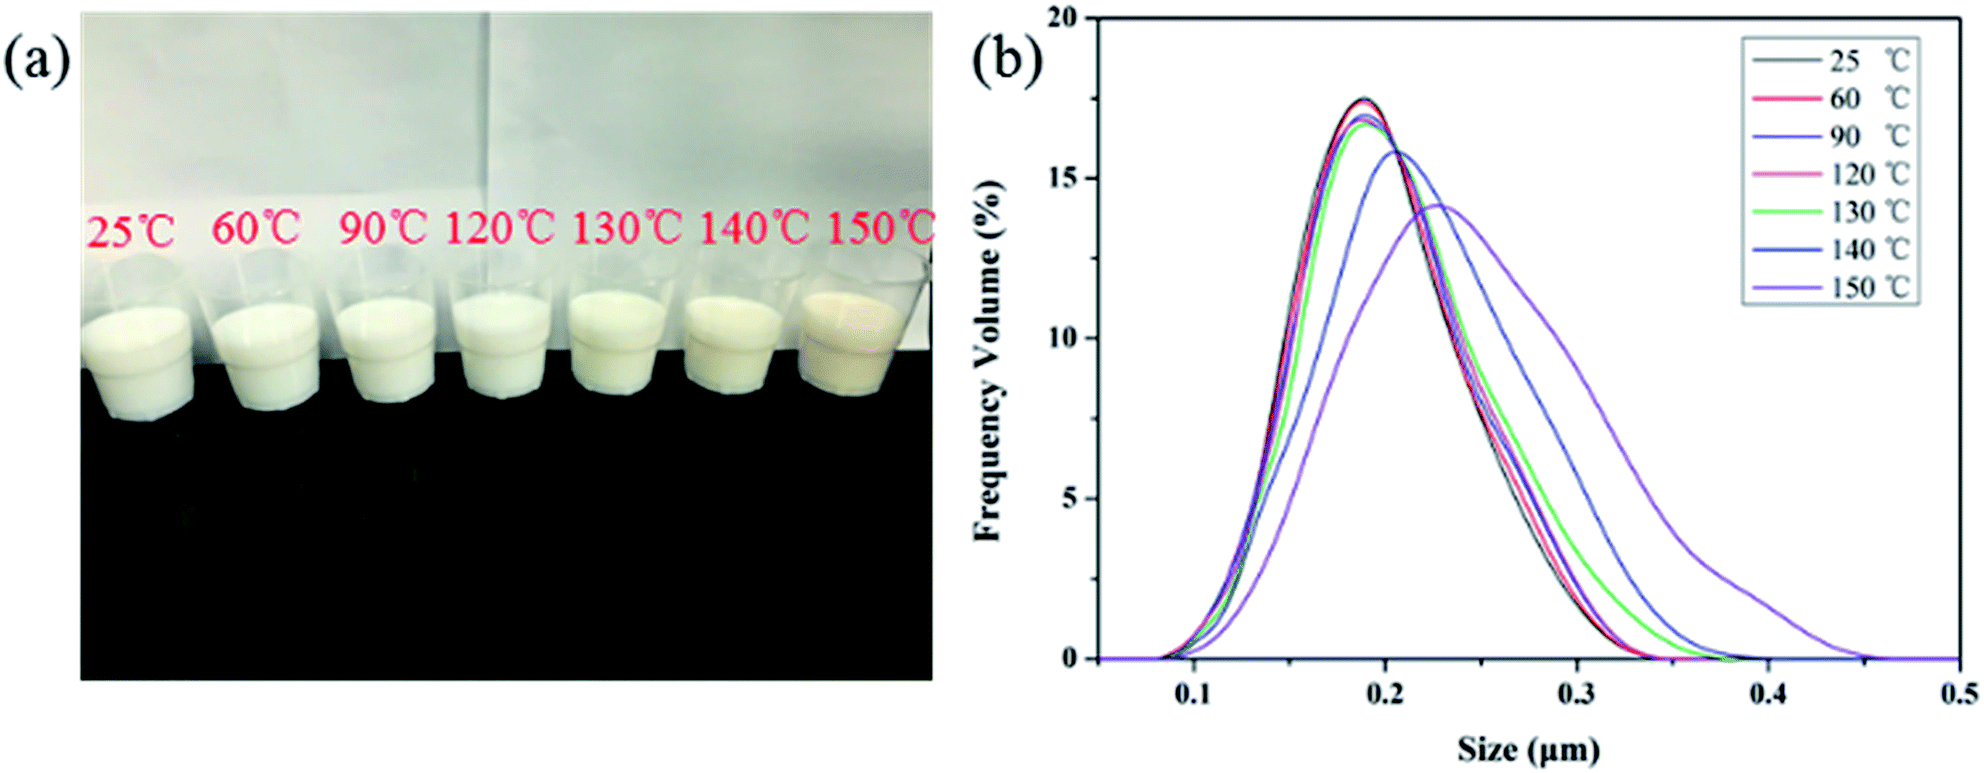
Fig. 6a presents a photograph of PME in aqueous solutions after being hot-rolled at different temperatures. No precipitation appeared in the solutions after hot-rolling at different temperatures. But after the temperature increased to 130 °C, the solutions began to turn yellow, indicating that the polymer microsphere emulsion gradually deteriorates. In addition, particle size distribution measurements were conducted to further analyse the dispersion stability of PME after hot-rolling at different temperatures.
 |
| | Fig. 6 (a) A photograph of PME after hot-rolling for 16 h at different temperatures. (b) Particle size distributions of PME after hot-rolling for 16 h at different temperatures. | |
As depicted in Fig. 6b, when the temperature was lower than 130 °C, an increase in temperature created little change in the particle size distribution curves. But after the temperature rose above 130 °C, the particle size distribution curves gradually widened, indicating that after hot-rolling, some polymer nanoparticles in PME agglomerated and the dispersion stability of PME was decreased. These results show that PME exhibited excellent temperature resistance from 25 to 130 °C.
3.4 Plugging properties of PME
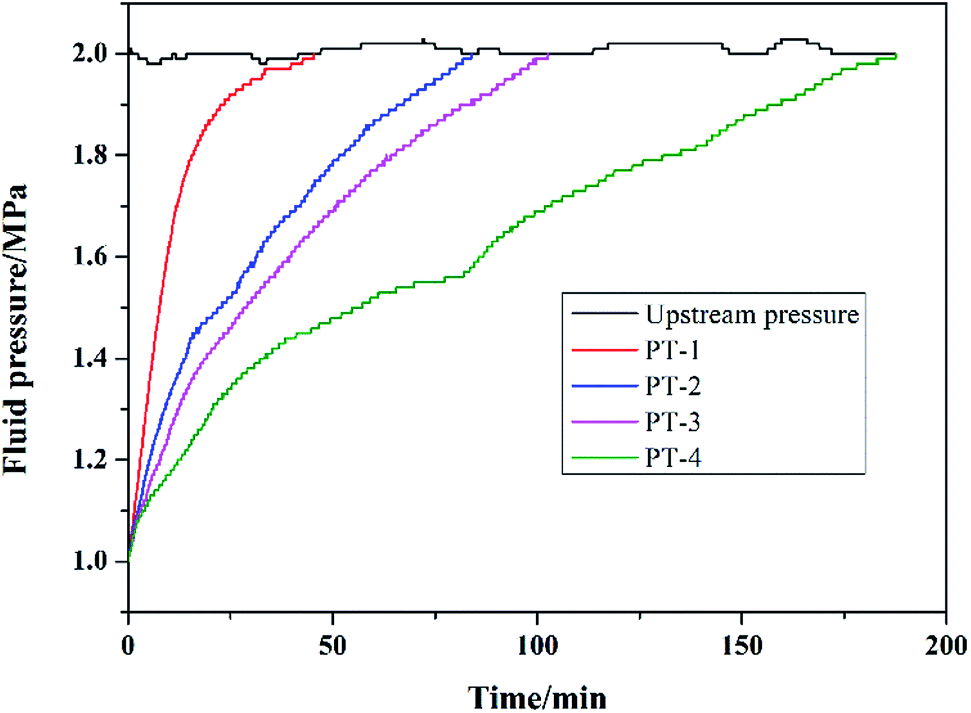
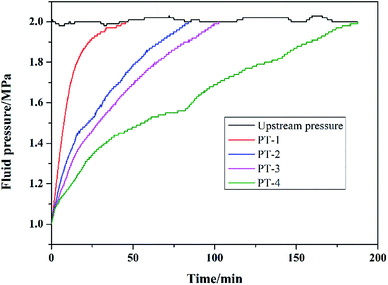
Pressure transmission curves are presented in Fig. 7, and the permeability values for shale cores after interacting with different testing fluids were calculated using eqn (1), and are illustrated in Table 3. It took only around 45 min for the downstream pressure to reach a balance when interacting with PT-1, and the permeability of the shale core was 6.08 × 10⁻⁷ μm2. The pressure transmission rate slowed down when interacting with PT-2, PT-3 and PT-4, and the time for the downstream pressure to reach a balance was delayed to 84, 103 and 188 min, respectively. After interacting with PT-2, PT-3 and PT-4, the permeability values of the shale cores were decreased to 2.04 × 10⁻⁷, 1.61 × 10⁻⁷, and 8.07 × 10⁻⁸ μm2, respectively. These results showed that PME exhibited excellent plugging performance to slow down pressure transmission rates and reduce the permeability of shale cores. The plugging performance of PME was significantly better than that of JHC and NS, and thus the outstanding plugging performance of PME was further confirmed.
 |
| | Fig. 7 Pressure transmission test curves. | |
Table 3 Permeability values for the shale cores
| Label |
Testing fluid |
Shale permeability (μm2) |
| PT-1 |
4% NaCl |
6.08 × 10⁻⁷ |
| PT-2 |
4% NaCl + 2% JHC |
2.04 × 10⁻⁷ |
| PT-3 |
4% NaCl + 2% NS |
1.61 × 10⁻⁷ |
| PT-4 |
4% NaCl + 2% PME |
8.07 × 10⁻⁸ |
Based on the above results, a possible mechanism was concluded. Under the drilling pressure difference, the polymer microspheres were tightly embedded into the micro- and nano-scale pores and cracks in the shale cores, resulting in dense-plugging. This can be seen from the SEM images presented in Fig. 8. A lot of natural micro- and nano-scale pores and cracks develop in shale formations. After interacting with PME, the pores and cracks were effectively plugged by the polymer microspheres. Thus, the pressure transmission rate was slowed down and the permeability of the shale core was reduced. Therefore, water-based fluids containing PME were proven to show excellent physical plugging performance, and PME is expected to be an effective plugging agent for WDFs used to drill shale formations.
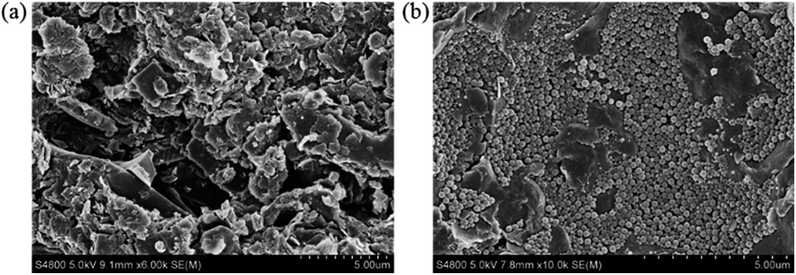 |
| | Fig. 8 SEM photographs of (a) the shale core before testing and (b) the shale core after interaction with PT-4. | |
3.5 Hydration inhibition performance of PME
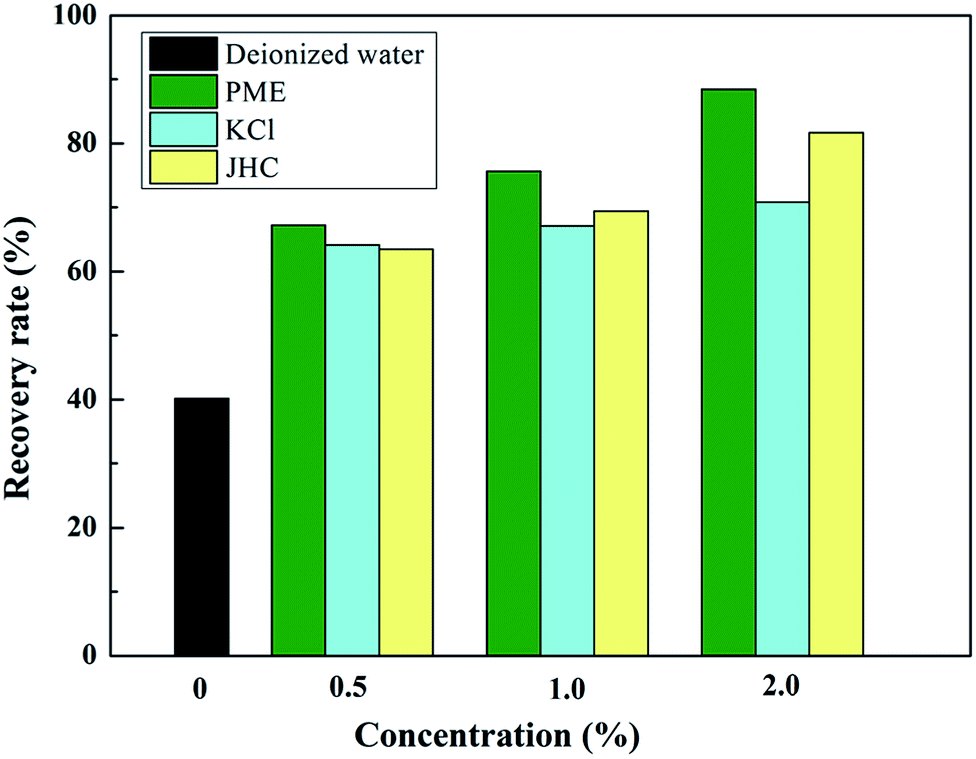
Fig. 9 presents the recovery rates of shale cuttings when interacting with different testing fluids. A higher recovery rate is a symbol of better shale hydration inhibition performance. As shown in Fig. 9, a high dispersion tendency was observed when interacting with deionized water, where around 59.8% of the shale cuttings were dispersed. The solutions containing 0.5% PME, 1.0% PME, and 2.0% PME could enhance the shale recovery rate from 40.2% to 67.2%, 75.6%, and 88.4%, respectively, indicating the great shale hydration inhibition performance of PME. In addition, compared with KCl and JHC, PME showed better performance with regards to inhibiting shale dispersion at the same concentrations.
 |
| | Fig. 9 The results of rolling recovery tests. | |
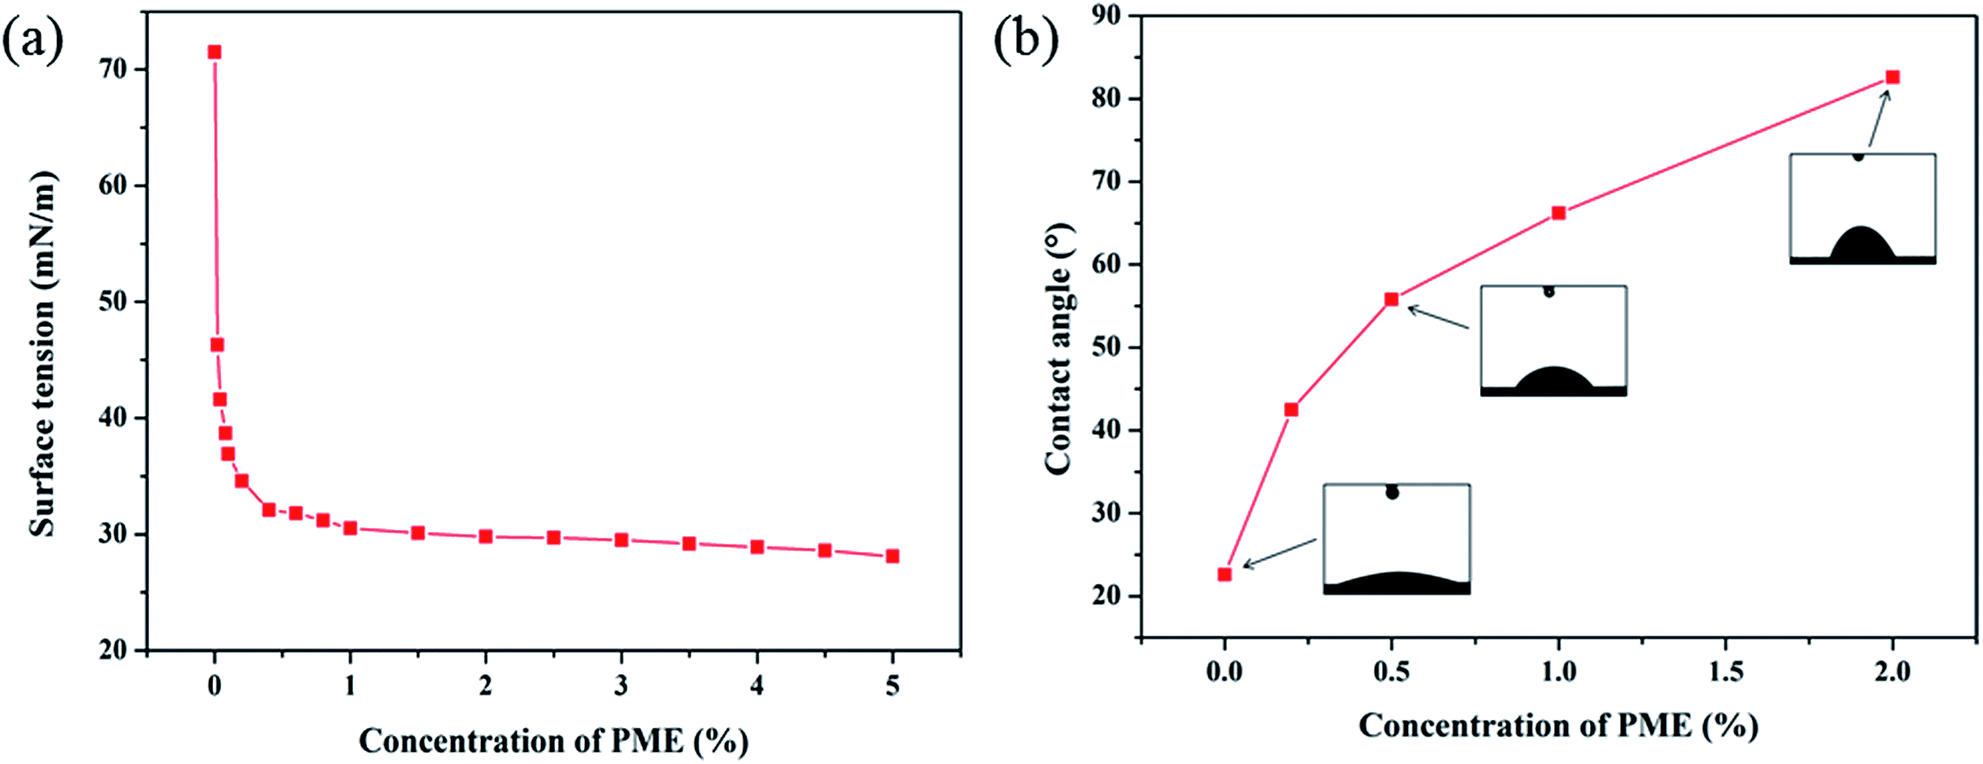
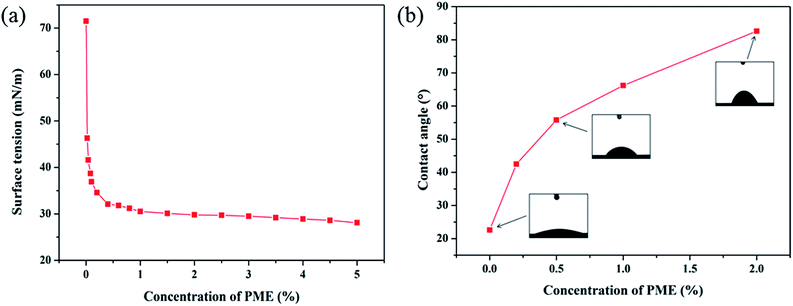
To further investigate the mechanism of how PME inhibits shale hydration, surface tension and contact angle measurements were obtained. The shale surface is usually hydrophilic, and capillary suction pressure is one of the driving forces for water molecules invading shale formations.37,38 Reducing the surface tension of WDFs would effectively decrease the capillary pressure, resulting in a reduced intake of WDFs, thus weakening the shale hydration effect. The variation in surface tension as a function of PME concentration is shown in Fig. 10a. The surface tension continuously decreases with an increase in PME concentration. In this work, a significant reduction in surface tension at low concentrations was observed. When the concentration was 0.1%, the surface tension decreased to as low as 36.9 mN m−1, indicating that PME could effectively decrease the surface tension, even at low concentrations. This is due to the existence of surfactants in PME, resulting in lower surface tension. Therefore, the addition of PME was beneficial in decreasing the capillary pressure, and thus effectively inhibiting shale hydration via diminishing the intake of water into shale formations.
 |
| | Fig. 10 Results of (a) surface tension tests and (b) contact angle tests. | |
The effects of PME on the shale wettability are shown in Fig. 10b. The contact angle of pristine shale was around 22.6°, demonstrating favorable hydrophilicity. After interacting with PME, the contact angle of the shale surface increased rapidly. When the concentration was 0.2%, the contact angle increased to 42.5°, indicating a significant increase in contact angle after soaking with PME solution. In particular, when the concentration was 2.0%, the contact angle of the shale sample could be increased to 82.6°, nearing 90.0°. It could be inferred that PME was capable of significantly changing the shale surface to be more hydrophobic after interacting with PME. Moreover, a more hydrophobic shale surface would create less affinity towards water, and thus reduce the shale hydration potential.
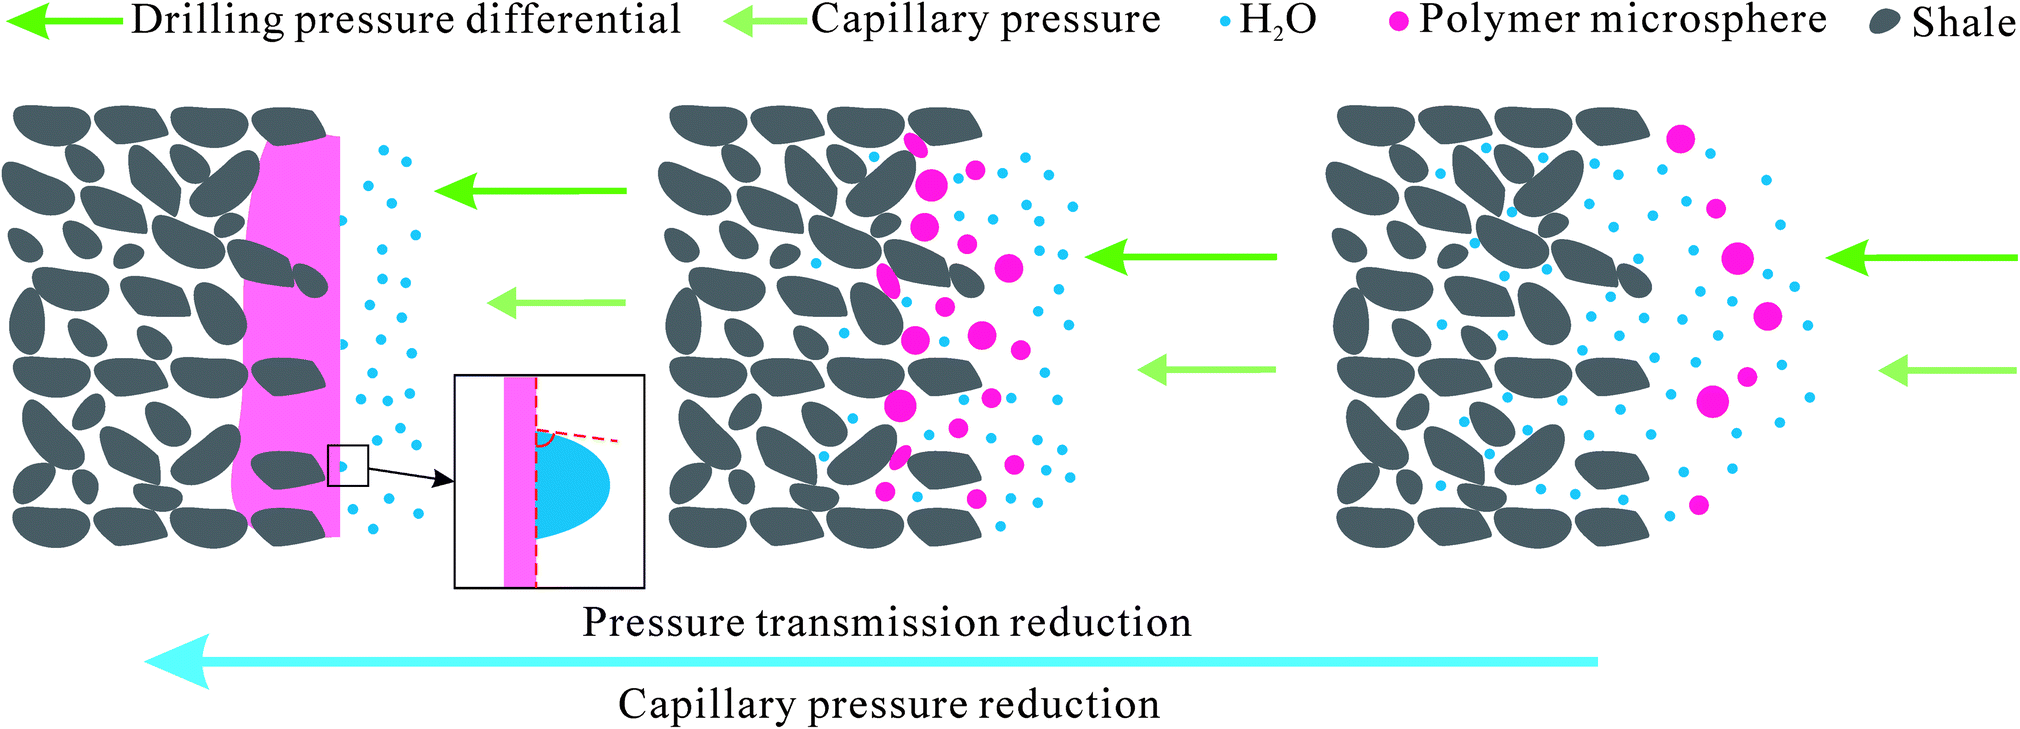
3.6 Wellbore stabilizing mechanism of PME
Based on above research results and some literature, a probable mechanism for how PME improves shale stability can be summed up. An intuitive model describing the wellbore stabilizing mechanism of PME is suggested in Fig. 11. A lot of micro- and nano-scale pores and fractures develop in shale formations. Under a drilling pressure difference and capillary pressure, the polymer microspheres are squeezed into the shale pores and fractures, resulting in dense-plugging. Hence, pressure transmission is retarded and the permeability of shale formations is reduced, which favor improving shale stability.39 In addition, the capillary effect can be decreased via PME addition, thus reducing water intake into shale formations. Meanwhile, after interacting with PME, the shale surface changes to be more hydrophobic, which contributes to decreasing its affinity towards water.40 Thus, the shale hydration potential can be effectively reduced as the invasion of water into shale formations is restricted. Therefore, PME has the potential to be an excellent shale stabilizer for WDFs used in drilling shale formations, as it undertakes the dual roles of physical plugging and shale hydration inhibition.
 |
| | Fig. 11 The wellbore stabilizing mechanism of PME. | |
4. Conclusions
In this study, a polymer microsphere emulsion (PME) as a potential shale stabilizer for WDFs was prepared and characterized. The particle size distribution of PME was between 90 and 320 nm, with a D50 value of 175 nm. It was found that PME exhibited excellent salt tolerance and temperature resistance. Pressure transmission tests indicated that PME could effectively plug shale pores and reduce shale permeability. The excellent physical plugging performance of PME was further confirmed via SEM analysis. Rolling recovery tests showed that PME possessed better performance for inhibiting shale hydration compared with KCl and JHC. Decreasing the capillary pressure and creating a hydrophobic film could be the mechanism through which PME effectively reduces shale hydration potential. The greatest advantage of this novel shale stabilizer was that it undertook the dual roles of physical plugging and shale hydration inhibition. Based on the above research results, PME could be a promising shale stabilizer for WDFs used to drill shale formations.
Conflicts of interest
There are no conflicts to declare.
Acknowledgements
This work was financially supported by the National Natural Science Foundation of China (U1562101), the National Science and Technology Major Project of China (2016ZX05020-004 and 2017ZX05032-004-005), and the Graduate Student Innovation Project from China University of Petroleum (East China) (YCX2017016).
References
- J. Cao, L. Meng, Y. Yang, Y. Zhu, X. Wang, C. Yao, M. Sun and H. Zhong, Novel Acrylamide/2-Acrylamide-2-methylpropanesulfonic Acid/4-Vinylpyridine Terpolymer as an Anti-calcium Contamination Fluid-Loss Additive for Water-Based Drilling Fluids, Energy Fuels, 2017, 31, 11963–11970 CrossRef.
- X. Zhao, Z. Qiu, W. Huang and M. Wang, Mechanism and method for controlling low-temperature rheology of water-based drilling fluids in deepwater drilling, J. Pet. Sci. Eng., 2017, 154, 405–416 CrossRef.
- L. Yang, G. Jiang, Y. Shi, X. Lin and X. Yang, Application of ionic liquid to a high-performance calcium-resistant additive for filtration control of bentonite/water-based drilling fluids, J. Mater. Sci., 2017, 52, 6362–6375 CrossRef.
- R. Jain and V. Mahto, Formulation of a water based drilling fluid system with synthesized graft copolymer for troublesome shale formations, J. Nat. Gas Sci. Eng., 2017, 38, 171–181 CrossRef.
- H. Zhong, Z. Qiu, Z. Tang, X. Zhang, J. Xu and W. Huang, Study of 4, 4′-methylenebis-cyclohexanamine as a high temperature-resistant shale inhibitor, J. Mater. Sci., 2016, 51, 7585–7597 CrossRef.
- X. Zhao, Z. Qiu, M. Wang, W. Huang and S. Zhang, Performance evaluation of a highly inhibitive water-based drilling fluid for ultralow temperature wells, J. Energy Resour. Technol., 2018, 140, 012906 CrossRef.
- P. Zhang, S. Lu, J. Li, H. Xue, W. Li and P. Zhang, Characterization of shale pore system: a case study of Paleogene Xin'gouzui Formation in the Jianghan basin, China, Mar. Pet. Geol., 2017, 79, 321–334 CrossRef.
- K. Liu and M. Ostadhassan, Microstructural and geomechanical analysis of Bakken shale at nanoscale, J. Pet. Sci. Eng., 2017, 153, 133–144 CrossRef.
- P. Zhang, S. Lu, J. Li, J. Zhang, H. Xue and C. Chen, Comparisons of SEM, Low-Field NMR, and Mercury Intrusion Capillary Pressure in Characterization of the Pore Size Distribution of Lacustrine Shale: A Case Study on the Dongying Depression, Bohai Bay Basin, China, Energy Fuels, 2017, 31, 9232–9239 CrossRef.
- L. Wang, G. Zhang, S. Hallais, A. Tanguy and D. Yang, Swelling of Shales: A Multiscale Experimental Investigation, Energy Fuels, 2017, 31, 10442–10451 CrossRef.
- G. Chen and R. Ewy, Investigation of the undrained loading effect and chemical effect on shale stability, SPE Paper 78164, SPE/ISRM Rock Mechanics Conference, Irving, Texas, USA, 2002 Search PubMed.
- C. Liang, M. Chen, Y. Jin and Y. Lu, Wellbore stability model for shale gas reservoir considering the coupling of multi-weakness planes and porous flow, J. Nat. Gas Sci. Eng., 2014, 21, 364–378 CrossRef.
- J. Song, Y. Yuan, S. Gu, X. Yang, Y. Yue, J. Cai and G. Jiang, 2D Numerical Simulation of Improving Wellbore Stability in Shale Using Nanoparticles Based Drilling Fluid, Energies, 2017, 10, 651 CrossRef.
- E. Van Oort, C. Pasturel, J. Bryla and F. Ditlevsen, Improved wellbore stability in tor/ekofisk wells through shale-fluid compatibility optimization, SPE Paper 184661, SPE/IADC Drilling Conference and Exhibition. Society of Petroleum Engineers, The Hague, The Netherlands, 2017 Search PubMed.
- A. H. Hale, F. K. Mody and D. P. Salisbury, The influence of chemical potential on wellbore stability, SPE Drill. Completion, 1993, 8, 207–216 CrossRef.
- R. J. Ambrose, R. C. Hartman, M. Diaz-Campos, I. Y. Akkutlu and C. H. Sondergeld, New pore-scale consideration for shale gas in place calculations, SPE Paper 131772, SPE Unconventional Gas Conference and Exhibition, Pittsburgh, Pennsylvania, USA, 2010 Search PubMed.
- V. Dokhani, M. Yu, N. E. Takach and B. Bloys, The role of moisture adsorption in wellbore stability of shale formations: mechanism and modelling, J. Nat. Gas Sci. Eng., 2015, 27, 168–177 CrossRef.
- Y. An, G. Jiang, Y. Qi, X. Huang and H. Shi, High-performance shale plugging agent based on chemically modified grapheme, J. Nat. Gas Sci. Eng., 2016, 32, 347–355 CrossRef.
- M. E. Chenevert and A. K. Sharma, Permeability and effective pore pressure of shales, SPE Drill. Completion, 1993, 8, 28–34 CrossRef.
- R. P. Steiger and P. K. Leung, Quantitative determination of the mechanical properties of shales, SPE Drilling Engineering, 1992, 7, 181–185 CrossRef.
- S. Zhang, Z. Qiu, W. Huang, J. Cao and X. Luo, Characterization of a novel aluminum-based shale stabilizer, J. Pet. Sci. Eng., 2013, 103, 36–40 CrossRef.
- E. Van Oort, A novel technique for the investigation of drilling fluid induced borehole instability in shales, in Rock Mechanics in Petroleum Engineering, Society of Petroleum Engineers, Delft, Netherlands, 1994 Search PubMed.
- Y. An, G. Jiang, Y. Qi, Q. Ge and L. Zhang, Nano-fluid loss agent based on an acrylamide based copolymer “grafted” on a modified silica surface, RSC Adv., 2016, 6, 17246–17255 RSC.
- J. Xu, Z. Qiu, W. Huang and X. Zhao, Preparation and performance properties of polymer latex SDNL in water-based drilling fluids for drilling troublesome shale formations, J. Nat. Gas Sci. Eng., 2017, 37, 462–470 CrossRef.
- J. Liu, Z. Qiu and W. Huang, Novel latex particles and aluminum complexes as potential shale stabilizers in water-based drilling fluids, J. Pet. Sci. Eng., 2015, 135, 433–441 CrossRef.
- J. H. Cai, M. E. Chenevert, M. M. Sharma and J. E. Friedheim, Decreasing water invasion into Atoka shale using nonmodified silica nanoparticles, SPE Drill. Completion, 2012, 27, 103–112 CrossRef.
- R. Jain, V. Mahto and V. P. Sharma, Evaluation of polyacrylamide grafted polyethylene glycol/silica nanocomposite as potential additive in water based drilling mud for reactive shale formation, J. Nat. Gas Sci. Eng., 2015, 26, 526–537 CrossRef.
- Y. Wu, Z. Wang, Z. Yan, T. Zhang, Y. Bai, P. Wang, P. Luo, S. Gou and Q. Guo, Poly (2-acrylamide-2-methylpropanesulfonic acid) modified SiO2 nanoparticles for water based drilling fluids, Ind. Eng. Chem. Res., 2016, 56, 168–174 CrossRef.
- J. Xu, Z. Qiu, X. Zhao and W. Huang, Hydrophobic modified polymer based silica nanocomposite for improving shale stability in water-based drilling fluids, J. Pet. Sci. Eng., 2017, 153, 325–330 CrossRef.
- S. R. Shadizadeh, A. Moslemizadeh and A. S. Dezaki, A novel nonionic surfactant for inhibiting shale hydration, Appl. Clay Sci., 2015, 118, 74–86 CrossRef.
- H. Zhong, Z. Qiu, D. Zhang, Z. Tang, W. Huang and W. Wang, Inhibiting shale hydration and dispersion with amine-terminated polyamidoamine dendrimers, J. Nat. Gas Sci. Eng., 2016, 28, 52–60 CrossRef.
- H. A. Yousefvand and A. Jafari, Stability and flooding analysis of nanosilica/NaCl/HPAM/SDS solution for enhanced heavy oil recovery, J. Pet. Sci. Eng., 2018, 162, 283–291 CrossRef.
- J. F. Xu, Z. S. Qiu and K. H. Lyu, Pressure transmission testing technology and simulation equipment for hydra-mechanics coupling of shale, Acta Pet. Sin., 2005, 27, 26–27 Search PubMed.
- J. F. Xu and Z. S. Qiu, Simulation test equipment of coupled hydra-mechanics of shales, J. China Univ. Pet., Ed. Nat. Sci., 2006, 30, 63–66 Search PubMed.
- X. Zhao, Z. Qiu, Y. Zhang, H. Zhong, W. Huang and Z. Tang, Zwitterionic polymer P(AM-DMC-AMPS) as a low-molecular-weight encapsulator in deepwater drilling fluid, Appl. Sci., 2017, 7, 594 CrossRef.
- L. Zhang, H. Gao and Y. Liao, Preparation and application of poly(AMPS-co-DVB) to remove rhodamine b from aqueous solutions, React. Funct. Polym., 2016, 104, 53–61 CrossRef.
- Y. Shen, H. Ge, M. Meng, Z. Jiang and X. Yang, Effect of water imbibition on shale permeability and its influence on gas production, Energy Fuels, 2017, 31, 4973–4980 CrossRef.
- J. O. Alvarez and D. S. Schechter, Wettability alteration and spontaneous imbibition in unconventional liquid reservoirs by surfactant additives, SPE Reservoir Eval. Eng., 2017, 20, 107–117 CrossRef.
- J. Xu, Z. Qiu, X. Zhao, H. Zhong, G. Li and W. Huang, Synthesis and characterization of shale stabilizer based on polyethylene glycol grafted nano-silica composite in water-based drilling fluids, J. Pet. Sci. Eng., 2018, 163, 371–377 CrossRef.
- H. Zhong, Z. Qiu, J. Chai, B. Guo, D. Sun and J. Liu, A preliminary study of the preparation of shale stabilizer with oil sludge-From waste to resource, J. Pet. Sci. Eng., 2018, 161, 50–60 CrossRef.
|
| This journal is © The Royal Society of Chemistry 2018 |
Click here to see how this site uses Cookies. View our privacy policy here. 
 Open Access Article
 This Open Access Article is licensed under a Creative Commons Attribution-Non Commercial 3.0 Unported Licence
 *,
Zhengsong Qiu*,
Xin Zhao,
Tingbo Mou,
Hanyi Zhong and
Weian Huang
*,
Zhengsong Qiu*,
Xin Zhao,
Tingbo Mou,
Hanyi Zhong and
Weian Huang