 Open Access Article
Preparation of fluorinated graphene to study its gas sensitivity
Wenze Kang * and
Shangyi Li
Institute of Mining Engineering, Heilongjiang University of Science and Technology, Harbin 150022, China. E-mail: kwz010@163.com; Fax: +86 451 88036755
First published on 27th June 2018
Abstract
In this paper, fluorinated graphene was prepared from graphite fluoride by an improved Hummers method. The fluorinated graphene was characterized using an X-ray diffractometer (XRD), transmission electron microscope (TEM), atomic force microscope (AFM) and X-ray photoelectron spectrometer (XPS). Moreover, a gas sensitivity test was carried out. The results show that the fluorinated graphene is composed of about 5 layers prepared by utilising the improved Hummers method. The content of fluorine in fluorinated graphene decreased, mainly due to the fracture of C–F bonds. Fluorinated graphene showed gas sensitivity to ethanol, ammonia, methane and formaldehyde gases. The sensitivity of fluorinated graphene to ammonia is the highest and is 3.5 times the sensitivity of graphene to ammonia. The doping of fluorine atoms was conducive to improving the gas sensitivity of fluorinated graphene.
1 Introduction
Due to good geometric properties and strong flexibility, two-dimensional (2-d) materials have been a key research focus for a few years. Graphene is representative of a typical two-dimensional material. With the development of graphene, the derivatives of graphene have attracted more and more attention from scientists. Among the many graphene derivatives, fluorinated graphene is one of the most important members. Fluorinated graphene can be regarded as a basic element formed by the accumulation of graphite fluoride on a layer-by-layer basis,1 while the introduction of fluorine atoms changes the C–C bond from sp2 hybridized to sp3 hybridized.2 The current research demonstrates that fluorinated graphene has different chemical mechanisms and electronic structures to those of graphene,3 and shows physical properties such as good mechanical strength and a wide band gap (0 to 3 eV). Therefore, it can be used as a shielding material, insulation material and adsorption material,4 and in light emitting displays.2 By using hydrazine vapour, Robinson et al. reduced fluorinated graphene into graphene.5 The C–F bonds in fluorinated graphene tend to react with nucleophilic groups to form fluorinated graphene with certain special functions. Wang found that C–F bonds in fluorinated graphene can improve the growth rate of cells, which is 1.3 times that of graphene.6There are many difficulties in preparing fluorinated graphene, such as low productivity, high costs, and rigorous strictures imposed on its preparation environment, as well as difficulties in controlling the fluorine content during preparation. This is mainly because a layer of fluorine atoms adheres to the 2-d carbon layer planes. Although graphite fluoride shows a wider spacing between its carbon layers than graphite, it still has a high chemical-bond energy, and therefore, it is difficult to prepare fluorinated graphene. The preparation methods for fluorinated graphene can be divided into three types according to different raw materials: firstly, fluorinated graphene can be prepared by taking graphite fluoride as a raw material through intercalation and exfoliation.1 Gong et al. intercalated and exfoliated graphite fluoride by using an organic solvent as the intercalation reagent and analysed the physical properties of the resulting fluorinated graphene.7 Secondly, by using graphene or graphene oxide as the raw materials, fluorinated graphene can be fluorated by fluorination agents.5,8 The commonly used fluorination agents include HF, XeF2, SF6, CHF3, perfluorinated resin, etc. Nebogatikova et al. have examined the interaction between a suspension of graphene in dimethylformamide and an aqueous solution of hydrofluoric acid, which was found to result in partial fluorination of suspension flakes.9 Nebogatikova et al. identified conditions suitable for efficient modification of graphene and few-layer graphene (FLG) films with aqueous solutions of hydrofluoric acid (HF) and for local protection of the graphene against such modification in isopropyl alcohol.10 Wang et al. realized an easy, low-cost and effective synthesis of fluorinated graphene with tunable C/F atomic ratio (RC/F) by the reaction between dispersed graphene oxide and hydrofluoric acid.11 Antonova et al. showed that the resultant fluoro-graphene had a fluorination degree ranging from small values to ∼25% (C4F) and to ∼50% (C2F) based on processing graphene in an aqueous solution of hydrofluoric acid.12 Thirdly, the preparation is carried out through chemical vapour deposition (CVD). In general, fluorinated graphene can be synthesised by using CH4, SF6, and FeCl3 as a carbon source, fluorinating agent, and catalyst, respectively.13 Fluorination agents are needed in the second or third methods, therefore this study adopts the first method.
Graphene-based chemical sensors are an important research field for graphene in electrical applications. Schedin et al. investigated the gas sensitivity of graphene to NO2 and NH3 and elaborated the gas-sensing mechanisms of graphene-based gas sensors.14 Even though graphene can be used as a material in a gas sensor, functional groups that can stably act with gases are not found on the surface of graphene, thus resulting in poor gas sensitivity. By studying the determinations of graphene with different oxygen contents on CH4 and H2, Hou et al. found that the higher the oxygen content, the better the gas sensitivity, and vice versa.15 Based on the research into graphene doped with N and B, Dai et al. found that the response of the doped graphene to a lot of gases is greater than that of graphene and conducted theoretical calculations to that effect.16 Sysoev et al. obtained few – layer graphene samples by a thermal expansion of bromine – intercalated fluorinated graphite with a ∼C2F matrix composition at 600, 700, and 800 °C and came to a conclusion that the film from few-layer graphene produced at 800 °C had the largest relative response, while its recovery was quite low at room temperature.17 Katkov et al. used a backside fluorine-functionalized graphene layer for ammonia detection and the reduction degree of the material and its electrical response revealed upon ammonia exposure were controlled by measuring the surface conductivity.18 Sysoev et al. revealed an influence of fluorine and hydroxyl species on the graphene surface on the restorable adsorption of ammonia and nitrogen dioxide.19 Therefore, doping graphene can improve its gas sensitivity to some extent.
By employing graphite fluoride as the raw material, graphite fluoride was oxidised by using the improved Hummers method and then the oxidised graphite fluoride was exfoliated using a liquid-phase exfoliation method, so as to prepare fluorinated graphene. Furthermore, the gas sensitivity of the prepared fluorinated graphene was investigated. The prepared fluorinated graphene has great potential for detection field of gas sensitivity.
2 Experimental work
2.1 Reagents and instruments
Graphite fluoride, with 45% fluorine content produced by Shanghai Carfluor Chemicals Co., Ltd, China, and graphene produced by Qingdao Haoxin New Energy Technology Co., Ltd, China, was used in these experiments. In addition, the reagents included concentrated sulphuric acid (mass fraction, 98%), analytically pure concentrated phosphoric acid, analytically pure potassium permanganate, hydrochloric acid (mass friction, 30%), hydrogen peroxide solution (mass fraction, 30%), and deionised water.The Escalab 250Xi X-ray photoelectron spectrometer (XPS) with an Al-Kα light source produced in the USA was used for determination and the X-Pert POR X-ray diffractometer (XRD) produced in the Netherlands, with a scanning range of 5 to 80° was used for X-ray diffraction analysis. The H-7650 transmission electron microscope (TEM) with resolution of 0.2 nm produced by Hitachi Ltd, Japan was also used. Furthermore, the Micro Nano AFM-III atomic force microscope (AFM) manufactured by Shanghai Zhuolun Micro Nano Equipment Co., Ltd, China with a scanning range of 8 μm × 8 μm and 512 × 512 image sampling points was used. The S-4800 scanning electron microscope (SEM) (Hitachi Ltd, Japan) was used and its resolution was 3.0 nm.
To study the gas sensitivity of fluorinated graphene, a test system for gas sensitivity was designed, which mainly consisted of a computer, a KGS detection system for gas sensitivity, a test bottle for gas sensitivity, and gas sensors (Fig. 1). A gas source was injected into the test bottle statically (Fig. 1a). Gas sensors were of the heater type and gas sensing materials were smeared on ceramic tubes, as displayed in the enlarged picture of the sensors (Fig. 1b). Gas sensing materials were connected with terminals through conductive rings and the hollow ceramic tubes were pierced with tungsten wires so as to adjust the test temperature, thus allowing the gas sensing materials to be in an optimal state for gas sensitivity testing. Signals from the gas sensors received by the KGS detection system for gas sensitivity were changed into resistance signals, and then, signals were sent to the computer which displayed any changes in the resistance of the gas sensors. With respect to the production process used for these gas sensors, ceramic tubes were washed with alcohol and deionised water and then oven-dried for later use.
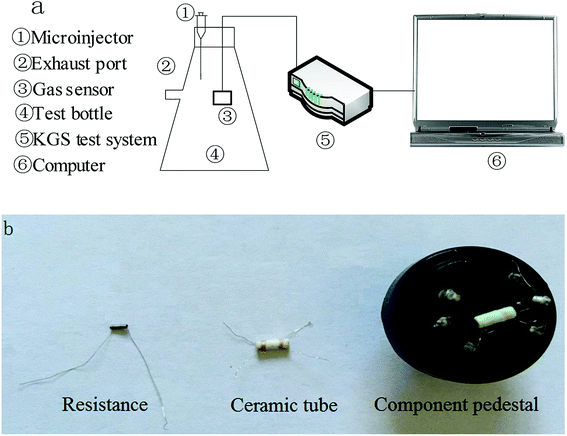 | ||
| Fig. 1 Test system for gas sensitivity. (a) Connection of test system for gas sensitivity. (b) Physical map of a gas sensor and its components. | ||
2.2 Sample preparation
The fluorinated graphene preparation process was as follows: an ice-water bath was prepared before the experiment and 10 mL phosphoric acid and 120 mL concentrated sulphuric acid were poured into a three-necked flask.Fluorinated graphene was prepared from graphite fluoride by improved Hummers method. The temperature of the mixed acid in the three-necked flask was controlled to remain below 2 °C. Moreover, 0.5 g of graphite fluoride was added to the solution and stirred for 30 min. A total of 6 g of potassium permanganate was then added in three doses (2 g per dose) at 10 minutes intervals: the mixed solution in the three-necked flask was maintained at a temperature of less than 2 °C during dosing. After 30 min, the temperature of the water bath was slowly increased to 50 °C and then the solution was stirred continuously for 8 h at this temperature. After the reaction, when the mixed solution was cooled to room temperature, a certain amount of hydrogen peroxide solution was added to remove the incompletely reacted potassium permanganate. After cooling to room temperature, 10 mL (5%) hydrochloric acid were added. The mixed solution was washed to neutral pH by using deionised water, followed by high-speed centrifugation for 20 min at 5000 rpm. Thereafter, the sediments were collected and put into a polar organic solution before ultrasonication for 10 min. Thereafter, the solution was centrifuged at 10![[thin space (1/6-em)]](https://www.rsc.org/images/entities/char_2009.gif) 000 rpm. After removing the sediments, the materials suspended in the solution were the desired fluorinated graphene and the solution was frozen, dried, and packed for later use.
000 rpm. After removing the sediments, the materials suspended in the solution were the desired fluorinated graphene and the solution was frozen, dried, and packed for later use.
A certain amount of absolute ethanol was dropped into the prepared fluorinated graphene to change the grout into a paste. This fluorinated graphene paste was smeared onto the dried ceramic tubes and then dried at 60 °C. After drying, aging treatment with a DC regulated power supply was conducted and resistance changes of the sensors, after aging treatment, were assessed by using the detection system for gas sensitivity.
The sensitivity is given by:
| S = (Rg − Ra)/Ra | (1) |
Sensitivity reflects the condition of gas sensor's sensitivity to gas. The higher the sensitivity is, the better the sensitivity to gas is. Conversely, the lower the sensitivity is, the worse the sensitivity to the gas is.
3 Results and discussion
3.1 Crystal structure and microscopic morphology of fluorinated graphene
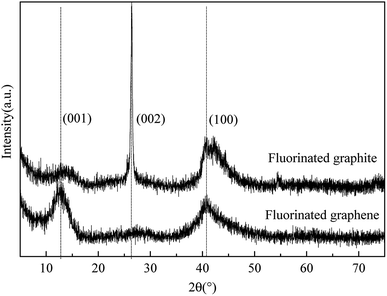
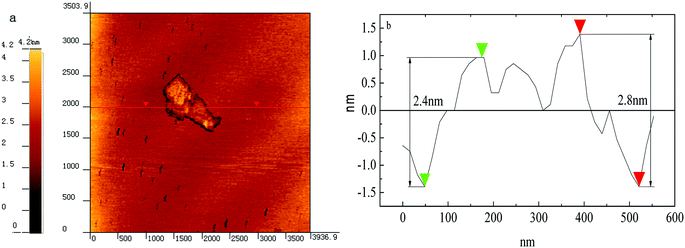
Fluorinated graphene was prepared by using the improved Hummers method. By taking graphite fluoride as a control, crystal structures of prepared fluorinated graphene and graphite fluoride were characterised through X-ray diffraction. Fig. 2 shows the XRD spectra of fluorinated graphene and graphite fluoride: two broad and plane peaks and one sharp, narrow peak are found in the XRD diagram of graphite fluoride. 2θ was located at 12.35°, 26.5°, and 41.5°, respectively, which corresponded to diffraction of crystal faces (001), (002), and (004) in the graphite fluoride. The most significant difference between fluorinated graphene and graphite fluoride is that the diffraction peak of the former disappears at 2θ = 26.5°, where the inter-planar crystal spacing is d = 3.34 Å. Fluorinated graphene exhibits a strong adsorption peak at 2θ = 12.35°, where the inter-planar crystal spacing is d = 7.24 Å, some 3.9 Å greater than that of graphite fluoride.20 The diffraction peaks of graphite fluoride and fluorinated graphene are basically the same at 2θ = 41.5°: this indicates that fluorinated graphene shows the same structure as graphite fluoride on other crystal faces. The research verified that the improved Hummers method can enlarge inter-planar crystal spacings.To characterise the microscopic morphology of fluorinated graphene more intuitively, TEM and AFM tests on fluorinated graphene were carried out (Fig. 3 and 4). Fig. 3a shows the low-magnification TEM image of fluorinated graphene and shows that fluorinated graphene exhibits transparent winkles. The main reason for this is that fluorinated graphene is thin and its surface energy is reduced through curls and wrinkles, thus reaching thermodynamic stability easily. A high-resolution TEM image of fluorinated graphene is shown in Fig. 3b. Five obvious boundary lines appear along the boundary of fluorinated graphene which support speculation to the effect that the fluorinated graphene had 5 layers. Fig. 4 shows an AFM image of fluorinated graphene. Fig. 4a shows the scanning range of fluorinated graphene and Fig. 4b is a section. It is known from Fig. 4b that the layer thickness of this fluorinated graphene was 2.4 to 2.8 nm. The prepared fluorinated graphene is thinner with fewer layers.
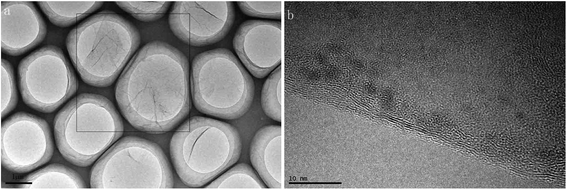 | ||
| Fig. 3 TEM images of fluorinated graphene (a) low-magnification TEM image of fluorinated graphene (b) high-resolution TEM image of fluorinated graphene. | ||
Fluorinated graphene was prepared by using the improved Hummers method. Based on XRD, fluorinated graphene disappeared on crystal face (002), while strengthened on crystal face (001). This indicated that the fluorinated graphene was well exfoliated. Obvious contour lines, and about 5 layers, can be seen in the high-resolution TEM image.
3.2 Elemental composition and chemical structures of fluorinated graphene
Aiming to study element compositions and structures of functional groups in fluorinated graphene, SEM energy spectra and infrared spectra of fluorinated graphene were analysed (Fig. 5 and 6).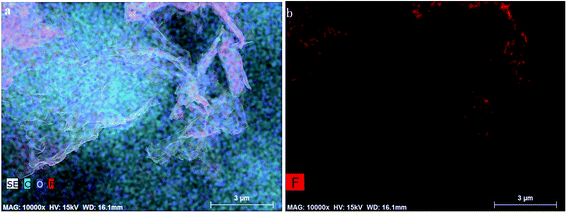 | ||
| Fig. 5 Element distributions in fluorinated graphene detected using SEM energy spectra (a) distributions of all elements in fluorinated graphene (b) distributions of fluorine in fluorinated graphene. | ||
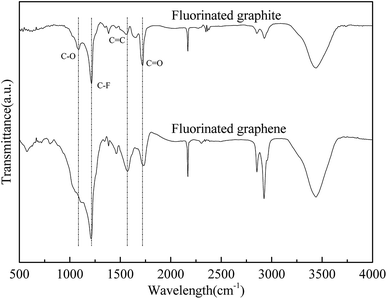
It can be seen from Fig. 5 that three elements (C, F, and O) were present in fluorinated graphene. The F content is low where there were fewer less layers in the fluorinated graphene, while it was high where there were more layers. In Fig. 6, vibration peaks of C–O, C–F, C![[double bond, length as m-dash]](https://www.rsc.org/images/entities/char_e001.gif) C, and C
C, and C![[double bond, length as m-dash]](https://www.rsc.org/images/entities/char_e001.gif) O are seen at 1081 to 1113, 1214 to 1219, 1562 to 1574, and 1718 to 1737 cm−1, respectively.21,22 In particular, the strength of the stretching vibrations of C–O and C
O are seen at 1081 to 1113, 1214 to 1219, 1562 to 1574, and 1718 to 1737 cm−1, respectively.21,22 In particular, the strength of the stretching vibrations of C–O and C![[double bond, length as m-dash]](https://www.rsc.org/images/entities/char_e001.gif) O in fluorinated graphene was greater than that of graphite fluoride and the increased amplitude of C–O vibration was much greater than that of C
O in fluorinated graphene was greater than that of graphite fluoride and the increased amplitude of C–O vibration was much greater than that of C![[double bond, length as m-dash]](https://www.rsc.org/images/entities/char_e001.gif) O. This indicated that oxygen-containing functional groups are doped, mainly in the form of C–O groups, when preparing fluorinated graphene.
O. This indicated that oxygen-containing functional groups are doped, mainly in the form of C–O groups, when preparing fluorinated graphene.
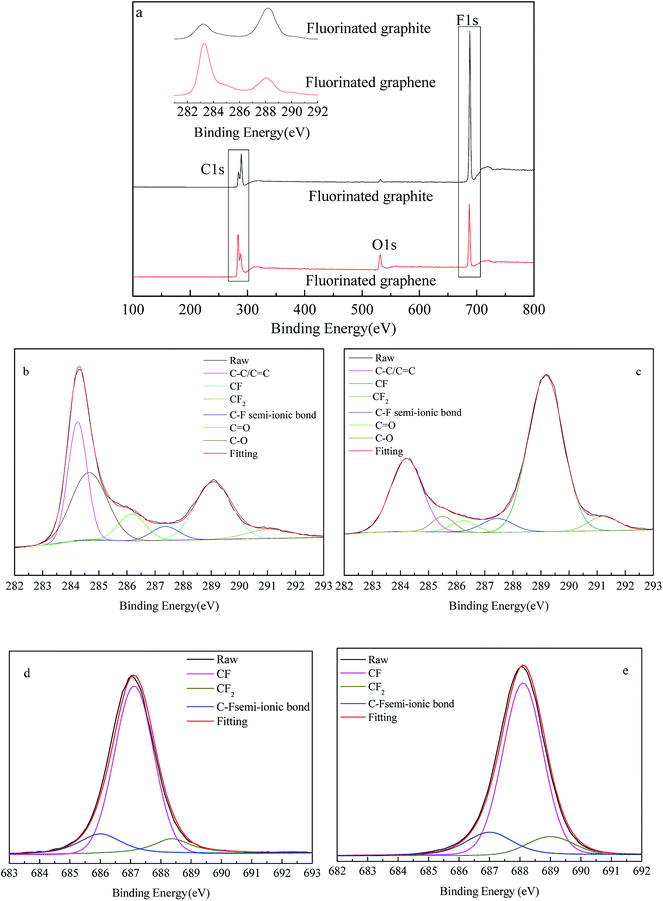
To determine how fluorine atoms are lost in the preparation of fluorinated graphene, fluorinated graphene and graphite fluoride were subjected to XPS analysis. XPS spectra and XPS-peak-differentiation-imitating of C1s and F1s peaks are shown in Fig. 7 and the elemental composition, based on XPS analysis, is summarised in Table 1. Moreover, comparisons of changes in carbon-containing and fluorine-containing functional groups are summarised in Tables 2 and 3 respectively.
| Element | Sample | Difference value | |
|---|---|---|---|
| Graphite fluoride | Fluorinated graphene | ||
| C | 58.31 | 75.4 | −17.09 |
| O | 1.3 | 8.79 | −7.49 |
| F | 40.39 | 15.81 | 24.58 |
| Chemical bond | Sample | Difference value (the difference between content 1 and content 2) | ||||
|---|---|---|---|---|---|---|
| Graphite fluoride | Fluorinated graphene | |||||
| Energy (ev) | Content 1 (%) | Energy (ev) | Content 2 (%) | |||
| C1s | C–C/C![[double bond, length as m-dash]](https://www.rsc.org/images/entities/char_e001.gif) C C |
284.22 | 24.96 | 284.24 | 27.3 | −2.35 |
| CF | 289.17 | 58.81 | 289.07 | 25.07 | 33.74 | |
| CF2 | 291.23 | 4.62 | 291.09 | 5.07 | −0.46 | |
| C–F semi-ionic bond | 287.44 | 4.69 | 287.36 | 4.61 | 0.08 | |
C![[double bond, length as m-dash]](https://www.rsc.org/images/entities/char_e001.gif) O O |
286.25 | 3.22 | 286.18 | 8.77 | −5.55 | |
| C–O | 285.51 | 3.71 | 284.66 | 29.18 | −25.47 | |
| Chemical bond | Sample | Difference value (the difference between content 1 and content 2) | ||||
|---|---|---|---|---|---|---|
| Fluorinated graphite | Fluorinated graphene | |||||
| Energy (ev) | Content 1 (%) | Energy (ev) | Content 2 (%) | |||
| F1s | CF | 688.1 | 80.01 | 687.1 | 76.79 | 3.22 |
| CF2 | 689.0 | 8.78 | 688.4 | 10.08 | −1.30 | |
| C–F semi-ionic bond | 687.0 | 11.21 | 686.0 | 13.13 | −1.92 | |
It can be seen from full spectra in Fig. 7a that the O1s peak of graphite fluoride is small and weak at 527 to 532 eV, while that of fluorinated graphene is sharp and strong. Based on the element contents detected through XPS analysis of fluorinated graphene and graphite fluoride in Table 1, the O-content in fluorinated graphene is 8.79%, while that in graphite fluoride is 1.30%. The O-content increases by 7.49%, while that of F decreases from 40.39% to 15.81%. However, the elemental C-content in fluorinated graphene increases by 17.09%, indicating that some C–F bonds are broken and oxygen-containing groups are introduced in the preparation of fluorinated graphene. Fig. 7b and c show XPS-peak-differentiation-imitating of C1s peaks of fluorinated graphene and graphite fluoride. The fitting peaks of C–C/C![[double bond, length as m-dash]](https://www.rsc.org/images/entities/char_e001.gif) C, C–F, C–F2, C–F semi-ionic bond, C–O, and C
C, C–F, C–F2, C–F semi-ionic bond, C–O, and C![[double bond, length as m-dash]](https://www.rsc.org/images/entities/char_e001.gif) O appear at 284.22 to 284.24 eV, 289.07 to 289.17 eV, 291.09 to 291.23 eV, 287.36 to 287.44 eV, 286.18 to 286.25 eV, and 284.66 to 285.51 eV, respectively.23–26 According to the relative amounts of C–F/C1s, C
O appear at 284.22 to 284.24 eV, 289.07 to 289.17 eV, 291.09 to 291.23 eV, 287.36 to 287.44 eV, 286.18 to 286.25 eV, and 284.66 to 285.51 eV, respectively.23–26 According to the relative amounts of C–F/C1s, C![[double bond, length as m-dash]](https://www.rsc.org/images/entities/char_e001.gif) O/C1s, and C–O/C1s listed in Table 2, the C–F-content decreases by 33.74%, while that of C
O/C1s, and C–O/C1s listed in Table 2, the C–F-content decreases by 33.74%, while that of C![[double bond, length as m-dash]](https://www.rsc.org/images/entities/char_e001.gif) O and C–O increase by 5.55% and 25.47%, separately. Moreover, the growing amplitude of the C–O peak is larger than that of C
O and C–O increase by 5.55% and 25.47%, separately. Moreover, the growing amplitude of the C–O peak is larger than that of C![[double bond, length as m-dash]](https://www.rsc.org/images/entities/char_e001.gif) O, which coincides with infrared spectral analysis data. This implies that some instable C–F bonds change into C–O and C
O, which coincides with infrared spectral analysis data. This implies that some instable C–F bonds change into C–O and C![[double bond, length as m-dash]](https://www.rsc.org/images/entities/char_e001.gif) O in the presence of strong oxidants, while C–F2 and C–F semi-ionic bonds change slightly. Fig. 7d and e show XPS-peak-differentiation-imitating of F1s peaks of fluorinated graphene and graphite fluoride. The fitting peaks of C–F semi-ionic bond, C–F and C–F2 appear at 686.0–687.0 eV, 687.1–688.1 eV and 688.4–689.0 eV respectively.27 According to the data in Table 3, the C–F semi-ionic bond and C–F2 bond content change slightly in the F1s peak and the change in the C–F bond content is the largest. Therefore, the loss of fluorine mainly resulted from the fracture of C–F bonds in the preparation of fluorinated graphene.
O in the presence of strong oxidants, while C–F2 and C–F semi-ionic bonds change slightly. Fig. 7d and e show XPS-peak-differentiation-imitating of F1s peaks of fluorinated graphene and graphite fluoride. The fitting peaks of C–F semi-ionic bond, C–F and C–F2 appear at 686.0–687.0 eV, 687.1–688.1 eV and 688.4–689.0 eV respectively.27 According to the data in Table 3, the C–F semi-ionic bond and C–F2 bond content change slightly in the F1s peak and the change in the C–F bond content is the largest. Therefore, the loss of fluorine mainly resulted from the fracture of C–F bonds in the preparation of fluorinated graphene.
Based on the comprehensive analysis, the improved Hummers method can be used to prepare fluorinated graphene. Fluorinated graphene has about 5 layers and the content of elemental fluorine in fluorinated graphene is 15.81%. Carbon and fluorine are combined as C–F and C–F2and elemental fluorine is mainly lost in the form of C–F in graphite fluoride during the preparation of fluorinated graphene.
3.3 Gas sensing
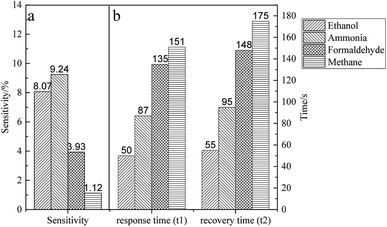
To investigate the gas sensitivity of fluorinated graphene, a gas sensitivity test was conducted using 200 ppm methanol, ammonia, formaldehyde, and methane with test temperature 150 °C and a current of 80 μA. The test results are shown in Fig. 8.It can be seen from Fig. 8a that fluorinated graphene exhibits different responses to the four gases. The response sensitivities to ethanol and ammonia are 8.07% and 9.24%, showing a relatively high sensitivity. Fig. 8b demonstrates the response time t1 and recovery time t2 of fluorinated graphene to the four gases, and ethanol and ammonia show the shortest response times of 50 s and 87 s, respectively. From the perspective of recovery time, fluorinated graphene presents the shortest recovery time for ethanol and ammonia (55 s and 95 s). To discuss further the gas sensitivity of fluorinated graphene, and considering the sensitivity, response time, and recovery time of fluorinated graphene to the four aforementioned gases, the gas sensing properties of fluorinated graphene were further explored by using ammonia. The optimal working temperature of fluorinated graphene to ammonia-detection was determined, as well as the sensitivity of fluorinated graphene to different concentrations of ammonia.
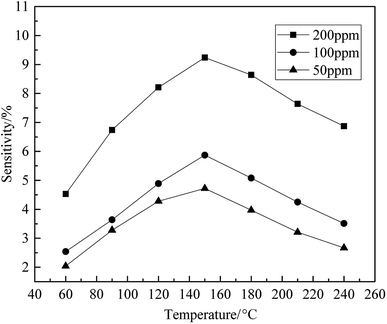
To explore the optimal working temperature of fluorinated graphene to ammonia, seven temperature points were selected to determine three concentrations of ammonia and the results are shown in Fig. 9. It can be seen from Fig. 9, the sensitivity of fluorinated graphene changes significantly under different working temperatures. At 200 ppm, the optimal working temperature of fluorinated graphene is 150 °C. At working temperatures of less than 150 °C, the sensitivity of fluorinated graphene increases with working temperature, while it decreases with increases in working temperature when the working temperature is greater than 150 °C. The relationship between gas sensitivity to ammonia at concentrations of 100 ppm and 50 ppm, and working temperature, is consistent with that to ammonia at a concentration of 200 ppm.
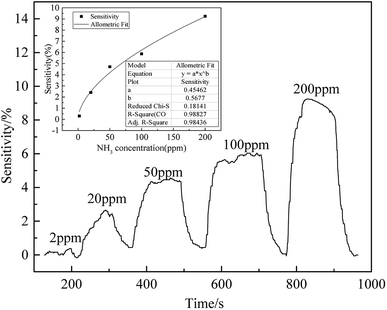
Aiming to discuss the sensitivity of fluorinated graphene to ammonia with different concentrations, ammonia, at concentrations of 2 ppm, 20 ppm, 50 ppm, 100 ppm, and 200 ppm were used in a gas sensitivity test at 150 °C and the results are shown in Fig. 10. It can be seen from Fig. 10, with increasing ammonia concentration, the response of fluorinated graphene to ammonia becomes more significant. For ammonia at a concentration of 2 ppm, the sensitivity is 0.3%, while the response value of fluorinated graphene is 2.41% as the ammonia concentration rises to 20 ppm. Furthermore, at ammonia concentrations of 50 ppm, 100 ppm, and 200 ppm, the response values of fluorinated graphene are 4.72%, 5.87%, and 9.24%, respectively. It shows that the response of fluorinated graphene to ammonia is approximately linear with y = 0.45462x0.5677 and R2 = 0.98436.
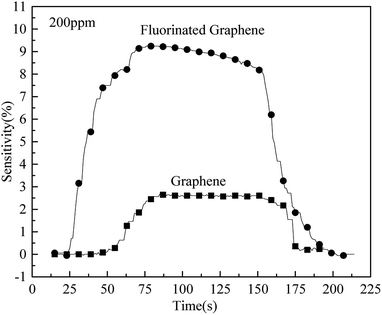
The sensitivities of fluorinated graphene and graphene to ammonia at a concentration of 200 ppm were tested at 150 °C. The test results are displayed in Fig. 11 where it can be seen that the extreme values of sensitivities of fluorinated graphene and graphene are 9.24% and 2.60%, respectively. The sensitivity of fluorinated graphene to ammonia is 3.5 times than that of graphene to ammonia. This is because the introduction of F atoms reduces the Fermi level of graphene.28 When ammonia is physically adsorbed, fluorinated graphene, with a low Fermi level, undergoes a significant increase therein and its resistance changes significantly, thus showing a higher sensitivity. On the other hand, it can be known from Fig. 7a, d, and e that the binding energy of graphite fluoride is 688.1 eV and that of fluorinated graphene is 687.1 eV. There was a 1 eV decrease in the binding energy of fluorinated graphene. The binding energy of F and C decreased and the electronic activity improved. It is deduced that gas transport electrons become easier and fluorinated graphene shows higher gas sensitivity.
Sensor performances of the studied OFG were compared with published data for fluorinated graphene (FG)19,29 and epitaxial and CVD graphenes samples30 (Table 4). The gas sensitivity of this study is between ref. 29 and literature 19 and 30. The sensitivity of this study is not high, but the response and recovery time of this study is very short. It can be seen that the working temperature has great influence on response and recovery time.
| Material | Concentration (ppm) | Relative response, % | Response time, s | Recovery time, s | Experimental temperature | Reference |
|---|---|---|---|---|---|---|
| OFG | 200 | 9.24 | 87 | 95 | 150 °C | Current work |
| rFG | 100 | 42 | 330 | 1100 | Room temperature | 19 |
| rOFG | 100 | 20 | 690 | 2500 | Room temperature | 19 |
| FG | 100 | 5 | 220 | 500 | Room temperature | 29 |
| CVD-G | 200 | 60 | 7200 | 7200 | Room temperature | 30 |
Fluorinated graphene is a P-type semiconductor and its carriers are holes.31 When ammonia is adsorbed on the surface of such materials, owing to ammonia being a reducing gas, ammonia diffuses to the surface of fluorinated graphene to provide electrons and occupy holes in fluorinated graphene, resulting in an increased resistance of the fluorinated graphene.14,28 When the concentration of ammonia increases, the more the electrons are provided by ammonia to the fluorinated graphene, the more the holes in the fluorinated graphene are occupied, thus leading to a more obvious increase in its resistance. When in an environment that is free from ammonia, any ammonia molecules adsorbed on the fluorinated graphene are separated from the surface thereof due to its own thermodynamic movement and electrons provided for fluorinated graphene are removed. Holes in the fluorinated graphene reappear, i.e., desorption occurs.
In conclusion, fluorinated graphene exhibits good gas sensitivity to ammonia. The reasons are as follows: firstly, the space in the exfoliated fluorinated graphene increases and can be used as an effective channel for gas diffusion, which is conducive to the rapid diffusion of ammonia on the surface of the fluorinated graphene. Secondly, due to the doping of fluorine elements, the band gap of the fluorinated graphene increases and its gas sensitivity increases. Furthermore, oxygen-containing functional groups (such as C–O and C![[double bond, length as m-dash]](https://www.rsc.org/images/entities/char_e001.gif) O) are present in the fluorinated graphene. These functional groups act with the ammonia molecules in a manner unfavourable to gas desorption, thus causing the recovery time of fluorinated graphene to exceed its response time.
O) are present in the fluorinated graphene. These functional groups act with the ammonia molecules in a manner unfavourable to gas desorption, thus causing the recovery time of fluorinated graphene to exceed its response time.
4 Conclusions
This study prepared fluorinated graphene by using the improved Hummers method and investigated the gas sensitivity of the fluorinated graphene. The key conclusions are as follows:(1) By taking graphite fluoride as the raw material, fluorinated graphene was prepared through ultrasonic exfoliation based on the intercalation and oxidation of the improved Hummers method. Based on XRD, TEM, and AFM analysis of the fluorinated graphene, the prepared fluorinated graphene was found to have had approximately 5 layers. The fluorine content in this fluorinated graphene was 15.81% and decreased compared with that of graphite fluoride. Through XPS analysis, it was found that the C–F bond content in fluorinated graphene decreased compared with that in graphite fluoride, which was the main mode of loss of elemental fluorine.
(2) Through an assay of the gas sensitivity of fluorinated graphene, different sensitivities and response times to ethanol, ammonia, methane, and formaldehyde gases were found. It was most sensitive to ammonia. At an ammonia concentration of 200 ppm, and a working temperature of 150 °C, the sensitivity of fluorinated graphene to ammonia is 9.24%, the sensitivity of fluorinated graphene to ammonia is 3.5 times than that of graphene to ammonia. Moreover, the doping of fluorine atoms was beneficial to the improvement of the gas sensitivity of this fluorinated graphene.
Conflicts of interest
There are no conflicts to declare.Acknowledgements
This work was financially supported by the National Science & Technology Pillar Program of China (2013BAE04B00).References
- Z. F. Wang, J. Wang, Z. Li, P. Gong, J. Ren, H. Wang, X. Han and S. Yang, RSC Adv., 2012, 31, 11681–11686 RSC.
- R. R. Nair, W. C. Ren, R. Jalil, I. Riaz, V. G. Kravets, L. Britnell, P. Blake, F. Schedin, A. S. Mayorov, S. Yuan, M. I. Katsnelson, H. M. Cheng, W. Strupinski, L. G. Bulusheva, A. V. Okotrub, I. V. Grigorieva, A. N. Grigorenko, K. S. Novoselov and A. K. Geim, Small, 2010, 24, 2877–2884 CrossRef PubMed.
- H. Sahin, M. Topsakal and S. Ciraci, Phys. Rev. B: Condens. Matter, 2011, 83, 1341–1344 CrossRef.
- L. Y. Pu, Y. J. Ma, H. L. Hu and C. H. Pei, J. Southwest Univ. Sci. Technol., 2012, 27, 18–22 Search PubMed.
- J. T. Robinson, J. S. Burgess, C. E. Junkermeier, S. C. Badescu, T. L. Reinecke, F. K. Perkins, M. K. Zalalutdniov, J. W. Baldwin, J. C. Culbertson, P. E. Sheehan and E. S. Snow, Nano Lett., 2010, 10, 3001–3005 CrossRef PubMed.
- Y. Wang, W. C. Lee, K. K. Manga, P. K. Ang, J. Lu, Y. P. Liu, C. T. Lim and K. P. Loh, Adv. Mater., 2012, 24, 4285–4290 CrossRef PubMed.
- P. Gong, Z. Wang, J. Wang, H. Wang, Z. Li, Z. Fan, Y. Xu, X. Han and S. Yang, J. Mater. Chem., 2012, 22, 16950–16956 RSC.
- A. Mathkar, T. N. Narayanan, L. B. Alemany, P. Cox, P. Nguyen, G. Gao, P. Chang, R. R. Aburto, S. A. Mani and P. M. Ajayan, Part. Part. Syst. Charact., 2013, 30, 266–272 CrossRef.
- N. A. Nebogatikova, I. V. Antonova, V. Ya. Prinz, I. I. Kurkina, V. I. Vdovin, G. N. Aleksandrov, V. B. Timofeev, S. A. Smagulova, E. R. Zakirova and V. G. Keslera, Phys. Chem. Chem. Phys., 2015, 17, 13257–13266 RSC.
- N. A. NebogatikoVa, I. V. Antonova, V. A. Volodin and V. Y. Primz, Phys. E, 2013, 52, 106–111 CrossRef.
- Z. F. Wang, J. Q. Wang, Z. P. Li, P. W. Gong, X. H. Liu, L. B. Zhang, J. F. Ren, H. G. Wang and S. R. Yang, Carbon, 2012, 50(15), 5403–5410 CrossRef.
- I. V. Antonova, I. A. Kotin, I. I. Kurkina, A. I. Ivanov, E. A. Yakimchuk, N. A. Nebogatikova, V. I. V. dovin, A. K. Gutakovskii and R. A. Soots, J. Mater. Sci. Eng., 2017, 6(5), 379 Search PubMed.
- H. Zhang, L. W. Fan, H. L. Dong, P. P. Zhang, K. Q. Nie, J. Zhong, Y. Y. Li, J. H. Guo and X. H. Sun, ACS Appl. Mater. Interfaces, 2016, 8, 13 Search PubMed.
- F. Schedin, A. K. Geim, S. V. Morozov, E. W. Hill, P. Blake, M. I. Katsnelson and K. S. Novoselov, Nat. Mater., 2007, 6, 652–655 CrossRef PubMed.
- R. Hou, T. Peng, H. Sun and H. Liu, Adv. Funct. Mater., 2015, 46, 16079–16085 Search PubMed.
- J. Dai, J. Yuan and P. Giannozzi, Appl. Phys. Lett., 2009, 95, 183 Search PubMed.
- V. I. Sysoev, L. G. Bulusheva, I. P. Asanov, Y. V. Shubin and A. V. Okotrub, Phys. Status Solidi B, 2016, 253(12), 2492–2498 CrossRef.
- M. V. Katkov, V. I. Sysoev, A. V. Gusel'nikov, I. P. Asanov, L. G. Bulusheva and A. V. Okotrub, Phys. Chem. Chem. Phys., 2015, 17, 444–450 RSC.
- V. I. Sysoev, A. V. Okotrub, I. P. Asanov, P. N. Gevko and L. G. Bulusheva, Carbon, 2017, 118, 225–232 CrossRef.
- L. Zhang, J. Yu, M. Yang, Q. Xie, H. L. Peng and Z. F. Liu, Nat. Commun., 2013, 4, 1443 CrossRef PubMed.
- V. Gupta, T. Nakajima, Y. Ohzawa and B. Žemva, Mol. Cryst. Liq. Cryst., 2002, 386, 25–31 CrossRef.
- X. Zhang, Y. Feng, D. Huang, Y. Li and W. A. Feng, Carbon, 2010, 48, 3236–3241 CrossRef.
- T. Nakajima, Y. Matsuo, S. Kasamatsu and K. Nakanishi, Carbon, 1994, 32, 1177–1180 CrossRef.
- Y. Matsuo and T. Nakajima, Z. Anorg. Allg. Chem., 1995, 621, 1943–1950 CrossRef.
- Z. Sui, X. Zhang, Y. Lei and Y. J. Luo, Carbon, 2011, 49, 4314–4321 CrossRef.
- Q. Feng, Q. Cao, M. Li, F. C. Liu, N. J. Tang and Y. W. Du, Appl. Phys. Lett., 2013, 102, 279 Search PubMed.
- F. G. Zhao, G. Zhao, X. H. Liu, C. W. Ge, J. T. Wang, B. L. Li, Q. G. Wang, W. S. Li and Q. Y. Chen, J. Mater. Chem. A, 2014, 2, 8782–8789 RSC.
- J. S. Im, S. C. Kang, B. C. Bai, T. S. Bae, S. J. In, E. Jeong, S. H. Lee and Y. S. Lee, Carbon, 2011, 49, 2235–2244 CrossRef.
- H. Zhang, L. W. Fan, H. L. Dong, P. P. Zhang, K. Q. Nie, J. Zhong, Y. Y. Li, J. H. Guo and X. H. Sun, ACS Appl. Mater. Interfaces, 2016, 8, 8652–8661 CrossRef PubMed.
- F. Yavari, E. Castillo, H. Gullapalli, P. M. Ajayan and N. Koratkar, Appl. Phys. Lett., 2012, 100(20), 301 CrossRef.
- A. P. Lee and B. J. Reedy, Sens. Actuators, B, 1999, 60, 35–42 CrossRef.
| This journal is © The Royal Society of Chemistry 2018 |

