DOI:
10.1039/C8RA03430C
(Paper)
RSC Adv., 2018,
8, 21340-21353
Investigation of the reaction pathway for synthesizing methyl mercaptan (CH3SH) from H2S-containing syngas over K–Mo-type materials†
Received
21st April 2018
, Accepted 4th June 2018
First published on 12th June 2018
Abstract
The reaction pathway for synthesizing methyl mercaptan (CH3SH) using H2S-containing syngas (CO/H2S/H2) as the reactant gas over SBA-15 supported K–Mo-based catalysts prepared by different impregnation sequences was investigated. The issue of the route to produce CH3SH from CO/H2S/H2 has been debated for a long time. In light of designed kinetic experiments together with thermodynamics analyses, the corresponding reaction pathways in synthesizing CH3SH over K–Mo/SBA-15 were proposed. In the reaction system of CO/H2S/H2, COS was demonstrated to be generated firstly via the reaction between CO and H2S, and then CH3SH was formed via two reaction pathways, which were both the hydrogenation of COS and CS2. The resulting CH3SH was in a state of equilibrium of generation and decomposition. Decomposition of CH3SH was found to occur via two reaction pathways; one was that CH3SH first transformed into two intermediates, CH3SCH3 and CH3SSCH3, which were then further decomposed into CH4 and H2S; another was the direct decomposition of CH3SH into C, H2S and H2. Moreover, the catalyst (K–Mo/SBA-15) prepared with co-impregnation exhibits higher catalytic activities than the catalysts (K/Mo/SBA-15 and Mo/K/SBA-15) prepared by the sequence of impregnation. Based on characterization of the oxidized, sulfided and spent catalysts via N2 adsorption–desorption isotherms, XRD, Raman, XPS and TPR, it was found that two K-containing species, K2Mo2O7 and K2MoO4, were oxide precursors, which were then converted into main K-containing MoS2 species. The CO conversion was closely related to the amount of edge reactive sulfur species that formed the sulfur vacancies over MoS2 phases.
Introduction
The exorbitant emissions of reduced sulfur species (H2S, COS and CS2) together with carbon-containing compound CO from reduced industrial flue gases into the atmosphere would be potentially responsible for the increasingly serious environment pollution (haze and acid rain), which is threatening human survival and health in most developing countries. At present, most methods for utilizing sulfur and carbon species from reduced industrial flue gases are independent.1,2 This indicates that the reduced sulfur species are firstly removed via various methods.3,4 Then, the purified carbon species would be used to produce chemical products (such as alcohols).5,6 Herein, a feasible route to synergistically utilize hydrogen sulfide (H2S) together with syngas (CO/H2) for synthesizing a high value-added product, methanethiol (CH3SH), is promising (eqn (1)).7,8 CH3SH is one of the urgently important chemical intermediates for producing organic sulfur compounds in poultry feed, medicine, pesticides and so on,9,10 and large scale production of methanethiol is generally based on the thiolation of H2S with methanol (CH3OH) from syngas.11,12 This one-step conversion of the industry gas contained sulfur species to CH3SH not only decreases the consumption of clean fuel (CH3OH)13 but also could co-recycle acid gas (H2S) and the low-cost and wide-range sources of synthesis gas (CO/H2), which exhibits the increasingly favorable economies and has attracted considerable attentions in the industrial applications.14,15| | |
CO + H2S + 2H2 → CH3SH + H2O
| (1) |
In general, alkali-promoted molybdenum (Mo) or tungsten (W) based materials have been widely used as the effective active catalysts for synthesizing CH3SH9,16,17 and alumina (Al2O3) and silicon dioxide (SiO2) were selected as the supports for loading and dispersing these Mo (or W) containing active phases.15,18,19 However, the low catalytic activity and selectivity are obtained for these alkali-promoted Mo (or W) based catalysts, which leads to the hardly realization of harmlessness and resource utilization. In general, two significant factors are still in a controversial state, i.e., the presence of complex reaction network as well as the uncertain reactive phases, which makes it difficult to further improve the catalytic activity. The comprehensive of reactive active phases will be given in the future. Therefore, this work is focus on the investigation of the reaction pathway.
The well understanding of reaction network would provide essential insight into the comprehending of reaction mechanism, and could further promote the catalytic performances. Several reaction networks have been proposed by different groups over the K–Mo (K–W) based catalysts. Employing mixtures (CO/H2S/H2) as reaction system to synthesize CH3SH can be traced back to 1960s by Olin et al.8 who found that the overall reaction process was followed by eqn (1). Afterwards, Barrault and Yang's16,19 pointed out that CO molecule was firstly reacted with H2S to form COS, and then the hydrogenation of COS generated CH3SH and H2O. This reaction pathway has been considered as the mainstream reaction for a long time, while some matters such as H2O are not detected, making it difficult to confirm the reaction network. Other research groups20,21 reported that, based on the detected new matter of thiophene, the modified Fischer–Tropsch process followed by a surface polymerisation mechanism was deemed to be an alternative reaction pathway. Recently, Lercher and coworker22,23 investigated the synthesis of CH3SH using COS/H2/H2S as reactants over sulfide K2MoO4/SiO2, and serval skillful activity tests were performed to evaluate the reaction pathway. They considered that COS could decompose rapidly to CO and H2S, meanwhile, COS disproportionated to CO2 and CS2, then CS2, the reaction intermediate, was hydrogenated to CH3SH. In a word, the debate about the reaction pathway for synthesizing CH3SH has been continued because of the existence of a dozen reactions in this system. Therefore, it is challenging to completely understand the reaction network for converting CO/H2/H2S to CH3SH. Moreover, thermodynamic is a significant criterion for the degree of a chemical reaction to take place. A typical software of HSC Chemistry was usually applied to calculate the thermodynamic parameters to evaluate whether a reaction will occur, including enthalpy change, Gibbs free energy changes and equilibrium constant. However, since all the basic parameter about CH3SH is missing in the Database of HSC Chemistry software, the requirement for thermodynamic parameters of reactions containing CH3SH is urgent.
With a review of previous works, further studies on the reaction network for synthesizing CH3SH from CO/H2/H2S are still necessary to provide further documents. In our previous work, SBA-15 was used as a new silica based support due to its significant improvement in catalytic activity, selectivity and durability,24,25 and alkali metal K was selected to be one of the best additives.26 Thus, SBA-15 supported K–Mo based catalysts were prepared via different impregnation sequence to obtain the results of catalytic activity and to figure out the reaction pathway. Moreover, several designed experiments with different gas components were performed. The corresponding reaction routes were proposed, and the thermodynamic parameters were calculated to confirm the feasibility of the synthetic reactions.
Experimental selection
Catalysts preparation
SBA-15 was prepared by using nonionic triblock copolymer EO20PO70EO20 (Pluronic P123) and tetraethyl silicate TEOS as the structure-directing agent and silicon source, respectively, in according with our previous literatures.27,28 K–Mo/SBA-15 catalyst was prepared by SBA-15, (NH4)6Mo7O24·6H2O and K2CO3 via the incipient-wetness co-impregnation method, and the loading of Mo (based on MoO3) and molar ratios of K/Mo were 25 wt% and 2/1, respectively. After impregnation, the sample was dried at 120 °C for 24 h and subsequently calcined at 400 °C for 3 h in the air. K/Mo/SBA-15 and Mo/K/SBA-15 were carried out by a sequential impregnation. In a typical procedure, Mo/SBA-15 or K/SBA-15 was firstly prepared by incipient-wetness impregnation with (NH4)6Mo7O24·6H2O and K2CO3, respectively. Subsequently, calcined Mo/SBA-15 and K/SBA-15 were further used to synthesize K/Mo/SBA-15 or Mo/K/SBA-15 catalysts by incipient-wetness impregnation with K2CO3 and (NH4)6Mo7O24·6H2O, respectively. Finally, the obtained samples were pretreated as the procedure mentioned before. All the catalysts were denoted as oxidized samples.
Catalysts characterization
N2 adsorption–desorption isotherms were conducted on a Beckman Coulter's SA3100 automatic analyzer at −196 °C. BET surface area of the samples was performed by using BET method according to the data of adsorption branch, and the pore size distribution was calculated by the BJH method by using the desorption branch data. X-ray diffraction (XRD) patterns were recorded on a Japanese Rigaka's D/Max-1200 diffractometer using Cu Kα-radiation (λ = 0.154056 nm) at 40 kV and 30 mA. The evaluation of the diffractogram was made by MDI Jade 5.0 software to identify the crystalline phases within the catalysts. Raman spectrum was recorded by using a Via Reflex Raman spectrometer with 514 nm emission line from Ar+ laser at room temperature. X-ray photoelectron spectroscopy (XPS) technique was employed to determine the composition and chemical state of different elements using a PHI 5000 VersaProbe II with non-monochromatic Al Kα radiation (1486.6 eV). CasaXPS software was used to fit the corresponding spectra, and the charge referencing was detected against adventitious carbon with the C 1s at 284.6 eV. Temperature programmed reduction of hydrogen (H2-TPR) was conducted on the apparatus equipped with a TCD detector to measure the reactive surface sulfur species over sulfided MoS2 materials. Prior to H2-TPR measurement, 50 mg of sulfided samples were pretreated with the flow of Argon (Ar, 30 ml min−1) at 673 K for 1 h and then were cooled down to 373 K. Subsequently, a mixture of 10 vol% H2/Ar (30 ml min−1) was introduced and the pretreated samples were heated at a rate of 10 K min−1 to 1173 K.
Catalytic activity test
The catalytic activity experiments were carried out in a 6 mm i.d. quartz fixed-bed reactor. 0.4 g catalyst (40–60 mesh) mixed with quartz grains was secured with quartz wool in the isothermal region of the reactor. Then, the reactant gas (CO/H2S/H2 = 1![[thin space (1/6-em)]](https://www.rsc.org/images/entities/char_2009.gif) :
:![[thin space (1/6-em)]](https://www.rsc.org/images/entities/char_2009.gif) 5
5![[thin space (1/6-em)]](https://www.rsc.org/images/entities/char_2009.gif) :
:![[thin space (1/6-em)]](https://www.rsc.org/images/entities/char_2009.gif) 4) was introduced into the reactor under the conditions of P = 0.2 MPa, GHSV = 1000 h−1 with different reaction temperature (523–673 K). Prior to each activity evaluation measurements, all the samples were presulfided in the gas stream with CO/H2S/H2 = 1
4) was introduced into the reactor under the conditions of P = 0.2 MPa, GHSV = 1000 h−1 with different reaction temperature (523–673 K). Prior to each activity evaluation measurements, all the samples were presulfided in the gas stream with CO/H2S/H2 = 1![[thin space (1/6-em)]](https://www.rsc.org/images/entities/char_2009.gif) :
:![[thin space (1/6-em)]](https://www.rsc.org/images/entities/char_2009.gif) 5
5![[thin space (1/6-em)]](https://www.rsc.org/images/entities/char_2009.gif) :
:![[thin space (1/6-em)]](https://www.rsc.org/images/entities/char_2009.gif) 4 (30 ml min−1) at 553 K for 6 h. Those catalysts are denoted as sulfided samples. After the catalytic activity test, all the catalysts were denoted as spent samples. Reaction products were online detected using three GC fitted with one flame ionization detector (FID), two flame photometric detectors (FPD) and two thermal conductivity detectors (TCD). Carbon hydrogen components including CH3SH, CH4, little C2H4 and C2H6 were detected by FID with a porapak Q column. Two FPD equipping with the same HP-Plot/Q capillary column and two different volume of six-way valve were employed to detect different concentration (0.1 ppm to 150000 ppm) of sulfur-containing matters including COS, CS2, CH3SH and H2S. TCDs equipped with TDX-01 carbon molecular sieve and porapak Q column were used to detect H2, CO, CO2 and H2O. The CO conversion and products selectivity were calculated by the following equation:
4 (30 ml min−1) at 553 K for 6 h. Those catalysts are denoted as sulfided samples. After the catalytic activity test, all the catalysts were denoted as spent samples. Reaction products were online detected using three GC fitted with one flame ionization detector (FID), two flame photometric detectors (FPD) and two thermal conductivity detectors (TCD). Carbon hydrogen components including CH3SH, CH4, little C2H4 and C2H6 were detected by FID with a porapak Q column. Two FPD equipping with the same HP-Plot/Q capillary column and two different volume of six-way valve were employed to detect different concentration (0.1 ppm to 150000 ppm) of sulfur-containing matters including COS, CS2, CH3SH and H2S. TCDs equipped with TDX-01 carbon molecular sieve and porapak Q column were used to detect H2, CO, CO2 and H2O. The CO conversion and products selectivity were calculated by the following equation:
where CCO,in and CCO,out correspond to the inlet and outlet concentrations of CO (ppm), respectively.
The selectivity of products was calculated according to the balance of carbon, in which the main carbon-containing products, CH3SH, COS, CO2, CH4, are included.
where
Ci is the concentration of products (ppm).
Reaction pathway research
To better figure out the reaction pathway, six experiments inducing different reactant gas were designed, and the experiment conditions were listed as follows. Then, the reactant gas was separately introduced into the reactor under the same conditions of P = 0.2 MPa, GHSV = 1000 h−1 with different reaction temperature (523–673 K).
(1) The reactant gas: CO2![[thin space (1/6-em)]](https://www.rsc.org/images/entities/char_2009.gif) :
:![[thin space (1/6-em)]](https://www.rsc.org/images/entities/char_2009.gif) H2S
H2S![[thin space (1/6-em)]](https://www.rsc.org/images/entities/char_2009.gif) :
:![[thin space (1/6-em)]](https://www.rsc.org/images/entities/char_2009.gif) N2 = 1
N2 = 1![[thin space (1/6-em)]](https://www.rsc.org/images/entities/char_2009.gif) :
:![[thin space (1/6-em)]](https://www.rsc.org/images/entities/char_2009.gif) 1
1![[thin space (1/6-em)]](https://www.rsc.org/images/entities/char_2009.gif) :
:![[thin space (1/6-em)]](https://www.rsc.org/images/entities/char_2009.gif) 8 (30 ml min−1).
8 (30 ml min−1).
(2) The reactant gas: CO2![[thin space (1/6-em)]](https://www.rsc.org/images/entities/char_2009.gif) :
:![[thin space (1/6-em)]](https://www.rsc.org/images/entities/char_2009.gif) H2
H2![[thin space (1/6-em)]](https://www.rsc.org/images/entities/char_2009.gif) :
:![[thin space (1/6-em)]](https://www.rsc.org/images/entities/char_2009.gif) N2 = 1
N2 = 1![[thin space (1/6-em)]](https://www.rsc.org/images/entities/char_2009.gif) :
:![[thin space (1/6-em)]](https://www.rsc.org/images/entities/char_2009.gif) 1
1![[thin space (1/6-em)]](https://www.rsc.org/images/entities/char_2009.gif) :
:![[thin space (1/6-em)]](https://www.rsc.org/images/entities/char_2009.gif) 8 (30 ml min−1).
8 (30 ml min−1).
(3) The reactant gas: CO2![[thin space (1/6-em)]](https://www.rsc.org/images/entities/char_2009.gif) :
:![[thin space (1/6-em)]](https://www.rsc.org/images/entities/char_2009.gif) H2
H2![[thin space (1/6-em)]](https://www.rsc.org/images/entities/char_2009.gif) :
:![[thin space (1/6-em)]](https://www.rsc.org/images/entities/char_2009.gif) CO
CO![[thin space (1/6-em)]](https://www.rsc.org/images/entities/char_2009.gif) :
:![[thin space (1/6-em)]](https://www.rsc.org/images/entities/char_2009.gif) N2 = 1
N2 = 1![[thin space (1/6-em)]](https://www.rsc.org/images/entities/char_2009.gif) :
:![[thin space (1/6-em)]](https://www.rsc.org/images/entities/char_2009.gif) 1
1![[thin space (1/6-em)]](https://www.rsc.org/images/entities/char_2009.gif) :
:![[thin space (1/6-em)]](https://www.rsc.org/images/entities/char_2009.gif) 1
1![[thin space (1/6-em)]](https://www.rsc.org/images/entities/char_2009.gif) :
:![[thin space (1/6-em)]](https://www.rsc.org/images/entities/char_2009.gif) 7 (30 ml min−1).
7 (30 ml min−1).
(4) The reactant gas: CO/H2 = 1![[thin space (1/6-em)]](https://www.rsc.org/images/entities/char_2009.gif) :
:![[thin space (1/6-em)]](https://www.rsc.org/images/entities/char_2009.gif) 4 (30 ml min−1);
4 (30 ml min−1);
(5) The reactant gas: CO/H2S = 1![[thin space (1/6-em)]](https://www.rsc.org/images/entities/char_2009.gif) :
:![[thin space (1/6-em)]](https://www.rsc.org/images/entities/char_2009.gif) 5 (30 ml min−1);
5 (30 ml min−1);
(6) The reactant gas: 1% CH3SH (30 ml min−1).
Results and discussion
Effect of impregnation sequence
CO conversions of Mo/K/SBA-15, K/Mo/SBA-15 and K–Mo/SBA-15 are presented in Fig. 1(A). The highest CO conversion is observed for K–Mo/SBA-15. The CO conversion first increases and then decreases with the temperature increasing, which reaches the maximal conversion (42.67%) at 598 K. Mo/K/SBA-15 exhibits the lowest CO conversion, whereas the CO conversion of K/Mo/SBA-15 is intermediate between K–Mo/SBA-15 and Mo/K/SBA-15. The CO conversion of those two catalysts is increasing with the temperature rising while the CO conversion is not more than 30% in the end (673 K). The selectivities of COS, CH3SH, CO2 and CH4 over Mo/K/SBA-15, K/Mo/SBA-15 and K–Mo/SBA-15 are presented in Fig. 1(B–E). The selectivity of COS over the three catalysts (shown in Fig. 1B) is dropping with the temperature rising. The COS selectivity of Mo/K/SBA-15 is remarkably higher than other two catalysts when the temperature is lower than 593 K, while the varied trend of COS selectivity for these three catalysts are roughly similar. Moreover, the CH3SH selectivity of K–Mo/SBA-15 is obviously higher than that of Mo/K/SBA-15 and K/Mo/SBA-15 when the temperature is below 623 K. As for the selectivity of CO2 (shown in Fig. 1D), it is relatively stable in the temperature range in addition to that at 523 K. The selectivity of CH4 (shown in Fig. 1E) has been going up with the increasing reaction temperature, the relatively higher CH4 selectivity is obtained on K/Mo/SBA-15 instead of Mo/K/SBA-15 and K–Mo/SBA-15. Considered the CO conversion and CH3SH selectivity, K–Mo/SBA-15 prepared by incipient-wetness co-impregnation method exhibits the higher catalytic performances than those of K/Mo/SBA-15 and Mo/K/SBA-15 samples prepared by a sequential impregnation method.
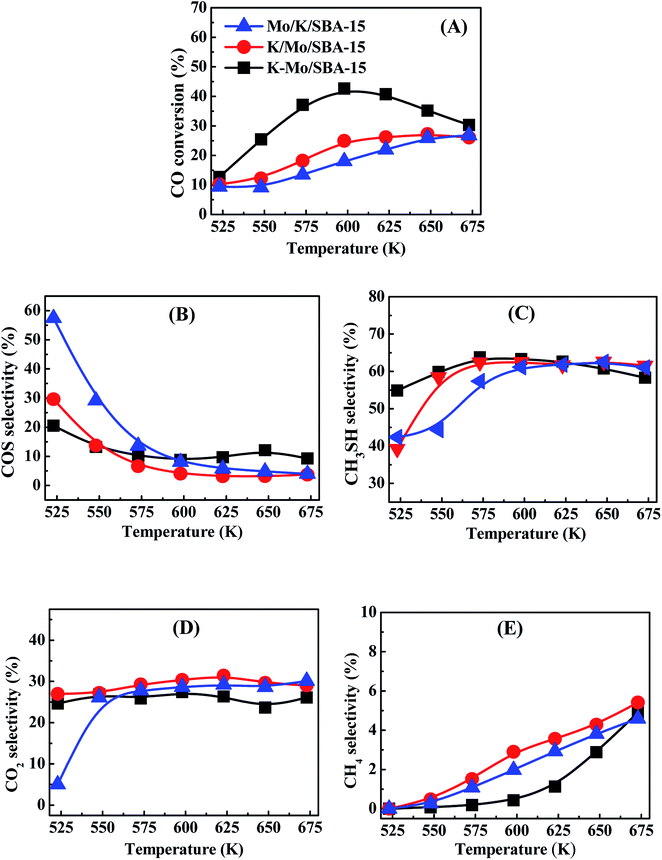 |
| | Fig. 1 CO conversion (A) and products selectivity COS (B), CH3SH (C), CO2(D) and CH4 (E) of Mo/K/SBA-15 (blue light triangle), K/Mo/SBA-15 (red light circle) and K–Mo/SBA-15 (back light square). Reaction conditions: 0.2 MPa, 1000 h−1 and CO/H2S/H2 = 1![[thin space (1/6-em)]](https://www.rsc.org/images/entities/char_2009.gif) : :![[thin space (1/6-em)]](https://www.rsc.org/images/entities/char_2009.gif) 5 5![[thin space (1/6-em)]](https://www.rsc.org/images/entities/char_2009.gif) : :![[thin space (1/6-em)]](https://www.rsc.org/images/entities/char_2009.gif) 4. 4. | |
Characterization of active species
The textural parameters of SBA-15, Mo/K/SBA-15, K/Mo/SBA-15, K–Mo/SBA-15 are summarized in Table 1. SBA-15 exhibits the type IV isotherms with H1-type hysteresis loops attributed to typical mesoporous structure (not shown).29 After the incorporation of K and Mo oxide precursor, all the BET surface area, pore volume and pore size of three samples decreases to some degree. Compared to K/Mo/SBA-15, BET surface area, pore volume and pore size of Mo/K/SBA-15 and K–Mo/SBA-15 significantly decrease, indicating the interaction of alkaline K species with silica-based SBA-15 support leading the destroy of the mesoporous structure. K/Mo/SBA-15, K–Mo/SBA-15 samples shows the BET surface area of 143.9 and 68.1 m2 g−1. Considering the opposite activity results (K/Mo/SBA-15 < K–Mo/SBA-15), we can deduce that there is possibly no direct relationship between catalysts activity and BET surface area.
Table 1 Textural characteristics of Mo/K/SBA-15, K/Mo/SBA-15 and K–Mo/SBA-15
| Samples |
SBETa (m2 g−1) |
VPb (cm3 g−1) |
DPc (nm) |
| SBET, BET surface area. VP, pore volume. D, average pore diameter. |
| SBA-15 |
1022.4 |
1.11 |
4.9 |
| Mo/K/SBA-15 |
36.8 |
0.07 |
3.8 |
| K/Mo/SBA-15 |
143.9 |
0.24 |
6.4 |
| K–Mo/SBA-15 |
68.1 |
0.14 |
3.8 |
The crystalline phases of oxidized, sulfided and spent catalysts are characterized by X-ray diffraction (XRD), and the corresponding XRD patterns were presented in Fig. 2. All the oxidized Mo/K/SBA-15, K/Mo/SBA-15, K–Mo/SBA-15 samples show the same X-ray diffraction lines, indicating the formation of the same structures of oxide precursors. The dominant diffraction peaks shown in the oxidized samples are assigned to K2Mo2O7 (JCPDS-ICDD no. 36-0347) and K2MoO4 (JCPDS-ICDD no. 01-0766). Small MoO3 species (JCPDS-ICDD no. 05-0508) is also detected for oxidized catalysts. After sulfided at 553 K, K2SO4 phase (JCPDS-ICDD no. 05-0613) is observed for K–Mo/SBA-15 and K/Mo/SBA-15, and K2S2O8 phase (JCPDS-ICDD no.32-0846) is detected for K/Mo/SBA-15 and Mo/K/SBA-15. Those sulfate and persulfate species are probably originated from the conversion of intermediate K2S with water readily and irreversibly in the transfer process, leading finally to the agglomerated K2SO4 and K2S2O8 phases.22 The difference in the formed sulfate species over three catalysts may be due to the distinguished interaction among K oxide, Mo oxide and SBA-15 in the process of different impregnation sequence. In the spent K–Mo/SBA-15 sample, the K2SO4 phase disappears, and K2S2O8 (JCPDS-ICDD no.32-0846) phase is also formed during the reaction. It is known that the sulfate phases is an undesired species and is inactive for catalytic reaction, which could give rise to the decease in the catalytic performance at high temperature to some degree. Moreover, it should be noted that the peaks at 14.5°, 33.2°, 58.8° attributed to MoS2 (JCPDS-ICDD no. 024-0513) are not distinct, and the intensity of MoS2 found in the sulfided catalyst is pretty low. It is speculated that MoS2 phase exists on the catalysts in the form of amorphous state or the size and amount of MoS2 species is lower than that of XRD detection limit under the sulfured progress with 553 K. After reaction, MoS2 (JCPDS-ICDD no. 024-0513) diffraction peak is obviously observed and becomes the main crystalline phase, indicating the crystalline MoS2 phase with higher size is formed between 553 K to 673 K.
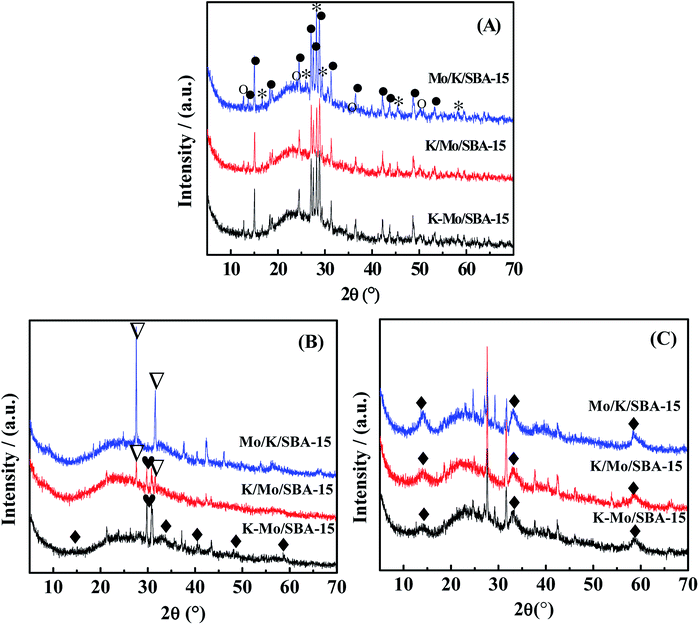 |
| | Fig. 2 XRD diffractograms of (A) oxide precursors of catalysts, (B) sulfided catalysts and (C) spent catalysts. MoO3( ), MoS2 ( ), MoS2 ( ), K2Mo2O7 ( ), K2Mo2O7 ( ), K2MoO4 ( ), K2MoO4 ( ), K2SO4 ( ), K2SO4 ( ), K2S2O8 ( ), K2S2O8 ( ). ). | |
Raman spectra of oxidized, sufided and spent catalysts are shown in Fig. 3A and B, respectively, to characterize the active species. For the oxidized samples, the bands at 849 and 711 cm−1 are attributed to the presence of K2Mo2O7 (ref. 30) and other bands are assigned to K2MoO4 species, in agreement with XRD. For sulfided and spent samples, three main lines at 382, 408, and 450 cm−1 can be observed in all the spectrum. The band at 382 cm−1 corresponds to the Mo–S stretching mode along the basal plane, while the one at 408 cm−1 is attributed to a S–Mo–S stretching mode along to the C-axis, and the band at 450 cm−1 is assigned to the second-order scattering.31 Those weak Raman peaks suggests MoS2 species is presented in the form of amorphous state in the sulfided catalysts. The spectra of spent catalysts is very similar with that of sulfided sample, however, there is significant difference in the peak intensity between sulfided and spent samples, indicating that partial oxidized K–Mo precursors are further converted into MoS2 species during reaction process.
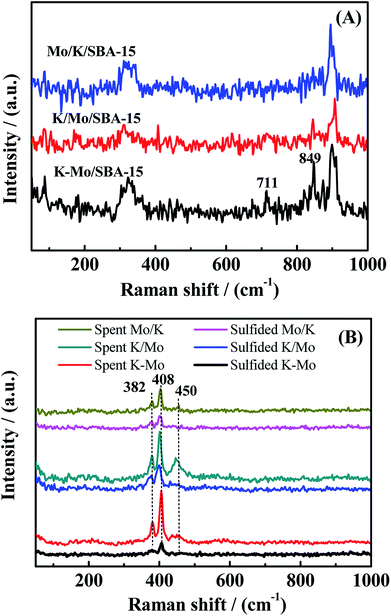 |
| | Fig. 3 Raman spectrum of oxide precursor of catalysts (A), sulfided catalysts and spent catalysts (B). | |
To further investigate the phase transformation in the catalysis progress, the sulfided and spent catalysts of three catalysts are characterized by XPS. The decomposition constraints about Mo 3d are referred to Cordova et al.32 and Qiu et al.33 Fig. 4 exhibits the decomposition of the Mo 3d spectra of sulfided and spent Mo/K/SBA-15, K/Mo/SBA-15 and K–Mo/SBA-15 samples. For the sulfided catalysts, the components at 229.2, 230.7 and 233.1 eV are attributed to Mo 3d5/2 components of MoIV–S for MoS2 phase, MoV–O–S surrounded by oxygen and sulfur atoms (intermediate sulfidation phase), MoVI–O–S species, respectively.32 The spectrum at 226.3, 227.6 and 233.5 eV can be assigned to the S 2s orbit related to S2− (MoS2), sulfur bridge (S–S2−) and sulfates (SO42−), respectively. In the sulfided K–Mo/SBA-15 sample, the relative atomic ratio of MoVI–S, MoV–O–S, MoVI–O–S (shown in Table 2) is 63.5%, 13.53% and 22.96%, respectively, which indicates that MoS2 phase is the main species for sulfided sample. After reaction, relative atomic ratio of corresponding species has changed, where the atom% of MoVI–S, MoV–O–S increases to 71.49% and 13.98% with the decrease of MoVI–O–S to 14.31%, suggesting the improvement of sulfidation degree when rising the reaction temperature. Those phenomenon are also found in the sulfided Mo/K/SBA-15, K/Mo/SBA-15 samples. Moreover, the binding energy of Mo 3d spectra of spent K–Mo/SBA-15 is slightly higher than that of sulfided sample, which also demonstrates the conversion of partial MoVI–O–S into MoIV–S and MoV–O–S species (higher sulfidation degree). Although there is some transformation in the amount of MoS2 species between sulfided and spent samples, the selectivity of CH3SH is not largely changed, suggesting K–Mo/SBA-15 catalyst is relatively stabilized when sulfided at 553 K. Compared to traditional MoS2 catalyst that sulfided at higher temperature of 675 K, the sulfidation of K–Mo oxide precursors into surface MoS2 species at lower temperature of 553 K is enough to convert CO/H2/H2S into CH3SH. Moreover, the main phase in K/Mo/SBA-15 and Mo/K/SBA-15 obtained through the XPS spectra analysis (presented in Fig. 4C–F) are same with that of K–Mo/SBA-15. The relative atom% of MoVI–S, MoV-OS and MoVI–O for K/Mo/SBA-15 and Mo/K/SBA-15 are summarized in Table 2, and the changes in atom% of corresponding phases are followed the rule found in K–Mo/SBA-15. There is very small difference in the MoVI–S content over K–Mo/SBA-15 and K/Mo/SBA-15 catalysts, while the amount of MoVI–S in the Mo/K/SBA-15 is largely lower than those of K–Mo/SBA-15 and K/Mo/SBA-15, possibly due to the strong interaction of K with SBA-15 decreasing the sulfidation degree of Mo oxide species.
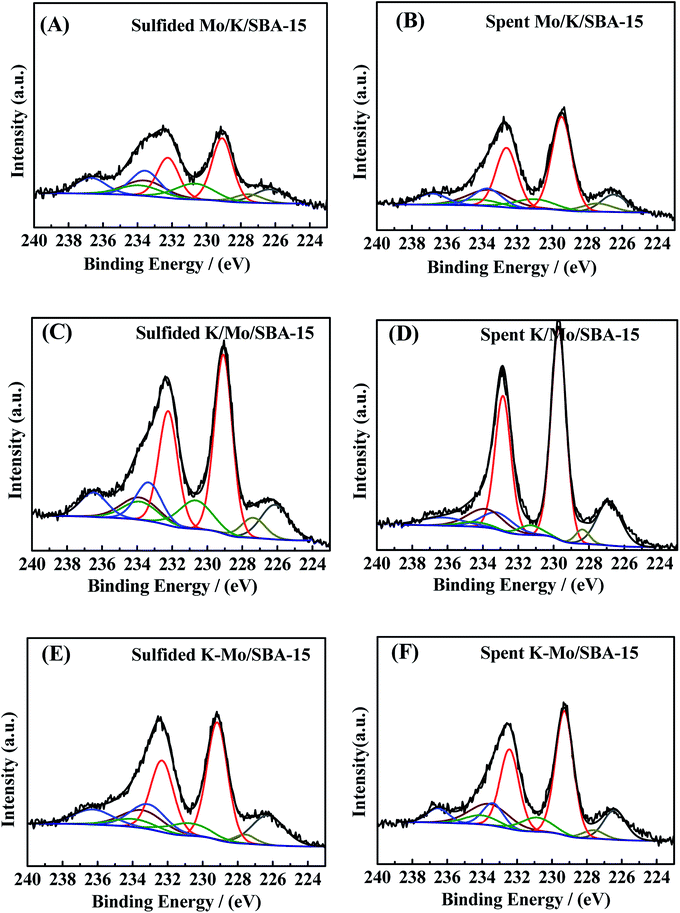 |
| | Fig. 4 XPS spectra of the Mo 3d–S 2s core level of (A) sulfided Mo/K/SBA-15, (B) spent Mo/K/SBA-15, (C) sulfided K/Mo/SBA-15, (D) spent K/Mo/SBA-15 (E) sulfided K–Mo/SBA-15, and (F) spent K–Mo/SBA-15. | |
Table 2 Relative atom% of Mo species in sulfided and spent catalysts
| Catalyst |
Sulfided catalysts |
Spent catalysts |
| MoVI–Sa (%) |
MoV–OSb (%) |
MoVI–Oc (%) |
MoVI–S (%) |
MoV–OS (%) |
MoVI–O (%) |
| The MoIV species related to MoS2. The MoV surrounded by oxygen and sulfur atoms. The oxidized MoVI species. |
| Mo/K/SBA-15 |
49.1 |
23.66 |
25.84 |
68.29 |
14.00 |
16.25 |
| K/Mo/SBA-15 |
62.61 |
18.29 |
18.80 |
79.37 |
5.44 |
11.97 |
| K–Mo/SBA-15 |
63.50 |
13.53 |
22.96 |
71.49 |
13.98 |
14.31 |
In general, our goal is to investigate the reaction network for converting CO/H2/H2S to CH3SH. The difference in the catalytic activity for catalysts prepared by different impregnation sequence is clarified briefly via the TPR pattern. As we known, in the typical sulfided MoS2 based catalysts, sulfur vacancies presented over MoS2 phases play a significant role in determining the activity of hydrodesulfurization (HDS).34,35 Those sulfur vacancy are originated from the removal of sulfur species weakly bonded with molybdenum, which was shown to be labile and was progressively replaced by the sulfur of reactants molecule. Thus, TPR pattern was used to characterize the weakly-bonded and labile surface sulfur species. TPR profiles of three sulfided catalysts are displayed in the Fig. 5. As shown, two kinds of sulfur species are observed in the low and high temperature regions of three catalysts, the low temperature reduction peak between 500–700 K is generally attributed to the reduction of edge reactive sulfur species (i.e., nonstoichiometric, Sx), and the high temperature reduction peak between 800–1000 K corresponds to the recombination of –SH groups or/and the reduction of K2S species.36,37 The edge reactive sulfur species was generally considered as the active sites and the increase in the peak area at the low-temperature region suggests the growth in the amount of active sites. Generally, the low-temperature peak area for three catalysts is in the following order: Mo/K/SBA-15 < K/Mo/SBA-15 < K–Mo/SBA-15, which is consistent with the catalytic performances for three catalysts (as shown in Fig. 1). Compared the activity results with the TPR results, CO conversions of Mo/K/SBA-15, K/Mo/SBA-15, K–Mo/SBA-15 catalysts were correlated to the number of edge reactive sulfur species to some degree.
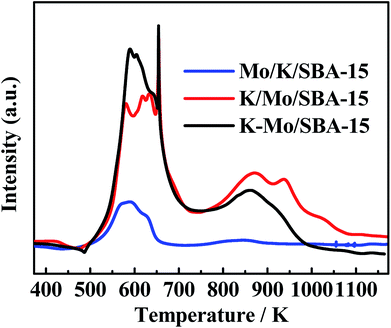 |
| | Fig. 5 TPR patterns of sulfided Mo/K/SBA-15, K/Mo/SBA-15 and K–Mo/SBA-15. | |
The reaction pathway for synthesizing CH3SH with CO/H2S/H2
It is well known that carbonyl sulfide (COS) is one of significant intermediates in the synthesis of CH3SH with CO/H2S/H2,16,38 thus indicating that COS might be dominantly presented in the products and the selectivity of COS could increase with the increasing conversion of CO, as depicted with the reaction eqn (2) However, a diametrically drop in the COS selectivity was observed at our experiment conditions (Fig. 1). The above phenomena can be interpreted as follows: the downward trend of COS selectivity as temperature rising indicates that the reaction rate for consuming COS was faster than that for producing COS via eqn (2); the low COS selectivity reveals that the large portion of COS generated from eqn (2) should be rapidly consumed via some reaction pathways as depicted by eqn (3)–(6). In all four reactions, it seems to consider that the reaction for consuming COS by eqn (5) rarely generate due to the presence of reverse reaction of (2). The reaction (6) should be occurred owing to the generation of CO2 in our reaction system. If the presence of reactions (3) and (4) or not can be confirmed by the formed CH3SH. As can be seen from Fig. 1, the increasing in the selectivity of CH3SH until reaching a maximum at 573 K with the increase of reaction temperature was accompanied by the decrease in the selectivity of COS, which is attributed to the conversion of COS to form CH3SH. Notably, the generation of CH3SH can be responsible for the only two independent reaction pathways by means of eqn (3) or (4) which could occur under different amount of COS and have been proposed by many groups, respectively.16,19,22,23 As for the former reaction pathway, some of the early reports 16,19 had been considered the hydrogenation of COS to generate CH3SH and H2O to be the sole source of CH3SH formation, and COS was the only intermediate species in this synthetic reaction. With respect to the latter reaction pathway, it had been proposed by Lercher and coworkers in the recent study,22,23,39 and they pointed out that eqn (4) was composed of two step reactions: the first step was the disproportionation of COS to produce carbon dioxide (CO2) and carbon disulfide (CS2) (eqn (4-1)); the second step was the hydrogenation of CS2 to form CH3SH (eqn (4-2)).| | |
COS + 3H2 → CH3SH + H2O
| (3) |
| | |
2COS + 3H2 → CO2 + CH3SH + H2S
| (4) |
| | |
CS2 + 3H2 → CH3SH + H2S
| (4-2) |
| | |
COS + H2O → CO2 + H2S
| (6) |
| | |
CS2 + 2H2O → CO2 + 2H2S
| (8) |
In light of the above fact, two reaction pathways were possibly presented. However, to our best knowledge, at present, no evidence was provided to prove the coexistence of those two reactions pathways. It should be stated that the conversion of mixed CO/H2S/H2 into CH3SH is rather complex because there are more than ten matters (CO, H2S, H2, COS, CH3SH, CO2, CS2, CH4, C2H4, C2H6, CH3SCH3, CH3SSCH3, shown in Fig. 1-S of ESI†) and more than ten reactions (eqn (1) to (12)) presented in the reaction system. Empolying three starting reactants (CO/H2S/H2 or COS/H2S/H2 or CS2/H2S/H2) as a whole or system is difficult to completely understand the reaction pathways for the conversion of mixed CO/H2S/H2 into CH3SH due to its complexity, as previously reported in the literature.19,22,40 The separation of integral three starting reactants into individual two reactants may provide a new view to investigate the complex reaction process. Based on our analysis, the production of water is a key point to prove the existence of former reaction pathway in our synthetic reaction. In our work, large amount of water peak can be found in TCD with a PQ volume when using synthetic gas (CO/H2/H2S = 1![[thin space (1/6-em)]](https://www.rsc.org/images/entities/char_2009.gif) :
:![[thin space (1/6-em)]](https://www.rsc.org/images/entities/char_2009.gif) 5
5![[thin space (1/6-em)]](https://www.rsc.org/images/entities/char_2009.gif) :
:![[thin space (1/6-em)]](https://www.rsc.org/images/entities/char_2009.gif) 4) to synthesize CH3SH over three catalysts (shown in Fig. 3-S of ESI†), thus it is necessary to investigate if there are some other reactions that can generate water. Totally, four reactions in our reaction system possibly produce H2O as listed in the follows: COS + 3H2 → CH3SH + H2O (eqn (3)); CO2 + H2S → COS + H2O (the reverse reaction of eqn (6)); CO2 + H2 → CO + H2O (the reverse reaction of eqn (8)); CO + 3H2 → CH4 + H2O (eqn (7)). K–Mo/SBA-15 was selected to investigate the catalytic performance of above-mentioned reactions in the following. For the reverse reaction of eqn (6), the usage of CO2
4) to synthesize CH3SH over three catalysts (shown in Fig. 3-S of ESI†), thus it is necessary to investigate if there are some other reactions that can generate water. Totally, four reactions in our reaction system possibly produce H2O as listed in the follows: COS + 3H2 → CH3SH + H2O (eqn (3)); CO2 + H2S → COS + H2O (the reverse reaction of eqn (6)); CO2 + H2 → CO + H2O (the reverse reaction of eqn (8)); CO + 3H2 → CH4 + H2O (eqn (7)). K–Mo/SBA-15 was selected to investigate the catalytic performance of above-mentioned reactions in the following. For the reverse reaction of eqn (6), the usage of CO2![[thin space (1/6-em)]](https://www.rsc.org/images/entities/char_2009.gif) :
:![[thin space (1/6-em)]](https://www.rsc.org/images/entities/char_2009.gif) H2S
H2S![[thin space (1/6-em)]](https://www.rsc.org/images/entities/char_2009.gif) :
:![[thin space (1/6-em)]](https://www.rsc.org/images/entities/char_2009.gif) N2 = 1
N2 = 1![[thin space (1/6-em)]](https://www.rsc.org/images/entities/char_2009.gif) :
:![[thin space (1/6-em)]](https://www.rsc.org/images/entities/char_2009.gif) 1
1![[thin space (1/6-em)]](https://www.rsc.org/images/entities/char_2009.gif) :
:![[thin space (1/6-em)]](https://www.rsc.org/images/entities/char_2009.gif) 8 (30 ml min−1) as reactants was investigated and the result is presented in Fig. 6A. It is seen that the conversion of CO2 is pretty low (2–4%) and there is also no water peak found in TCD (shown in Fig. 2-S(A) of ESI†), indicating that large amount of water is not possibly produced from eqn (6). For the reverse reaction of eqn (8), CO2
8 (30 ml min−1) as reactants was investigated and the result is presented in Fig. 6A. It is seen that the conversion of CO2 is pretty low (2–4%) and there is also no water peak found in TCD (shown in Fig. 2-S(A) of ESI†), indicating that large amount of water is not possibly produced from eqn (6). For the reverse reaction of eqn (8), CO2![[thin space (1/6-em)]](https://www.rsc.org/images/entities/char_2009.gif) :
:![[thin space (1/6-em)]](https://www.rsc.org/images/entities/char_2009.gif) H2
H2![[thin space (1/6-em)]](https://www.rsc.org/images/entities/char_2009.gif) :
:![[thin space (1/6-em)]](https://www.rsc.org/images/entities/char_2009.gif) N2 = 1
N2 = 1![[thin space (1/6-em)]](https://www.rsc.org/images/entities/char_2009.gif) :
:![[thin space (1/6-em)]](https://www.rsc.org/images/entities/char_2009.gif) 1
1![[thin space (1/6-em)]](https://www.rsc.org/images/entities/char_2009.gif) :
:![[thin space (1/6-em)]](https://www.rsc.org/images/entities/char_2009.gif) 8 (30 ml min−1) was used to research the reaction completion degree and the result is shown in Fig. 6B. The conversion of CO2 is rising with the temperature increasing and reaches the maximal value at 673 K, while only 13.46% CO2 was converted, more importantly, the peak of water cannot be found in the TCD (shown in Fig. 2-S(B) of ESI†). Actually, this reverse water gas shift reaction is hardly to occur in this condition due to the high concentration of CO atmosphere in the system, the water gas shift reaction is more likely to happen under that condition. The sequence experiment of the reverse water gas shift reaction with adding 10% CO (v/v) also confirms our view. As for eqn (7), using CO/H2 = 1
8 (30 ml min−1) was used to research the reaction completion degree and the result is shown in Fig. 6B. The conversion of CO2 is rising with the temperature increasing and reaches the maximal value at 673 K, while only 13.46% CO2 was converted, more importantly, the peak of water cannot be found in the TCD (shown in Fig. 2-S(B) of ESI†). Actually, this reverse water gas shift reaction is hardly to occur in this condition due to the high concentration of CO atmosphere in the system, the water gas shift reaction is more likely to happen under that condition. The sequence experiment of the reverse water gas shift reaction with adding 10% CO (v/v) also confirms our view. As for eqn (7), using CO/H2 = 1![[thin space (1/6-em)]](https://www.rsc.org/images/entities/char_2009.gif) :
:![[thin space (1/6-em)]](https://www.rsc.org/images/entities/char_2009.gif) 4 (30 ml min−1) as the reactant gas was investigated and the result is shown in Fig. 7. It can be found that the CO conversion is pretty low and the main product is CH4 and CO2 with a little C2H4 and C2H6, this indicating the generation of CH4 from CO with H2 (2CO + 2H2 → CH4 + CO2)41 instead of the reaction (CO + 3H2 → CH4 + H2O). Accordingly, large amount of water in system is produced from the hydrogenation of COS (eqn (3)) which indicates the first reaction pathway would happen certainly.
4 (30 ml min−1) as the reactant gas was investigated and the result is shown in Fig. 7. It can be found that the CO conversion is pretty low and the main product is CH4 and CO2 with a little C2H4 and C2H6, this indicating the generation of CH4 from CO with H2 (2CO + 2H2 → CH4 + CO2)41 instead of the reaction (CO + 3H2 → CH4 + H2O). Accordingly, large amount of water in system is produced from the hydrogenation of COS (eqn (3)) which indicates the first reaction pathway would happen certainly.
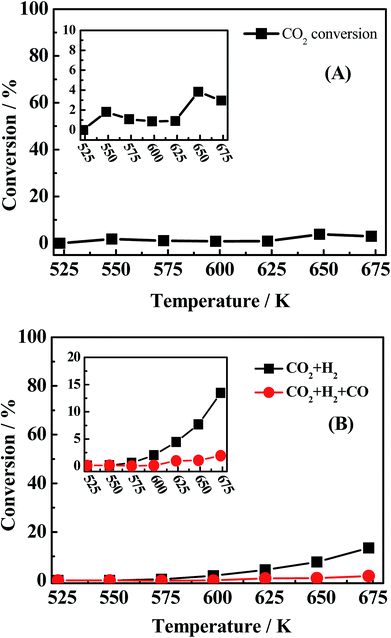 |
| | Fig. 6 CO conversion (black light square) of (A) reaction conditions: 0.2 MPa, 1000 h−1 and CO2/H2S/N2 = 1![[thin space (1/6-em)]](https://www.rsc.org/images/entities/char_2009.gif) : :![[thin space (1/6-em)]](https://www.rsc.org/images/entities/char_2009.gif) 1 1![[thin space (1/6-em)]](https://www.rsc.org/images/entities/char_2009.gif) : :![[thin space (1/6-em)]](https://www.rsc.org/images/entities/char_2009.gif) 8 (30 ml min−1), (B) reaction conditions: 0.2 MPa, 1000 h−1, CO2/H2/N2 = 1 8 (30 ml min−1), (B) reaction conditions: 0.2 MPa, 1000 h−1, CO2/H2/N2 = 1![[thin space (1/6-em)]](https://www.rsc.org/images/entities/char_2009.gif) : :![[thin space (1/6-em)]](https://www.rsc.org/images/entities/char_2009.gif) 1 1![[thin space (1/6-em)]](https://www.rsc.org/images/entities/char_2009.gif) : :![[thin space (1/6-em)]](https://www.rsc.org/images/entities/char_2009.gif) 8 (30 ml min−1) and CO2/H2/CO/N2 = 1 8 (30 ml min−1) and CO2/H2/CO/N2 = 1![[thin space (1/6-em)]](https://www.rsc.org/images/entities/char_2009.gif) : :![[thin space (1/6-em)]](https://www.rsc.org/images/entities/char_2009.gif) 1 1![[thin space (1/6-em)]](https://www.rsc.org/images/entities/char_2009.gif) : :![[thin space (1/6-em)]](https://www.rsc.org/images/entities/char_2009.gif) 1 1![[thin space (1/6-em)]](https://www.rsc.org/images/entities/char_2009.gif) : :![[thin space (1/6-em)]](https://www.rsc.org/images/entities/char_2009.gif) 7 (30 ml min−1). 7 (30 ml min−1). | |
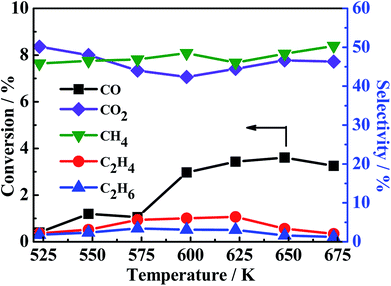 |
| | Fig. 7 CO conversion (black light square) and CH4 (green light square), C2H4 (red light ball) and C2H6 (blue light triangle) selectivity. Reaction conditions: 0.2 MPa, 1000 h−1 and CO/H2 = 1![[thin space (1/6-em)]](https://www.rsc.org/images/entities/char_2009.gif) : :![[thin space (1/6-em)]](https://www.rsc.org/images/entities/char_2009.gif) 4 (30 ml min−1). 4 (30 ml min−1). | |
In order to have a further acquaintance to the whole reaction pathway, another two reactions using different components as reactant gas were investigated and compared. The activity experimental result of the reaction using CO/H2S = 1![[thin space (1/6-em)]](https://www.rsc.org/images/entities/char_2009.gif) :
:![[thin space (1/6-em)]](https://www.rsc.org/images/entities/char_2009.gif) 5 as reactant gas (denote as R(CO/H2S)) was shown in Fig. 8(A) and used to compare with the reaction using CO/H2S/H2 as reactant gas in Fig. 8(B) (denote as R(CO/H2S/H2)). The only difference between R(CO/H2S/H2) and R(CO/H2S) is the concentration of H2 in reaction system. The amount of hydrogen in the first reaction is sufficient but it is shortage in the second reaction because H2 in the system of R(CO/H2S) can be generated from eqn (2). In R(CO/H2S) system, the selectivities of two main species COS and CS2 are found to be 33–32% and 6–15% from 523 K to 675 K, respectively. The presence of large amount of CS2 in R(CO/H2S) system indicates that CS2 is the significant intermediate species and the disproportionation of COS (eqn (4-1)) occurs indeed. In R(CO/H2S/H2) system, however, it is found that the corresponding selectivities of two species decrease largely (16–8% and 0–1.4% from 523 K to 675 K, respectively). It suggests that the addition of hydrogen leads to the large consumption of COS and CS2, indicating the hydrogenation of CS2 has happened as eqn (4-2). In basis of the above facts, we proposed that two reaction pathways may be occurred simultaneously in our reaction system. Comparison of the selectivity of CO2 between R(CO/H2S/H2) and R(CO/H2S) also demonstrates this point. The corresponding result is displayed in Fig. 8(C). As we known, if only the former reaction pathway, i.e., the hydrogenation of COS accompanied by reaction of COS and H2O to generate CO2, exists, the amount of CO2 in H2-rich system (R(CO/H2S/H2)) would be lower than that in H2-deficient system (R(CO/H2S)) because more H2 was added and then more COS was consumed to generate CH3SH, instead of CO2. While if only the latter reaction pathway, i.e., the disproportionation of COS followed by the hydrogenation of CS2, is presented, the amount of CO2 in H2-rich system (R(CO/H2S/H2)) would be higher than that in H2-deficient system (R(CO/H2S)) because more H2 was added and then more CS2 was consumed, leading to a big surplus of CO2. However, in our work, the selectivity of CO2 between R(CO/H2S/H2) and R(CO/H2S) exhibits interlaced results at all the reaction temperature range (Fig. 8C), which confirms the coexistence of two reaction pathways. Moreover, large amount of by-product CO2 is found to be presented in the products and is almost stabilized at all the reaction temperature region. This generated CO2 is mainly derived from the disproportionation of COS from eqn (4-1) and the hydrolysis of COS, CO, CS2 from eqn (6)–(8) respectively.
5 as reactant gas (denote as R(CO/H2S)) was shown in Fig. 8(A) and used to compare with the reaction using CO/H2S/H2 as reactant gas in Fig. 8(B) (denote as R(CO/H2S/H2)). The only difference between R(CO/H2S/H2) and R(CO/H2S) is the concentration of H2 in reaction system. The amount of hydrogen in the first reaction is sufficient but it is shortage in the second reaction because H2 in the system of R(CO/H2S) can be generated from eqn (2). In R(CO/H2S) system, the selectivities of two main species COS and CS2 are found to be 33–32% and 6–15% from 523 K to 675 K, respectively. The presence of large amount of CS2 in R(CO/H2S) system indicates that CS2 is the significant intermediate species and the disproportionation of COS (eqn (4-1)) occurs indeed. In R(CO/H2S/H2) system, however, it is found that the corresponding selectivities of two species decrease largely (16–8% and 0–1.4% from 523 K to 675 K, respectively). It suggests that the addition of hydrogen leads to the large consumption of COS and CS2, indicating the hydrogenation of CS2 has happened as eqn (4-2). In basis of the above facts, we proposed that two reaction pathways may be occurred simultaneously in our reaction system. Comparison of the selectivity of CO2 between R(CO/H2S/H2) and R(CO/H2S) also demonstrates this point. The corresponding result is displayed in Fig. 8(C). As we known, if only the former reaction pathway, i.e., the hydrogenation of COS accompanied by reaction of COS and H2O to generate CO2, exists, the amount of CO2 in H2-rich system (R(CO/H2S/H2)) would be lower than that in H2-deficient system (R(CO/H2S)) because more H2 was added and then more COS was consumed to generate CH3SH, instead of CO2. While if only the latter reaction pathway, i.e., the disproportionation of COS followed by the hydrogenation of CS2, is presented, the amount of CO2 in H2-rich system (R(CO/H2S/H2)) would be higher than that in H2-deficient system (R(CO/H2S)) because more H2 was added and then more CS2 was consumed, leading to a big surplus of CO2. However, in our work, the selectivity of CO2 between R(CO/H2S/H2) and R(CO/H2S) exhibits interlaced results at all the reaction temperature range (Fig. 8C), which confirms the coexistence of two reaction pathways. Moreover, large amount of by-product CO2 is found to be presented in the products and is almost stabilized at all the reaction temperature region. This generated CO2 is mainly derived from the disproportionation of COS from eqn (4-1) and the hydrolysis of COS, CO, CS2 from eqn (6)–(8) respectively.
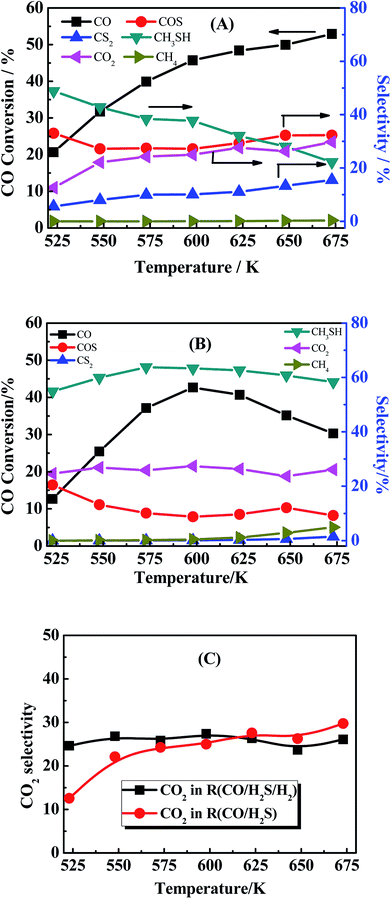 |
| | Fig. 8 (A) CO conversion (black square light) and the product selectivity (marked in the picture). Reaction conditions: 0.2 MPa, 1000 h−1 and CO/H2S = 1![[thin space (1/6-em)]](https://www.rsc.org/images/entities/char_2009.gif) : :![[thin space (1/6-em)]](https://www.rsc.org/images/entities/char_2009.gif) 5 (30 ml min−1). (B) CO conversion (black square light) and the product selectivity (marked in the picture). Reaction conditions: 0.2 MPa, 1000 h−1 and CO/H2S/H2 = 1 5 (30 ml min−1). (B) CO conversion (black square light) and the product selectivity (marked in the picture). Reaction conditions: 0.2 MPa, 1000 h−1 and CO/H2S/H2 = 1![[thin space (1/6-em)]](https://www.rsc.org/images/entities/char_2009.gif) : :![[thin space (1/6-em)]](https://www.rsc.org/images/entities/char_2009.gif) 5 5![[thin space (1/6-em)]](https://www.rsc.org/images/entities/char_2009.gif) : :![[thin space (1/6-em)]](https://www.rsc.org/images/entities/char_2009.gif) 4 (30 ml min−1). (C) Comparison of CO2 selectivity between in R(CO/H2S/H2) and R(CO/H2S). 4 (30 ml min−1). (C) Comparison of CO2 selectivity between in R(CO/H2S/H2) and R(CO/H2S). | |
Another phenomenon should be taken into consideration. In the theoretical point, when CO conversion is increasing with the temperature rising, the amount of generated H2 should be increasing, and CS2 and COS can be easily reacted with generated H2 to generate more CH3SH (eqn (4-2)). However, it is noted that the selectivity of CH3SH in R(CO/H2S) sharply decreases with the increasing temperature. Two reasons could be responsible for this phenomenon. On the one hand, the decreasing in the CH3SH selectivity may be partially due to the reduction in the generation of CH3SH, which is proved by the increased selectivity of CS2. On the another hand, CH3SH could be decomposed all the time to other matters. The low selectivity of CH4 in R(CO/H2S) system indicates the large decrease in the CH3SH selectivity may be not completely originated from the decomposition of CH3SH into CH4, and may be attributed to the decomposition of CH3SH into other maters under hydrogen shortage atmosphere. To confirm the view we proposed, the experiment using CH3SH as reactant gas was carried out, and the CH3SH conversion and product selectivity are presented in Fig. 9. We are surprised to find that the conversion of CH3SH is pretty high and has arrived 97% at 623 K, the main components in relatively lower temperature are dimethyl sulfide (CH3SCH3) and dimethyl disulfide (CH3SSCH3), and those products are decreasing with the temperature increasing and CH4 becomes the predominant product when the temperature is more than 593 K. Those result indicate that the conversion of CH3SH was firstly converted into intermediates, CH3SCH3 and CH3SSCH3, and then the intermediates were decomposed into CH4 and H2S, as described in eqn ((9-1)–(9-4)). However, the low and unchanged selectivity of CH4 in R(CO/H2S) system can not explain the drastic decrease in the CH3SH selectivity and some other reason should be presented. The spent catalyst was characterized by Raman spectrum to detect if the carbon deposition was presented and the result is shown in Fig. 10. It is obvious that the catalyst for R(CH3SH) exhibits a Raman band between 1300–1700 cm−1 which is attributed to carbon deposition,42,43 indicating that CH3SH could be possibly decomposed to H2S, H2 and C, as shown by eqn (10). Certainly, some other possible reason for the decreased selectivity of CH3SH can not be excluded. Moreover, due to the monitoring of trace amounts of ethylene (C2H4) and ethane (C2H6), the reactions (11) and (12) would be occurred to some degree in the reaction system.
| | |
CH3SH + H2 → CH4 + H2S
| (9) |
| | |
2CH3SH → CH3SCH3 + H2S
| (9-1) |
| | |
2CH3SH → CH3SSCH3 + H2
| (9-2) |
| | |
CH3SCH3 + 2H2 → 2CH4 + H2S
| (9-3) |
| | |
CH3SSCH3 + 3H2 → 2CH4 + 2H2S
| (9-4) |
| | |
CH3SH → C + H2S + H2
| (10) |
| | |
2CH3SH → C2H4 + 2H2S
| (11) |
| | |
2CH3SH + H2 → C2H6 + 2H2S
| (12) |
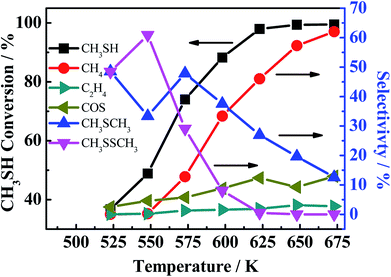 |
| | Fig. 9 CH3SH conversion (black light square) and the product selectivity (marked in the picture). Reaction conditions: 0.2 MPa, 1000 h−1, 30 ml min−1. | |
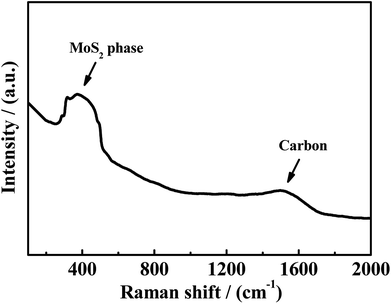 |
| | Fig. 10 Raman spectrum of spent catalysts in R(CH3SH). | |
Thus, we considered that CH3SH in the reaction system is in a state of equilibrium of generation and decomposition. Therefore, it is concluded that the general reaction pathways are according to the following routes, as illustrated and described in Fig. 11.
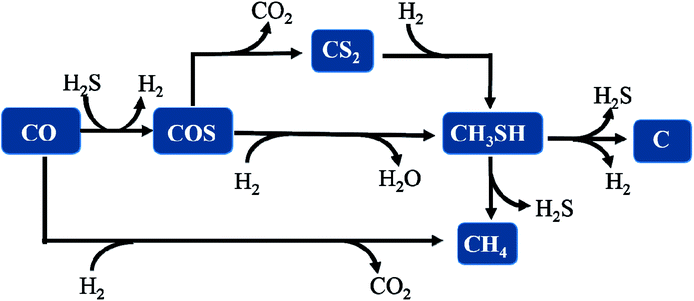 |
| | Fig. 11 The reaction pathway for synthesizing CH3SH from CO/H2S/H2 gas. | |
Thermodynamics study
Due to the fact that the thermodynamic analysis is an important criterion for the possibility and the degree of a chemical reaction, the feasibility of some important intermediate process involved in our reaction system was further demonstrated and discussed by using the results of thermodynamic calculation. Thermodynamic data (the changes of Gibbs free energy and enthalpy, equilibrium constant) of CH3SH-free reactions were determined by using HSC Chemistry 5.1 software, however, as a result of the lack of the fundamental parameter about CH3SH in the HSC software, the corresponding thermodynamics data of CH3SH-containing reactions were calculated by the Kirchhoff Law44 and the modified Gibbs–Helmholtz equation.45,46 The fundamental thermodynamic parameter of partial substances for reactions containing CH3SH are compiled in the Table 1-S (shown in the ESI†). The considerable of these calculation formulas as a feasible method could be ascribed to the fact that each reaction was performed under the condition of constant low pressure (0.2 MPa) and constant high temperature (≥548 K), which could be deemed to be the ideal gas and satisfied the applicable conditions of above equations.
The thermodynamic data of all the reactions were calculated and summarized in the Tables 2-S and 3-S in the ESI.† Gibbs free energy change and equilibrium constant of main reactions to produce CH3SH and CO2 are displayed in Fig. 12 and 13, respectively. Two reactions involving the hydrogenation of COS to produce CH3SH (eqn (3) and (4)) should be firstly taken into account owing to the uncertainty whether these two reactions could automatically occur and which reaction is predominant. It can be observed from Table 2-S† that two reactions related to the formation of CH3SH at the temperature range of 548 K to 648 K are exothermic. From the thermodynamic point of view, it seems to be indicated that the increase of reaction temperature would facilitate the process of reactions (3) and (4). In combination with the changes of Gibbs free energy and equilibrium constant from Fig. 12 and Table 2-S,† it could be concluded that both the reactions (3) and (4) might occur spontaneously in thermodynamics (ΔGr(T) < 0). This further confirms our experimental results that the reaction (3) and (4) should be presented simultaneously in the reaction system. Moreover, the thermodynamic equilibrium constant of reaction (4) (= 1.19 × 10⁴ at 573 K) is about three order greater in magnitude than that of the reaction (3) (= 23.77 at 573 K). This result signifies that, in thermodynamics, reaction (4) might easily occur than the reaction (3).
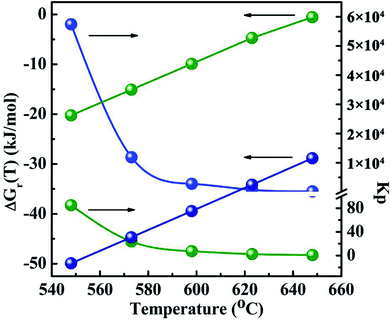 |
| | Fig. 12 The Gibbs free energy changes and thermodynamic equilibrium constants of main reactions as a function of temperature. The blue light ball: COS + 3H2 → CH3SH + H2O eqn (3); the green light ball: 2COS + 3H2 → CH3SH + CO2 + H2S eqn (4). | |
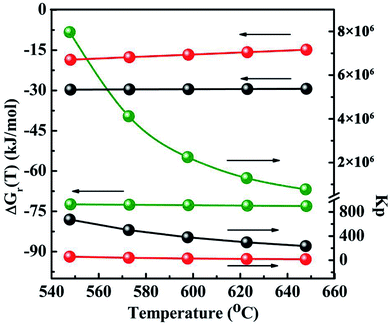 |
| | Fig. 13 The Gibbs 4free energy changes and thermodynamic equilibrium constants of side reactions as a function of temperature. The black light ball: COS + H2O → CO2 + H2S eqn (6); the red light ball: CO + H2O → CO2 + H2; eqn (7); the green light ball: CS2 + 2H2O → CO2 + 2H2S eqn (8). | |
Another several uncertain side pathways are the reactions to form by-products CO2 by the hydrolysis of COS, CO and CS2 via the reactions of (6)–(8), respectively. The thermodynamic data are shown in Fig. 13 and Table 3-S(A).† As seen from the results, all the hydrolysis reactions are deemed to be exothermic and could occur spontaneously. Among them, the equilibrium constant of the hydrolysis reaction of CS2 (Kp ≈ 106) is the maximum, suggesting that it is more likely to occur than the other two reactions in thermodynamics. As the reaction temperature increasing, the equilibrium constant of hydrolysis reaction of CS2 keeps the same order of magnitude. Therefore, it seems to be considered that the impact of temperature on this reaction turns out to be very small. However, the influence of temperature on thermodynamic equilibrium constant for the hydrogenation of CS2 is relative larger than that of the hydrolysis of CS2, which suggests that increasing reaction temperature do not facilitate the hydrogenation of CS2. In order to further corroborate the accuracy of the method calculated by thermodynamic equations on the CH3SH-containing reactions, the thermodynamic data of three hydrolysis reactions are both calculated by the thermodynamic equations and HSC software, and the corresponding results are tabulated in Table 3-S(B).† It can be observed that the reaction enthalpy change, Gibbs free energy change and equilibrium constant of these reactions calculated by thermodynamic equations are in good agreement with HSC software.
The corresponding catalytic reaction mechanism for the conversion of CO/H2/H2S to CH3SH over SBA-15 supported K–Mo catalysts are clarified briefly. In general, in the conversion of CO/H2/H2S to CH3SH, CO was firstly reacted with H2S to produce COS, and subsequently, the direct or indirect hydrogenation of COS results in the generation of CH3SH. In our previous work, sulfided MoS2 catalyst without the addition of K species was demonstrated to have no ability to produce CH3SH, while the incorporation of K species into MoS2 species gives rise to the significant generation of CH3SH.26 Thus, the synergistic interaction between K and MoS2 species is crucial to the generation of CH3SH. It is known that the sulfur vacancies over MoS2 phases derived from the removal of sulfur species weakly bonded with molybdenum in the reaction process can activate the reactant molecules of CO, H2, H2S and were the reactive active sites. In our reaction system (CO/H2/H2S), CO and H2S molecules were thus non-dissociatively and dissociatively absorbed on the sulfur vacancies, respectively, to generate the intermediate, COS. With the activation of H2 molecule over the sulfur vacancies, the further direct or indirect hydrogenation of COS leads to the formation of CH3SH via stabilizing C–S bond by K species.22,23
Conclusion
The influences of the impregnation sequence on the conversion of CO and the selectivity of CH3SH, COS, CO2 and CH4 over SBA-15 supported Mo based catalysts were investigated and compared. The catalytic performances of catalysts are in the order of K–Mo/SBA-15 > K/Mo/SBA-15 > Mo/K/SBA-15. Based on the characterizations results, two K-containing Mo oxides (K2Mo2O7 and K2MoO4) were detected as main species in the oxidized samples, and amorphous MoS2 is predominated in the corresponding sulfided and spent samples. The CO conversion was closely related to the amount of the edge reactive sulfur species that formed the sulfur vacancies over MoS2 phases. Combing experimental data with the results of thermodynamics analyses, the corresponding reaction pathways over K–Mo/SBA-15 were proposed. CO was firstly reacted with H2S to produce COS, and CH3SH was formed via two reaction pathways: the first one is the direct hydrogenation of COS, and the second one is the hydrogenation of CS2 originated from the disproportionation of COS. CH3SH in reaction system is in a state of equilibrium of generation and decomposition, the selectivity of CH3SH would decrease with the temperature increasing due to the enhancement of decomposition reaction and thermodynamic limit. Two reaction pathways were found to result in the decomposition of CH3SH, on the one hand, CH3SH is firstly converted into intermediates, CH3SCH3 and CH3SSCH3, and then those species can be decomposed into CH4 and H2S. On the other hand, some CH3SH could probably decompose to carbon, H2S and H2.
Conflicts of interest
There are no conflicts to declare.
Acknowledgements
We gratefully acknowledge the financial support of the research work from the National Natural Science Foundation of China (Grant No. 21367015, 21267011, 21667016 and U1402233), and Young Academic and Technical Leader Raising Foundation of Yunnan Province (Grant No. 2008py010).
References
- Y. Z. Li, H. L. Tong, Y. Q. Zhuo, S. J. Wang and X. C. Xu, Environ. Sci. Technol., 2010, 40, 7919–7924 CrossRef.
- Z. Zhang, Y. Zhu, H. Asakura, B. Zhang, J. Zhang, M. Zhou, Y. Han, T. Tanaka, A. Wang, T. Zhang and N. Yan, Nat. Commun., 2017, 8, 16100 CrossRef PubMed.
- J. G. Lu, Y. F. Zheng and D. L. He, Sep. Purif. Technol., 2006, 52, 209–217 CrossRef.
- D. K. Chen, D. D. He, J. C. Lu, L. P. Zhong, F. Liu, J. P. Liu, J. Yu, G. P. Wan, S. F. He and Y. M. Luo, Appl. Catal., B, 2017, 218, 249–259 CrossRef.
- V. P. Santos, B. V. D. Linden, A. Chojecki, G. Budroni, S. Corthals, H. Shibata, G. R. Meima, F. Kapteijn, M. Makkee and J. Gascon, ACS Catal., 2013, 3, 1634–1637 CrossRef.
- R. Andersson, M. Boutonnet and S. Järås, Fuel, 2014, 115, 544–550 CrossRef.
- Y. Q. Yang, Y. Z. Yuan, S. J. Dai, B. Wang and H. B. Zhan, Catal. Lett., 1998, 54, 65–68 CrossRef.
- J. Olin, B. Buchholz, B. Love, R. Goshorn, U.S. Patent No. 3070632. 1962.
- Y. Zhang, S. Chen, M. Wu, W. P. Fang and Y. Q. Yang, Catal. Commun., 2012, 22, 48–51 CrossRef.
- T. J. Paskach, G. L. Schrader and R. E. McCarley, J. Catal., 2002, 211, 285–295 CrossRef.
- J. Sauer, W. Boeck, L. V. Hippel, W. Burkhardt, S. Rautenberg, D. Arntz, W. Hofen, US. Pat. No. 5852219. 1998.
- V. Mashkin, V. Kudenkov and A. V. Mashkina, Ind. Eng. Chem. Res., 1995, 34, 2964–2970 CrossRef.
- J. C. Lu, X. F. Li, S. F. He, C. Y. Han, G. P. Wan, Y. Q. Lei, R. Chen, P. Liu, K. Z. Chen, L. Zhang and Y. M. Luo, Int. J. Hydrogen Energy, 2017, 42, 3647–3657 CrossRef.
- Y. Q. Yang, Y. J. Hao, A. P. Chen, Q. Wang, L. M. Yang, Q. L. Li, S. J. Dai, W. P. Fang, J. O. Barth, C. Wecbecker, K. Hutmacher, US. Pat. No. 0286448 A1. 2010.
- Y. Q. Yang, H. Yang, Q. Wang, L. J. Yu, C. Wang, S. J. Dai and Y. Z. Yuan, Catal. Lett., 2001, 74, 221–225 CrossRef.
- A. P. Chen, Q. Wang, Y. J. Hao, W. P. Fang and Y. Q. Yang, Catal. Lett., 2008, 121, 260–265 CrossRef.
- S. J. Dai, Y. Q. Yang, Y. Z. Yuan, D. L. Tang, R. C. Lin and H. B. Zhang, Catal. Lett., 1999, 61, 157–160 CrossRef.
- Y. Q. Yang, S. J. Dai, Y. Z. Yuan, R. C. Lin, D. L. Tang and H. B. Zhang, Appl. Catal., A, 2000, 192, 175–180 CrossRef.
- J. Barrault, M. Boulinguiezb, C. Forquy and R. Maurel, Appl. Catal., 1987, 33, 309–330 CrossRef.
- B. J. Zhang, S. H. Taylor and G. J. Hutchings, New J. Chem., 2004, 28, 471–476 RSC.
- W. Cao, H. Zhang and Y. Yuan, Catal. Lett., 2003, 91, 243–246 CrossRef.
- O. Y. Gutiérrez, C. Kaufmann, A. Hrabar, Y. Z. Zhu and J. A. Lercher, J. Catal., 2011, 280, 264–273 CrossRef.
- O. Y. Gutiérrez, C. Kaufmann and J. A. Lercher, ACS Catal., 2011, 1, 1595–1603 CrossRef.
- S. Y. He, S. F. He, L. Zhang, X. F. Li, J. Wang, D. D. He, J. C. Lu and Y. M. Luo, Catal. Today, 2015, 258, 162–168 CrossRef.
- H. P. Pu, C. Y. Han, H. Wang, S. W. Xu, L. Y. Zhang, Y. Y. Zhang and Y. M. Luo, Appl. Surf. Sci., 2012, 258, 8895–8901 CrossRef.
- P. Liu, J. C. Lu, Z. Z. Xu, F. Liu, D. K. Chen, J. Yu, J. P. Liu, S. F. He, G. P. Wan and Y. M. Luo, Mol. Catal., 2017, 442, 39–48 CrossRef.
- S. Huang, S. F. He, L. Deng, J. Wang, D. D. He, J. C. Lu and Y. M. Luo, Procedia Eng., 2015, 102, 684–691 CrossRef.
- Y. M. Luo, Z. Y. Hou, R. T. Li and X. M. Zheng, Microporous Mesoporous Mater., 2008, 109, 583–589 CrossRef.
- Q. Liu, Y. Qiao, Y. Tian, F. Gu, Z. Zhong and F. Su, Ind. Eng. Chem. Res., 2017, 56, 9809–9820 CrossRef.
- V. Kettmann, P. Balgavy and L. Sokol, J. Catal., 1988, 112, 93–106 CrossRef.
- G. Schrader and C. Cheng, J. Catal., 1983, 80, 369–385 CrossRef.
- A. Cordova, P. Blanchard and C. Lancelot, ACS Catal., 2015, 5, 2966–2981 CrossRef.
- L. Qiu and G. Xu, Appl. Surf. Sci., 2010, 256, 3413–3417 CrossRef.
- B. M. Vogelaar, P. Steiner, T. F. Zijden, A. D. Langeveld, S. Eijsbouts and J. A. Moulijn, Appl. Catal., A, 2007, 318, 28–36 CrossRef.
- L. S. Byskov, B. Hammer, J. K. Norskov, B. S. Clausen and H. Topsoe, Catal. Lett., 1997, 47, 177–182 CrossRef.
- E. P. Polo, A. G. Alejandre, G. González and J. L. Brito, Catal. Lett., 2010, 135, 212–218 CrossRef.
- D. Ishutenko, P. Minaev, Y. Anashkin, M. Nikulshina, A. Mozhaev, K. Maslakov and P. Nikulshin, Appl. Catal., B, 2017, 203, 237–246 CrossRef.
- G. Mul, I. E. Wachs and A. S. Hirschon, Catal. Today, 2003, 78, 327–337 CrossRef.
- O. Y. Gutiérrez, C. Kaufmann and J. A. Lercher, ChemCatChem, 2011, 3, 1480–1490 CrossRef.
- O. Y. Gutiérrez, L. S. Zhong, Y. Z. Zhu and J. A. Lercher, ChemCatChem, 2013, 5, 3249–3259 CrossRef.
- Q. Liu, Y. Tianab and H. Ai, RSC Adv., 2016, 6, 20971 RSC.
- A. C. Ferrari and J. Robertson, Phys. Rev. B, 2000, 61, 14095 CrossRef.
- J. C. Lu, H. S. Hao, L. M. Zhang, Z. Z. Xu, L. P. Zhong, Y. T. Zhao, D. D. He, J. P. Liu, D. K. Chen, H. P. Pu, S. F. He and Y. M. Luo, Appl. Catal., B, 2018, 237, 185–197 CrossRef.
- J. W. Tester and M. Modell, Thermodynamics and its Applications, Prentice Hall PTR, 1997 Search PubMed.
- B. E. Poling, J. M. Prausnitz and J. P. Oconnell, The properties of gases and liquids, New York: Mcgraw-hill, 2001 Search PubMed.
- D. R. Lide, J. Shackleton, T. Desai, N. Kamaly, M. Griffiths and L. Braschi, CRC Handbook of Chemical and Physics, 84th edn, 2003-2004 Search PubMed.
Footnote |
| † Electronic supplementary information (ESI) available. See DOI: 10.1039/c8ra03430c |
|
| This journal is © The Royal Society of Chemistry 2018 |
Click here to see how this site uses Cookies. View our privacy policy here.  Open Access Article
 *a
*a
![[thin space (1/6-em)]](https://www.rsc.org/images/entities/char_2009.gif) :
:![[thin space (1/6-em)]](https://www.rsc.org/images/entities/char_2009.gif) 5
5![[thin space (1/6-em)]](https://www.rsc.org/images/entities/char_2009.gif) :
:![[thin space (1/6-em)]](https://www.rsc.org/images/entities/char_2009.gif) 4) was introduced into the reactor under the conditions of P = 0.2 MPa, GHSV = 1000 h−1 with different reaction temperature (523–673 K). Prior to each activity evaluation measurements, all the samples were presulfided in the gas stream with CO/H2S/H2 = 1
4) was introduced into the reactor under the conditions of P = 0.2 MPa, GHSV = 1000 h−1 with different reaction temperature (523–673 K). Prior to each activity evaluation measurements, all the samples were presulfided in the gas stream with CO/H2S/H2 = 1![[thin space (1/6-em)]](https://www.rsc.org/images/entities/char_2009.gif) :
:![[thin space (1/6-em)]](https://www.rsc.org/images/entities/char_2009.gif) 5
5![[thin space (1/6-em)]](https://www.rsc.org/images/entities/char_2009.gif) :
:![[thin space (1/6-em)]](https://www.rsc.org/images/entities/char_2009.gif) 4 (30 ml min−1) at 553 K for 6 h. Those catalysts are denoted as sulfided samples. After the catalytic activity test, all the catalysts were denoted as spent samples. Reaction products were online detected using three GC fitted with one flame ionization detector (FID), two flame photometric detectors (FPD) and two thermal conductivity detectors (TCD). Carbon hydrogen components including CH3SH, CH4, little C2H4 and C2H6 were detected by FID with a porapak Q column. Two FPD equipping with the same HP-Plot/Q capillary column and two different volume of six-way valve were employed to detect different concentration (0.1 ppm to 150000 ppm) of sulfur-containing matters including COS, CS2, CH3SH and H2S. TCDs equipped with TDX-01 carbon molecular sieve and porapak Q column were used to detect H2, CO, CO2 and H2O. The CO conversion and products selectivity were calculated by the following equation:
4 (30 ml min−1) at 553 K for 6 h. Those catalysts are denoted as sulfided samples. After the catalytic activity test, all the catalysts were denoted as spent samples. Reaction products were online detected using three GC fitted with one flame ionization detector (FID), two flame photometric detectors (FPD) and two thermal conductivity detectors (TCD). Carbon hydrogen components including CH3SH, CH4, little C2H4 and C2H6 were detected by FID with a porapak Q column. Two FPD equipping with the same HP-Plot/Q capillary column and two different volume of six-way valve were employed to detect different concentration (0.1 ppm to 150000 ppm) of sulfur-containing matters including COS, CS2, CH3SH and H2S. TCDs equipped with TDX-01 carbon molecular sieve and porapak Q column were used to detect H2, CO, CO2 and H2O. The CO conversion and products selectivity were calculated by the following equation:
![[thin space (1/6-em)]](https://www.rsc.org/images/entities/char_2009.gif) :
:![[thin space (1/6-em)]](https://www.rsc.org/images/entities/char_2009.gif) H2S
H2S![[thin space (1/6-em)]](https://www.rsc.org/images/entities/char_2009.gif) :
:![[thin space (1/6-em)]](https://www.rsc.org/images/entities/char_2009.gif) N2 = 1
N2 = 1![[thin space (1/6-em)]](https://www.rsc.org/images/entities/char_2009.gif) :
:![[thin space (1/6-em)]](https://www.rsc.org/images/entities/char_2009.gif) 1
1![[thin space (1/6-em)]](https://www.rsc.org/images/entities/char_2009.gif) :
:![[thin space (1/6-em)]](https://www.rsc.org/images/entities/char_2009.gif) 8 (30 ml min−1).
8 (30 ml min−1).![[thin space (1/6-em)]](https://www.rsc.org/images/entities/char_2009.gif) :
:![[thin space (1/6-em)]](https://www.rsc.org/images/entities/char_2009.gif) H2
H2![[thin space (1/6-em)]](https://www.rsc.org/images/entities/char_2009.gif) :
:![[thin space (1/6-em)]](https://www.rsc.org/images/entities/char_2009.gif) N2 = 1
N2 = 1![[thin space (1/6-em)]](https://www.rsc.org/images/entities/char_2009.gif) :
:![[thin space (1/6-em)]](https://www.rsc.org/images/entities/char_2009.gif) 1
1![[thin space (1/6-em)]](https://www.rsc.org/images/entities/char_2009.gif) :
:![[thin space (1/6-em)]](https://www.rsc.org/images/entities/char_2009.gif) 8 (30 ml min−1).
8 (30 ml min−1).![[thin space (1/6-em)]](https://www.rsc.org/images/entities/char_2009.gif) :
:![[thin space (1/6-em)]](https://www.rsc.org/images/entities/char_2009.gif) H2
H2![[thin space (1/6-em)]](https://www.rsc.org/images/entities/char_2009.gif) :
:![[thin space (1/6-em)]](https://www.rsc.org/images/entities/char_2009.gif) CO
CO![[thin space (1/6-em)]](https://www.rsc.org/images/entities/char_2009.gif) :
:![[thin space (1/6-em)]](https://www.rsc.org/images/entities/char_2009.gif) N2 = 1
N2 = 1![[thin space (1/6-em)]](https://www.rsc.org/images/entities/char_2009.gif) :
:![[thin space (1/6-em)]](https://www.rsc.org/images/entities/char_2009.gif) 1
1![[thin space (1/6-em)]](https://www.rsc.org/images/entities/char_2009.gif) :
:![[thin space (1/6-em)]](https://www.rsc.org/images/entities/char_2009.gif) 1
1![[thin space (1/6-em)]](https://www.rsc.org/images/entities/char_2009.gif) :
:![[thin space (1/6-em)]](https://www.rsc.org/images/entities/char_2009.gif) 7 (30 ml min−1).
7 (30 ml min−1).![[thin space (1/6-em)]](https://www.rsc.org/images/entities/char_2009.gif) :
:![[thin space (1/6-em)]](https://www.rsc.org/images/entities/char_2009.gif) 4 (30 ml min−1);
4 (30 ml min−1);![[thin space (1/6-em)]](https://www.rsc.org/images/entities/char_2009.gif) :
:![[thin space (1/6-em)]](https://www.rsc.org/images/entities/char_2009.gif) 5 (30 ml min−1);
5 (30 ml min−1);
 ), MoS2 (
 ), K2Mo2O7 (
 ), K2MoO4 (
 ), K2SO4 (
 ), K2S2O8 (
 ).
).
![[thin space (1/6-em)]](https://www.rsc.org/images/entities/char_2009.gif) :
:![[thin space (1/6-em)]](https://www.rsc.org/images/entities/char_2009.gif) 5
5![[thin space (1/6-em)]](https://www.rsc.org/images/entities/char_2009.gif) :
:![[thin space (1/6-em)]](https://www.rsc.org/images/entities/char_2009.gif) 4) to synthesize CH3SH over three catalysts (shown in Fig. 3-S of ESI†), thus it is necessary to investigate if there are some other reactions that can generate water. Totally, four reactions in our reaction system possibly produce H2O as listed in the follows: COS + 3H2 → CH3SH + H2O (eqn (3)); CO2 + H2S → COS + H2O (the reverse reaction of eqn (6)); CO2 + H2 → CO + H2O (the reverse reaction of eqn (8)); CO + 3H2 → CH4 + H2O (eqn (7)). K–Mo/SBA-15 was selected to investigate the catalytic performance of above-mentioned reactions in the following. For the reverse reaction of eqn (6), the usage of CO2
4) to synthesize CH3SH over three catalysts (shown in Fig. 3-S of ESI†), thus it is necessary to investigate if there are some other reactions that can generate water. Totally, four reactions in our reaction system possibly produce H2O as listed in the follows: COS + 3H2 → CH3SH + H2O (eqn (3)); CO2 + H2S → COS + H2O (the reverse reaction of eqn (6)); CO2 + H2 → CO + H2O (the reverse reaction of eqn (8)); CO + 3H2 → CH4 + H2O (eqn (7)). K–Mo/SBA-15 was selected to investigate the catalytic performance of above-mentioned reactions in the following. For the reverse reaction of eqn (6), the usage of CO2![[thin space (1/6-em)]](https://www.rsc.org/images/entities/char_2009.gif) :
:![[thin space (1/6-em)]](https://www.rsc.org/images/entities/char_2009.gif) H2S
H2S![[thin space (1/6-em)]](https://www.rsc.org/images/entities/char_2009.gif) :
:![[thin space (1/6-em)]](https://www.rsc.org/images/entities/char_2009.gif) N2 = 1
N2 = 1![[thin space (1/6-em)]](https://www.rsc.org/images/entities/char_2009.gif) :
:![[thin space (1/6-em)]](https://www.rsc.org/images/entities/char_2009.gif) 1
1![[thin space (1/6-em)]](https://www.rsc.org/images/entities/char_2009.gif) :
:![[thin space (1/6-em)]](https://www.rsc.org/images/entities/char_2009.gif) 8 (30 ml min−1) as reactants was investigated and the result is presented in Fig. 6A. It is seen that the conversion of CO2 is pretty low (2–4%) and there is also no water peak found in TCD (shown in Fig. 2-S(A) of ESI†), indicating that large amount of water is not possibly produced from eqn (6). For the reverse reaction of eqn (8), CO2
8 (30 ml min−1) as reactants was investigated and the result is presented in Fig. 6A. It is seen that the conversion of CO2 is pretty low (2–4%) and there is also no water peak found in TCD (shown in Fig. 2-S(A) of ESI†), indicating that large amount of water is not possibly produced from eqn (6). For the reverse reaction of eqn (8), CO2![[thin space (1/6-em)]](https://www.rsc.org/images/entities/char_2009.gif) :
:![[thin space (1/6-em)]](https://www.rsc.org/images/entities/char_2009.gif) H2
H2![[thin space (1/6-em)]](https://www.rsc.org/images/entities/char_2009.gif) :
:![[thin space (1/6-em)]](https://www.rsc.org/images/entities/char_2009.gif) N2 = 1
N2 = 1![[thin space (1/6-em)]](https://www.rsc.org/images/entities/char_2009.gif) :
:![[thin space (1/6-em)]](https://www.rsc.org/images/entities/char_2009.gif) 1
1![[thin space (1/6-em)]](https://www.rsc.org/images/entities/char_2009.gif) :
:![[thin space (1/6-em)]](https://www.rsc.org/images/entities/char_2009.gif) 8 (30 ml min−1) was used to research the reaction completion degree and the result is shown in Fig. 6B. The conversion of CO2 is rising with the temperature increasing and reaches the maximal value at 673 K, while only 13.46% CO2 was converted, more importantly, the peak of water cannot be found in the TCD (shown in Fig. 2-S(B) of ESI†). Actually, this reverse water gas shift reaction is hardly to occur in this condition due to the high concentration of CO atmosphere in the system, the water gas shift reaction is more likely to happen under that condition. The sequence experiment of the reverse water gas shift reaction with adding 10% CO (v/v) also confirms our view. As for eqn (7), using CO/H2 = 1
8 (30 ml min−1) was used to research the reaction completion degree and the result is shown in Fig. 6B. The conversion of CO2 is rising with the temperature increasing and reaches the maximal value at 673 K, while only 13.46% CO2 was converted, more importantly, the peak of water cannot be found in the TCD (shown in Fig. 2-S(B) of ESI†). Actually, this reverse water gas shift reaction is hardly to occur in this condition due to the high concentration of CO atmosphere in the system, the water gas shift reaction is more likely to happen under that condition. The sequence experiment of the reverse water gas shift reaction with adding 10% CO (v/v) also confirms our view. As for eqn (7), using CO/H2 = 1![[thin space (1/6-em)]](https://www.rsc.org/images/entities/char_2009.gif) :
:![[thin space (1/6-em)]](https://www.rsc.org/images/entities/char_2009.gif) 4 (30 ml min−1) as the reactant gas was investigated and the result is shown in Fig. 7. It can be found that the CO conversion is pretty low and the main product is CH4 and CO2 with a little C2H4 and C2H6, this indicating the generation of CH4 from CO with H2 (2CO + 2H2 → CH4 + CO2)41 instead of the reaction (CO + 3H2 → CH4 + H2O). Accordingly, large amount of water in system is produced from the hydrogenation of COS (eqn (3)) which indicates the first reaction pathway would happen certainly.
4 (30 ml min−1) as the reactant gas was investigated and the result is shown in Fig. 7. It can be found that the CO conversion is pretty low and the main product is CH4 and CO2 with a little C2H4 and C2H6, this indicating the generation of CH4 from CO with H2 (2CO + 2H2 → CH4 + CO2)41 instead of the reaction (CO + 3H2 → CH4 + H2O). Accordingly, large amount of water in system is produced from the hydrogenation of COS (eqn (3)) which indicates the first reaction pathway would happen certainly.![[thin space (1/6-em)]](https://www.rsc.org/images/entities/char_2009.gif) :
:![[thin space (1/6-em)]](https://www.rsc.org/images/entities/char_2009.gif) 5 as reactant gas (denote as R(CO/H2S)) was shown in Fig. 8(A) and used to compare with the reaction using CO/H2S/H2 as reactant gas in Fig. 8(B) (denote as R(CO/H2S/H2)). The only difference between R(CO/H2S/H2) and R(CO/H2S) is the concentration of H2 in reaction system. The amount of hydrogen in the first reaction is sufficient but it is shortage in the second reaction because H2 in the system of R(CO/H2S) can be generated from eqn (2). In R(CO/H2S) system, the selectivities of two main species COS and CS2 are found to be 33–32% and 6–15% from 523 K to 675 K, respectively. The presence of large amount of CS2 in R(CO/H2S) system indicates that CS2 is the significant intermediate species and the disproportionation of COS (eqn (4-1)) occurs indeed. In R(CO/H2S/H2) system, however, it is found that the corresponding selectivities of two species decrease largely (16–8% and 0–1.4% from 523 K to 675 K, respectively). It suggests that the addition of hydrogen leads to the large consumption of COS and CS2, indicating the hydrogenation of CS2 has happened as eqn (4-2). In basis of the above facts, we proposed that two reaction pathways may be occurred simultaneously in our reaction system. Comparison of the selectivity of CO2 between R(CO/H2S/H2) and R(CO/H2S) also demonstrates this point. The corresponding result is displayed in Fig. 8(C). As we known, if only the former reaction pathway, i.e., the hydrogenation of COS accompanied by reaction of COS and H2O to generate CO2, exists, the amount of CO2 in H2-rich system (R(CO/H2S/H2)) would be lower than that in H2-deficient system (R(CO/H2S)) because more H2 was added and then more COS was consumed to generate CH3SH, instead of CO2. While if only the latter reaction pathway, i.e., the disproportionation of COS followed by the hydrogenation of CS2, is presented, the amount of CO2 in H2-rich system (R(CO/H2S/H2)) would be higher than that in H2-deficient system (R(CO/H2S)) because more H2 was added and then more CS2 was consumed, leading to a big surplus of CO2. However, in our work, the selectivity of CO2 between R(CO/H2S/H2) and R(CO/H2S) exhibits interlaced results at all the reaction temperature range (Fig. 8C), which confirms the coexistence of two reaction pathways. Moreover, large amount of by-product CO2 is found to be presented in the products and is almost stabilized at all the reaction temperature region. This generated CO2 is mainly derived from the disproportionation of COS from eqn (4-1) and the hydrolysis of COS, CO, CS2 from eqn (6)–(8) respectively.
5 as reactant gas (denote as R(CO/H2S)) was shown in Fig. 8(A) and used to compare with the reaction using CO/H2S/H2 as reactant gas in Fig. 8(B) (denote as R(CO/H2S/H2)). The only difference between R(CO/H2S/H2) and R(CO/H2S) is the concentration of H2 in reaction system. The amount of hydrogen in the first reaction is sufficient but it is shortage in the second reaction because H2 in the system of R(CO/H2S) can be generated from eqn (2). In R(CO/H2S) system, the selectivities of two main species COS and CS2 are found to be 33–32% and 6–15% from 523 K to 675 K, respectively. The presence of large amount of CS2 in R(CO/H2S) system indicates that CS2 is the significant intermediate species and the disproportionation of COS (eqn (4-1)) occurs indeed. In R(CO/H2S/H2) system, however, it is found that the corresponding selectivities of two species decrease largely (16–8% and 0–1.4% from 523 K to 675 K, respectively). It suggests that the addition of hydrogen leads to the large consumption of COS and CS2, indicating the hydrogenation of CS2 has happened as eqn (4-2). In basis of the above facts, we proposed that two reaction pathways may be occurred simultaneously in our reaction system. Comparison of the selectivity of CO2 between R(CO/H2S/H2) and R(CO/H2S) also demonstrates this point. The corresponding result is displayed in Fig. 8(C). As we known, if only the former reaction pathway, i.e., the hydrogenation of COS accompanied by reaction of COS and H2O to generate CO2, exists, the amount of CO2 in H2-rich system (R(CO/H2S/H2)) would be lower than that in H2-deficient system (R(CO/H2S)) because more H2 was added and then more COS was consumed to generate CH3SH, instead of CO2. While if only the latter reaction pathway, i.e., the disproportionation of COS followed by the hydrogenation of CS2, is presented, the amount of CO2 in H2-rich system (R(CO/H2S/H2)) would be higher than that in H2-deficient system (R(CO/H2S)) because more H2 was added and then more CS2 was consumed, leading to a big surplus of CO2. However, in our work, the selectivity of CO2 between R(CO/H2S/H2) and R(CO/H2S) exhibits interlaced results at all the reaction temperature range (Fig. 8C), which confirms the coexistence of two reaction pathways. Moreover, large amount of by-product CO2 is found to be presented in the products and is almost stabilized at all the reaction temperature region. This generated CO2 is mainly derived from the disproportionation of COS from eqn (4-1) and the hydrolysis of COS, CO, CS2 from eqn (6)–(8) respectively.


