
 Open Access Article
 This Open Access Article is licensed under a Creative Commons Attribution-Non Commercial 3.0 Unported Licence
Multicolor carbon nanodots from food waste and their heavy metal ion detection application
Ying Zhoua,
Yao Liub,
Yeqing Lic,
Ziying Hec,
Quan Xu *c,
Yusheng Chend,
Jason Streete,
Hao Guof and
Michael Nelles*a
*c,
Yusheng Chend,
Jason Streete,
Hao Guof and
Michael Nelles*a
aFaculty of Agricultural and Environmental Sciences, Department Waste Management, University of Rostock, Justus-v.-Liebig-Weg 6, 18059 Rostock, Germany. E-mail: Michael.nelles@uni-rostock.de
bResearch Institute for New Materials Technology, Chongqing University of Arts and Sciences, Chongqing 402160, China
cState Key Laboratory of Heavy Oil Processing, Beijing Key Laboratory of Biogas Upgrading Utilization, China University of Petroleum-Beijing, 102249, China. E-mail: xuquan@cup.edu.cn
dDepartment of Chemistry, University of Akron, Ohio 44325, USA
eDepartment of Sustainable Bioproducts, Mississippi State University, Mississippi State, MS 39762, USA
fChongqing Institute of Forensic Science, Chongqing 400021, China
First published on 29th June 2018
Abstract
Multicolor carbon dots (C-dots) have excellent performance characteristics, high photoluminescence efficiency, ease of fabrication and low toxicity. C-dots have been used in a wide variety of fields including bioimaging, biomedicine, photocatalysis and environmental monitoring. The mass production of multicolor CDs using low-cost, facile methods is an important issue for future industrial applications. In this article, we reported a simple and highly effective way to prepare the multicolor C-dots and use them to detect heavy metal iron ions. Hydrochar acquired from food waste processed with hydrothermal carbonization (HTC) was used as the carbonaceous material for this process. Four colors of C-dots were obtained and included blue, green, yellow and red. These multicolor C-dots could be used as fluorescence probes with unique selectivity to detect the Fe3+ ion. The luminescence response ranged from 1 to 50 μM with a correlation coefficient of 0.9968. This discovery not only shows the high value-added products which can be obtained from food waste but can also lead to new developments in carbonaceous materials which can be used as “green resources”.
Introduction
Food waste (FW) is an important waste to recycle and recover because its components include a high organic/carbon content.1 The ability to utilize FW is a matter of great concern because the main disposal methods for FW include landfilling and incineration. Anaerobic digestion offers one solution for this problem; however, there are still issues involved with using this solution which include carbon emissions, and ecological, economic and social problems.2 Hydrothermal carbonization (HTC) is the thermochemical process used to convert the substrate within water into a liquid product and hydrochar.3,4 Due to no moisture limitations for feedstock and low greenhouse gas (GHG) emissions, HTC technology could be regarded as an eco-friendly method to dispose of FW.5 Furthermore, hydrochar (coal-like material) is the main product from HTC which has large specific surface, porous structure and abundant surface oxygenic functional groups.6 These carbon nanoparticles with surface-end groups7 have the potential to produce functional carbon-based materials which have applications as heavy metal adsorbents, soil additives, and electrode materials.8In terms of carbonaceous nanomaterials, “green resources” have low toxicity when compared with semiconducting quantum dots and can be regarded as promising candidates for the production of photoluminescent materials.9 Among numerous kinds of nanomaterials such as carbon nanotubes, fullerenes and graphene, carbon dots (C-dots) have drawn much attention because of their photoelectrocatalytic efficiency, ease of fabrication and low cost.10 C-dots are quasi-spherical nanoparticles which are composed of a carbon skeleton with a diameter of less than 10 nm.11 The C-dots show excellent photoabsorption, photostability, photobleaching resistance, high water solubility, and chemical resistance properties with an ability to be easily functionalized.12 Fluorescent nanomaterials derived from these C-dots made using FW can be used in bioimaging, biomedicine and environmental monitoring.13 The ability to improve fluorescence performance has been an area of great interest in last 10 years.14 In most studies concerning this topic, surface-modification has been regarded as the standard method for fluorescence improvements and includes functionalization, passivation and atom doping. There has not been a great deal of study concerning the fluorescent property modification with the use of carbonaceous materials from various sources, especially concerning food waste.
Hydrochar was produced from food waste using a mild hydrothermal temperature and was used as a carbon-rich precursor to synthesize C-dots in this study. A top-down method of synthesis was used to obtain multicolor C-dots. The effect that different hydrochar preparation techniques had on the fluorescence properties of C-dots was studied to determine the most advantageous methodology to use. C-dots have been used to detect mercury ions which are toxic for the environment and are human health hazards. In terms of the top-down method, the formation of C-dots occurs through exfoliating small particles from carbonaceous materials derived from methods including arc-discharge, laser ablation or electrochemical synthesis.15 C-dots obtained from this method may have weak luminescent properties, but are ideal concerning sp2 structures.16 There are many influencing factors which affect the photoluminescence mechanism in C-dots and include molecular states, surface defects, size effect or the synergistic effect.17–19 Past studies show that photoluminescence emissions may be caused by surface or molecule states and an intrinsic band gap which is produced by confined sp2 conjugation in the core of C-dots.20 Carbon sources, synthetic methods and reaction conditions such as the type of solvent, temperature and pH are related to the multicolor emission of C-dots. Moreover, compared with quantum dots, surface groups make more of a contribution than the size effect concerning the photoluminescence color of C-dots. The unique photoluminescence properties of C-dots allow them to be used for applications involving ion detection including Fe3+, Cu2+, Hg2+ and Cr irons.21 Producing fluorescent probes with a high sensitivity and selectivity to detect toxic metal ions is important to help improve overall environmental conditions.22–24
Results and discussion
Characteristics of precursor – hydrochar
In this study, hydrochar was used as the precursor to synthesize multicolor C-dots. Fig. 1A shows the flow chart of the multicolor C-dots production and the two-part process. The first part of the process involved hydrochar production which used food waste as carbon source and HTC technology as the treatment method. The second part of the process involved using the hydrochar as the precursor. The hydrochar was refluxed in concentrated acid and dialyzed with varying sizes to obtain C-dots with four colors: blue, green, yellow and red. Fig. 1B shows the carbon distribution involving different conditions of the HTC process. The distribution of the carbon in the solid phase (SP) did not increase as the temperature increased within the same retention time. The carbon distribution of SP-225 °C was less when compared to the SP-195 °C sample. All of the samples had a carbon distribution proportion above 60%. Table 2 shows that the content of carbon in the hydrochar decreased as the temperature decreased. The hydrolysis of food waste is influenced by temperature and it would also effect processes including polymerization and aromatization, which modified the surface area or surface functional group of hydrochar differently.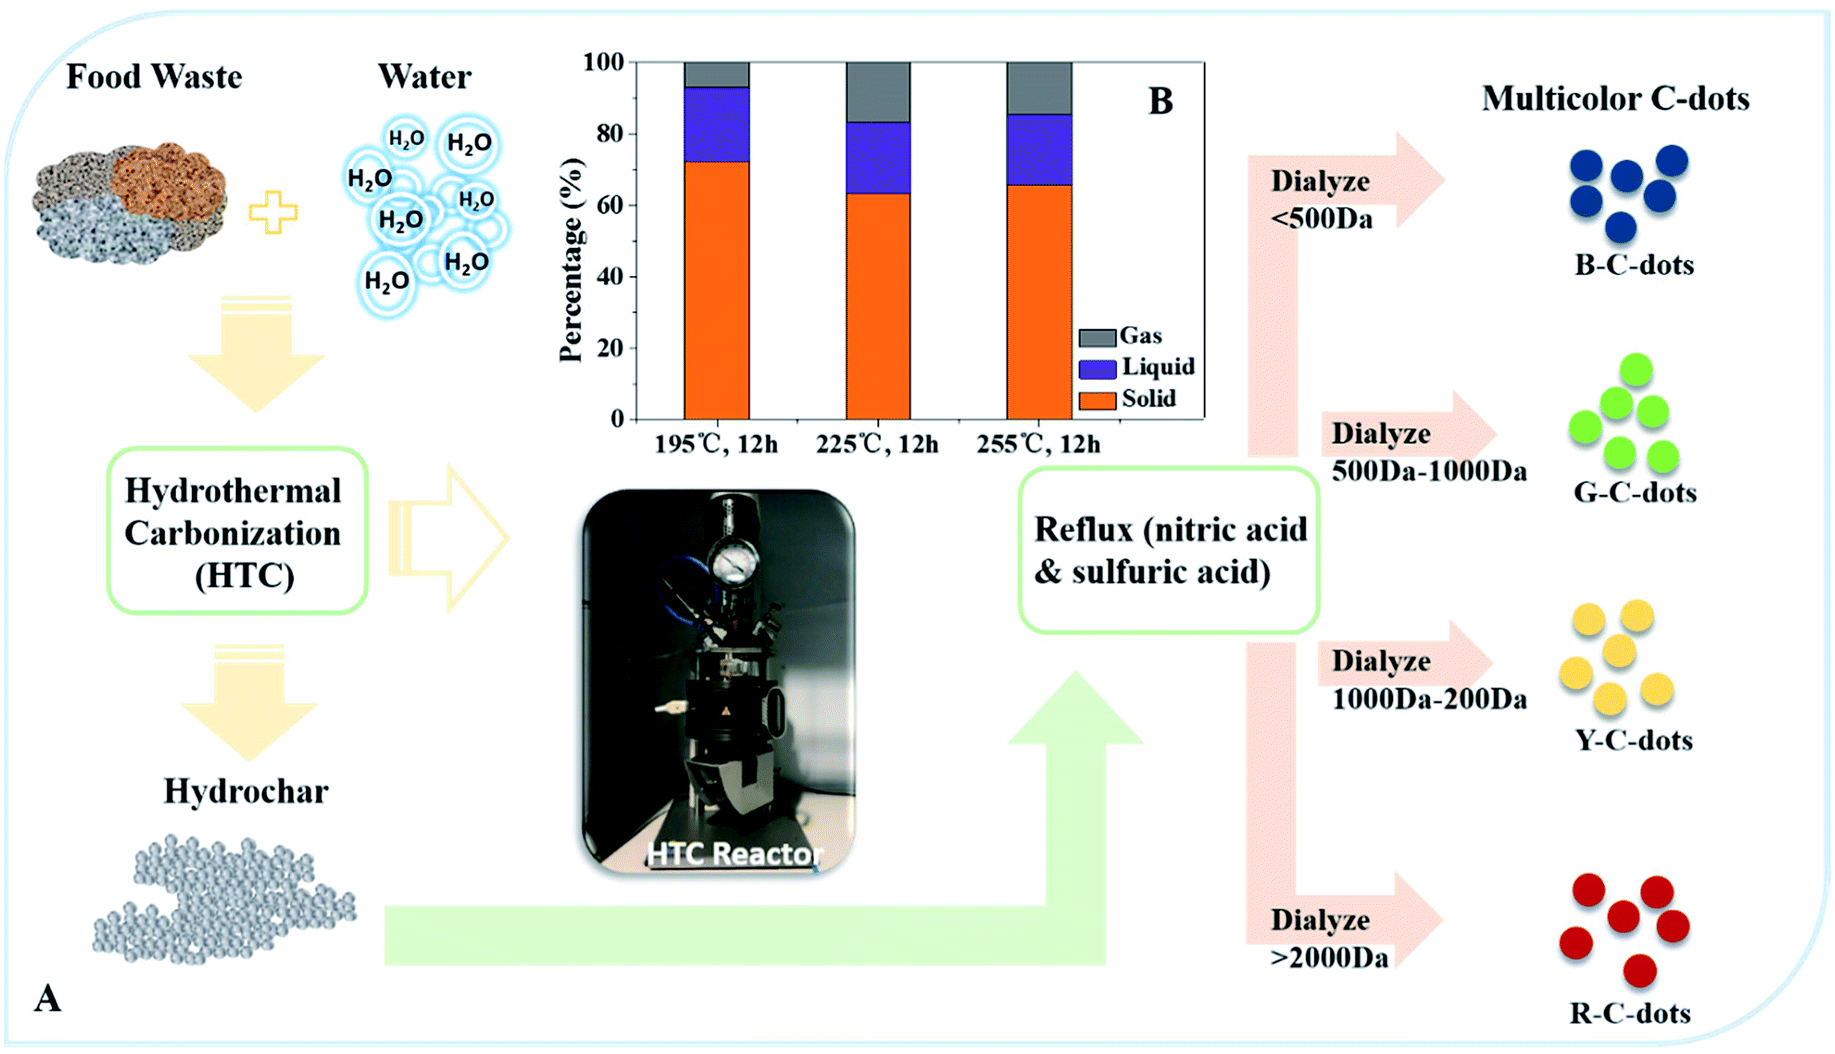 | ||
| Fig. 1 (A) Flow chart of multicolor C-dots production. (B) Carbon distribution in gas, liquid and solid phase from the new precursor production process. | ||
Characteristics of multicolor C-dots
The morphology and structure of multicolor C-dots were characterized by transmission electron microscopy (TEM) and atomic force microscopy (AFM). In terms of AFM imaging, a dilute solution of multicolor C-dots were dropped on flat mica substrates. The TEM image indicated that green (Fig. 2B and F) and yellow (Fig. 2C and G) C-dots ranged in size from 2 nm to 12 nm, respectively. The average diameters were 5.24 nm and 5.35 nm, respectively. Both the green and yellow C-dots had a spherical shape and were separated in solution. The red (Fig. 2D and H) C-dots one had an average diameter of 6.26 nm. The blue (Fig. 2A and E) C-dots had an average diameter of 5 nm. The photoluminescence of C-dots were dialyzed into four groups: less than 500 Da (Fig. 2I), from 500 Da to 1000 Da (Fig. 2J), from 1000–2000 Da (Fig. 2K), and more than 2000 Da (Fig. 2L). The samples were irradiated at varying wavelengths and studied in detail. Fig. 2J shows that as the λex varied from 400–470 nm, the peak position was not altered and only the intensity of λex decreased rapidly. The fluorescence color of these C-dots was green, and the result obviously showed the excitement independent property of the C-dots. This was primarily due to the homogeneous surface structure. Fig. 2I shows a slight shift of the peak position as the λex varied from 370–460 nm, and the fluorescence color for this sample was blue. The fluorescence peak positions of C-dots with a yellow and red color varied with the various intensities of the irradiated λex (Fig. 2K and L). The photoluminescence quantum yield was 28%, 18%, 10%, 6%, representing blue C-dots, green C-dots, yellow C-dots, red C-dots, respectively. In the lower-energy region, the yellow C-dots spectra exhibit distinct absorption bands at 420 and the green one also has absorption around 440 nm, indicating that these samples possessed different surface states25,26 (Fig. 3A).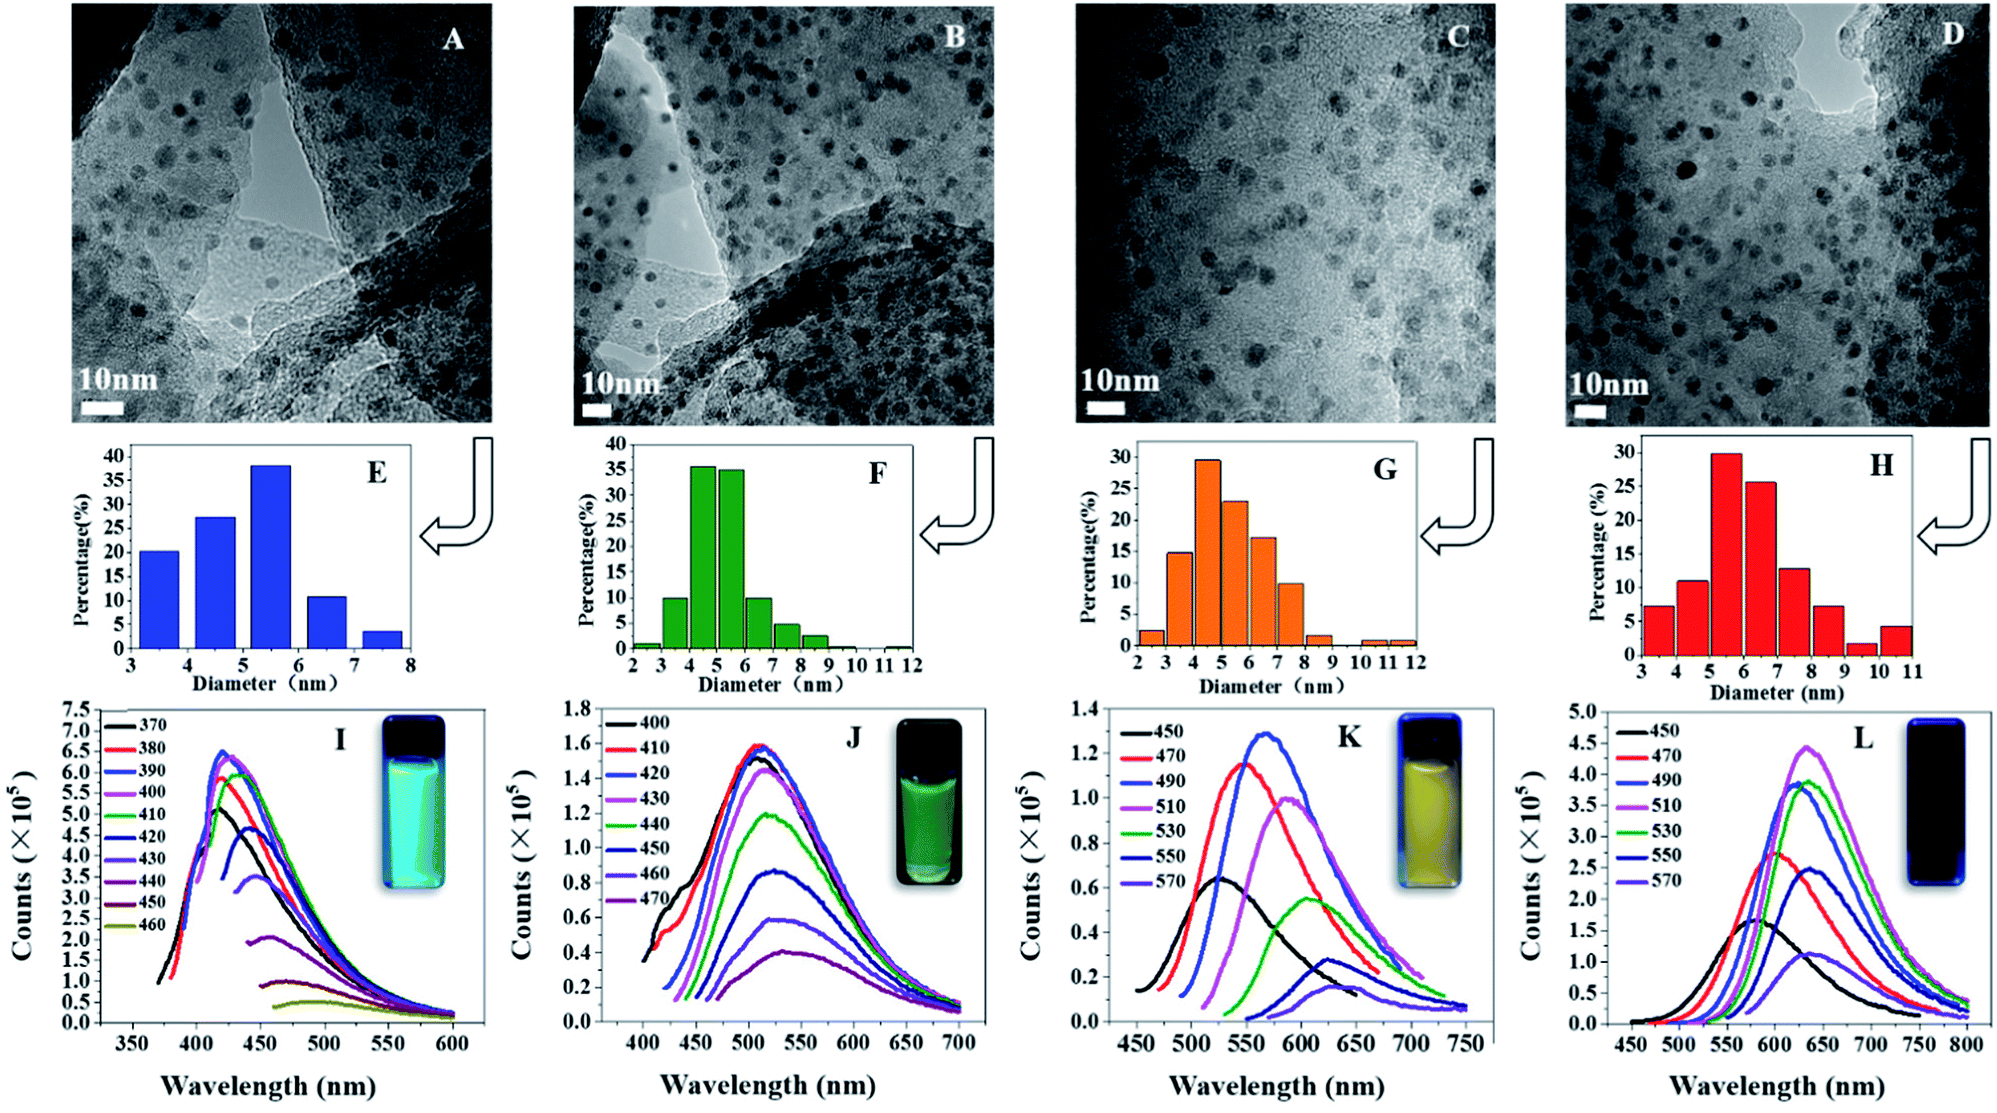 | ||
| Fig. 2 TEM image of four color C-dots (A–D), size distribution of four color C-dots (E–H), photoluminescence spectrum of four color C-dots (I–L). | ||
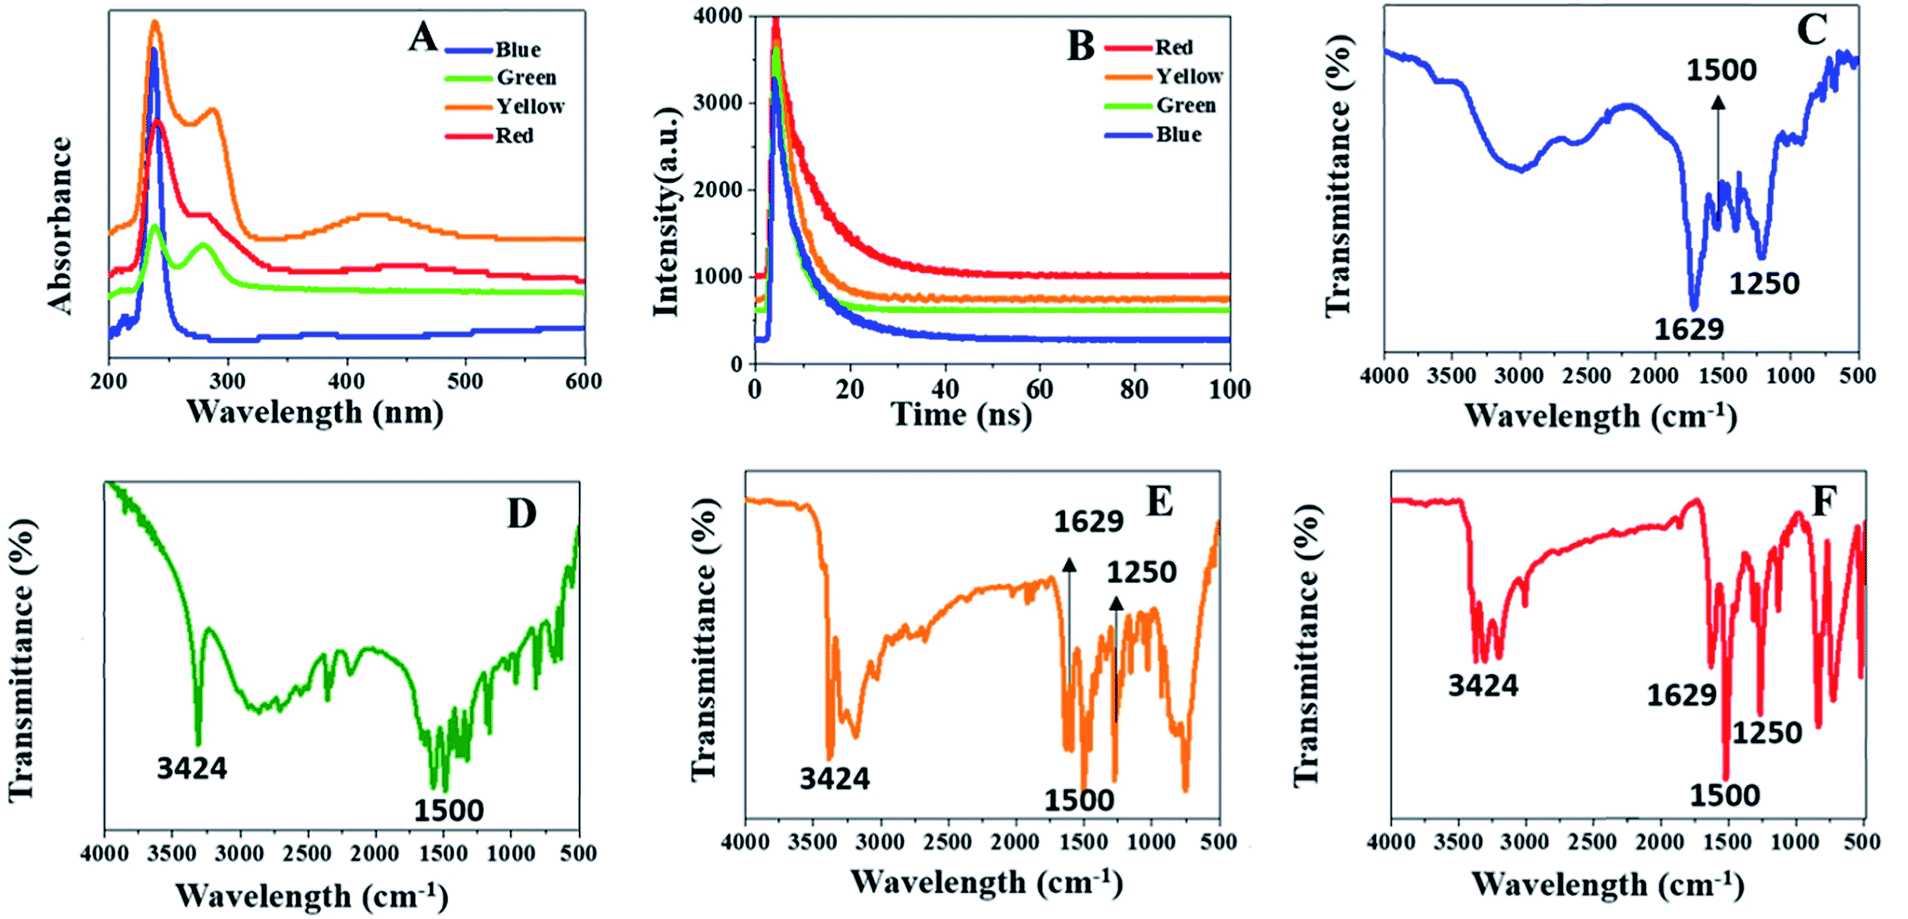 | ||
| Fig. 3 Optical absorption spectrum of C-dots (A). Life curve for of C-dots (B), FTIR of four colors C-dots (blue, green, yellow and red) (C–F). | ||
The FTIR spectrum specified the different functional groups found in the C-dots (Fig. 3C–F). With the exception of the green C-dots, the others had peaks found at 1250 cm−1 (which belonged to the C–O group) and 1629 cm−1 (which belonged to the C![[double bond, length as m-dash]](https://www.rsc.org/images/entities/char_e001.gif) O group). With the exception of the blue C-dots, the others had peaks located at 3424 cm−1 (which belonged to the O–H group) and 1500 cm−1 (which refers to a phenolic group). The C–N band at 1012 cm−1 and the CN band at 1549 cm−1 appear in the spectrum for the C-dots.
O group). With the exception of the blue C-dots, the others had peaks located at 3424 cm−1 (which belonged to the O–H group) and 1500 cm−1 (which refers to a phenolic group). The C–N band at 1012 cm−1 and the CN band at 1549 cm−1 appear in the spectrum for the C-dots.
To further gain insight into how the functional groups or chromophore affects the absorption and photoluminescence of C-dots, the C1s (Fig. 4A), N1s (Fig. 4B) and O1s (Fig. 4C) XPS spectra for four color C-dots were carefully examined. In the O1s (Fig. 4A) XPS spectrum, the four color C-dots have obvious change in the peaks of 287.8, the blue C-dots has a distinct peak at 287.8 eV (CO), while there is no peak found in red C-dots, indicating that the oxidation state of carbon was related to the absorption and photoluminescence of C-dots. The XPS spectrum of C1s is consistent with FTIR analysis, providing further evidence for oxidation state C was introduced in the reaction, serving as the passivation spots for the high fluorescence. In the N1s (Fig. 4B) XPS spectrum the peaks of the four color C-dots are shifted from 398.4 to 397.8 indicating the change in the chemical state of nitrogen element from pyrrolic N to pyridinic N. The nitrogen also played a critic role in the absorption. The O1s XPS spectrum (Fig. 4C) of the four color C-dots were consistent with C1s analysis.
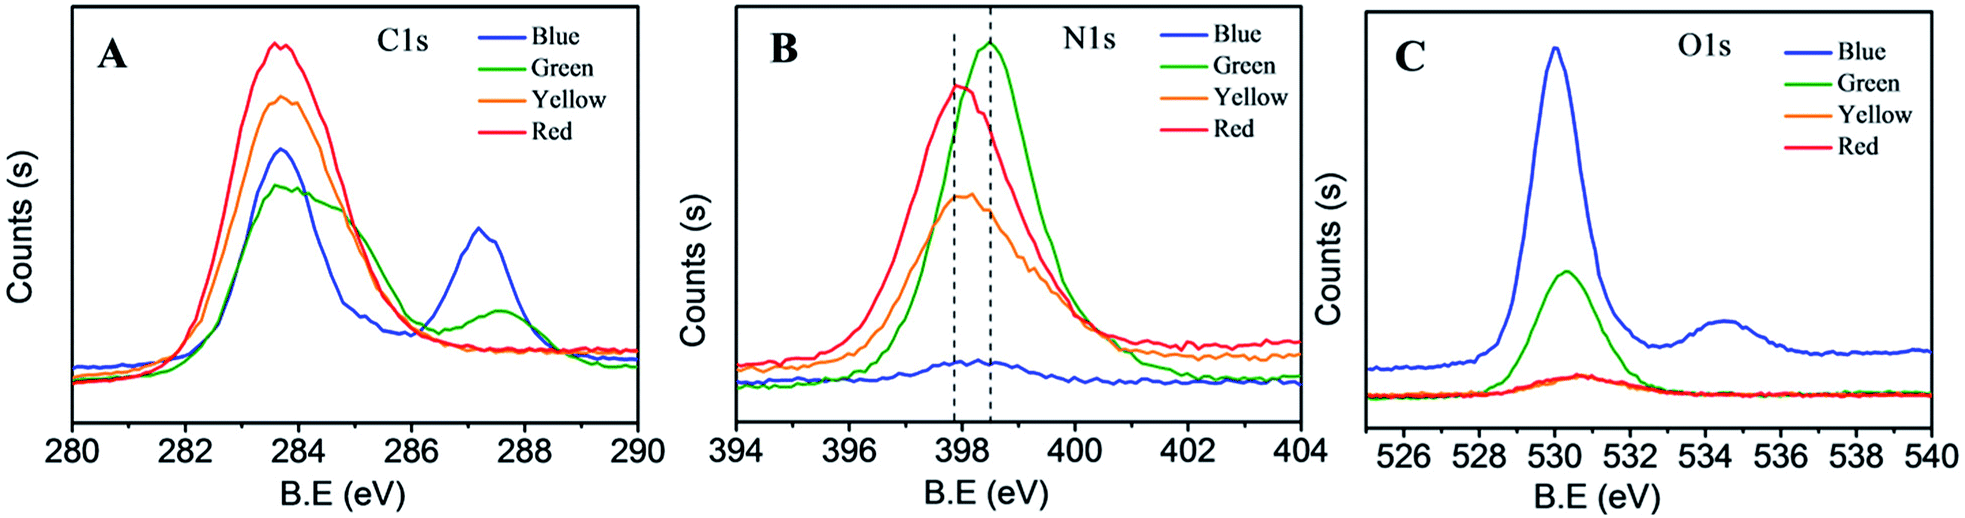 | ||
| Fig. 4 (A–C) High-resolution C1s, N1s and O1s XPS spectra for four color C-dots. | ||
Those C-dots have high stability and a simple synthetic route for production and have found broad applications in various fields including sensor development. These materials could be used for the unique selectivity of iron ions according to their luminescence response. Here we use the green C-dots were selective for quenching ions of Cu2+, Fe3+, and Hg2+ (no EDTA, F0/F1, Fig. 5A). However, the ability of the C-dots to quench the ions is difficult to recognize when the ions coexist in the solution. When the solution contained ethylenediaminetetraacetic acid (EDTA, F2/F3, Fig. 5B) the C-dots were found to be dramatically quenched only after the addition of Fe3+. The other ions mentioned above did not have the same response to the quenching process. The phenomenon can be ascribed to the interactions between the surface groups of C-dots and the metal ions having fewer interactions between EDTA and the metal ions (Cu2+, Hg2+ and Ce3+). Further investigation was carried out (F4 based on F3, Fig. 5C) and results indicated that other ions had negligible influence on the fluorescence. Thus, these results showed that the C-dots have high accuracy and unique-selectivity to the iron ion in the EDTA solution. The possible reason that quenching of fluorescence by Fe3+ ions was that due to the oxygenous groups on the surface which form an unique structure at the molecular level. Similar to chelation interaction, this unique structure and Fe3+ ions can serve as receptors and ligand, respectively. The steric hindrance impact of unique structure lead to the high selectivity for Fe3+ ions versus other ions, which also impact the fluorescence of C-dots. The coordinated Fe–CDs complex was favorable for the charge transfer, and also inhibited the excitons recombination, thus leading to the corresponding PL quenching.27,28 The fluorescence intensity of the C-dots solution decreased as the concentration of Fe3+ increased. The resulting calibration curve for Fe3+ displayed good linearity for concentrations ranging from 1 to 50 μM with a correlation coefficient of 0.9968 (Fig. 5D).
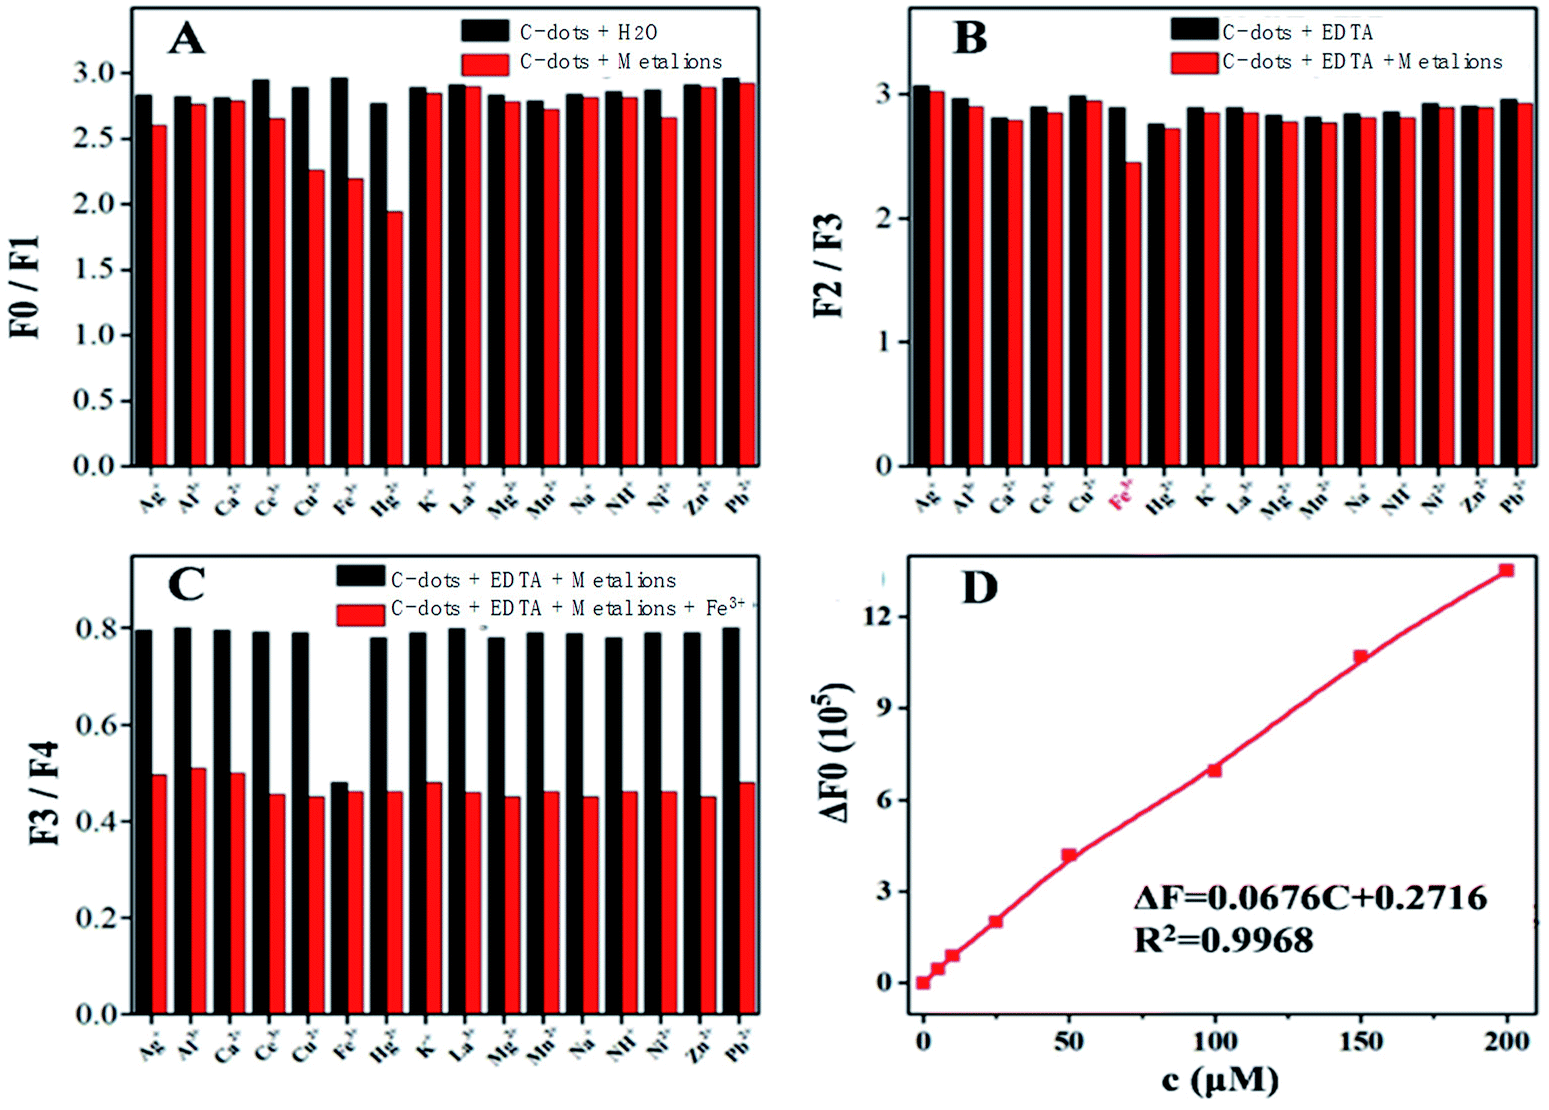 | ||
| Fig. 5 The change of fluorescence intensity at 530 nm for C-dots in the presence of deionized water F0 and various metal ions F1 (A), EDTA solution F2 and F2 addition of various metal ions denoted as F3 (B), F3 and F3 addition of the iron ion denoted as F4 (C), the change of fluorescence intensity of C-dots solution versus the concentration of Fe3+ (D). The change of fluorescence intensity of C-dots solution versus the concentration of Fe3+. | ||
Hydrothermal carbonization
Food waste with a mass of 250 g and water with a mass of 450 g were added into a 1 L autoclave. A fixed temperature was used (195 °C, 225 °C and 255 °C) for 12 h, and the hydrothermal products were separated using vacuum filtration. The solid phase products were placed into an oven at 105 °C for 24 h. The hydrochar was sealed and used as the precursor for the following multicolor C-dots production. The properties of the food waste are shown in Table 1.| Condition | C (%) | H (%) | N (%) | O* (%) | Ash (%) |
|---|---|---|---|---|---|
| Hydrochar-195 °C, 12 h | 69.76 | 7.03 | 3.64 | 17.73 | 1.34 |
| Hydrochar-225 °C, 12 h | 72.88 | 7.06 | 3.85 | 14.41 | 1.30 |
| Hydrochar-255 °C, 12 h | 74.75 | 7.22 | 3.87 | 12.36 | 1.30 |
| Proximate analysis (wt%, dry basis) | Ultimate analysis (wt%, dry basis) | Component analysis (wt%, dry basis) | |||
|---|---|---|---|---|---|
| Water content | 70.17 | C | 45.9 | Cellulose | 3.54 |
| Volatile solid | 95.27 | H | 7.2 | Hemicellulose | 17.21 |
| Ash | 4.73 | N | 2.1 | Lignin | 0.29 |
| S | 0.15 | Protein, g kg−1 | 131 | ||
| O* | 42.8 | Lipid, g kg−1 | 139 | ||
Synthesis of multicolor C-dots
Multicolor C-dots were synthesized using a top-down method. At room temperature, 2 g hydrochar with 20 ml concentrated nitric acid and 60 ml concentrated sulfuric acid were added into a 100 ml flask in sequence. The flask was inserted into a 700W ultrasonic cleaning system for 2 h and the dispersed liquid products were collected. The liquid products were refluxed in an oil bath at 100 °C for 10 h and then cooled to room temperature. The product was neutralized by adding NaOH and distilled water. The products were later dialyzed for 72 h using three distinct sizes of dialysis tube orifice sizes including 500 Da, 1000 Da and 2000 Da to produce blue, green, yellow and red C-dots.Analytical methods
The content of cellulose, hemicellulose, and lignin were determined with an ANKOM A200 Filter Bag Technique (FBT). The elemental content of hydrochar were analyzed by a Vario EL III elemental analyzer. The oxygen content was found by subtracting the sum of the other elements and ash content from 100%. The characterized morphology of multicolor C-dots was found using Transmission Electron Microscopy (TEM) with equipment from the Japan Electron Optics Laboratory Ltd. (Model JEM-2100F). Atomic Force Microscope (AFM) (Bruker Scan-Dimension-Icon system) was adopted to further characterize the size and morphology of the samples. The optical performance of the multicolor C-dots was based on the photoluminescence spectrum, optical absorption spectrum, and life curve. These were investigated using a multipurpose fluorescence spectrophotometer (FS5) from Techcomp (China) Ltd. The sample from the original C-dots solution was diluted at a ratio of 10![[thin space (1/6-em)]](https://www.rsc.org/images/entities/char_2009.gif) :1 and inserted in a quartz fluorescence cuvette. The emission characteristics were investigated at diverse excitation irradiation. The samples were investigated with using Fourier transform infrared (FTIR) spectroscopy. A Bruker Vertex 70v was used to analyze the different functional groups in the multicolor C-dots.
:1 and inserted in a quartz fluorescence cuvette. The emission characteristics were investigated at diverse excitation irradiation. The samples were investigated with using Fourier transform infrared (FTIR) spectroscopy. A Bruker Vertex 70v was used to analyze the different functional groups in the multicolor C-dots.
Conclusions
In conclusion, we have developed a facile and low-cost approach to prepare multicolor C-dots—blue, green, yellow and red with varying nanometer diameters using food waste as a precursor. The most vital step of preparation involved the treatment using HTC technology, an eco-friendly method to dispose of the food waste. The products of C-dots were used as fluorescence probes to detect heavy metal ions. The samples could be used for the unique selectivity of the Fe3+ ion according to the luminescence response ranging from 1 to 50 μM with a correlation coefficient of 0.9968. The multicolor C-dots with a characteristic optical performance are excellent candidates for environmental, sensor, and biological applications. This discovery could lead to improving the value of food waste while encouraging new developments in economically friendly, carbon materials.Conflicts of interest
There are no conflicts to declare.Acknowledgements
We thank Beijing Nova Program Interdisciplinary Studies Cooperative project (No. Z181100006218138), Science Foundation of China University of Petroleum-Beijing (No. 2462018BJC004), State Key Laboratory of Petroleum & Petrochemical Pollution Control and Treatment (No. PPC2017015) for the support. This material is supported by the National Institute of Food and Agriculture, U.S. Department of Agriculture, and McIntire Stennis under accession number 1009735.Notes and references
- X. Jia, B. Xi, M. Li, T. Xia, Y. Hao, D. Liu and J. Hou, J. Cleaner Prod., 2017, 152, 364–368 CrossRef.
- M. Mourad, J. Cleaner Prod., 2016, 126, 461–477 CrossRef.
- Y. Gao, B. Yu, X. Wang, Q. Yuan, H. Yang, H. Chen and S. Zhang, Energy, 2015, 88, 139–148 CrossRef.
- Y. Gao, B. Yu, K. Wu, Q. Yuan, X. Wang and H. Chen, BioResources, 2016, 11, 4113–4133 Search PubMed.
- X. Chen, Q. Lin, R. He, X. Zhao and G. Li, Bioresour. Technol., 2017, 241, 236–243 CrossRef PubMed.
- N. Zhou, H. Chen, J. Xi, D. Yao, Z. Zhou, Y. Tian and X. Lu, Bioresour. Technol., 2017, 232, 204–210 CrossRef PubMed.
- E. Unur, S. Brutti, S. Panero and B. Scrosati, Microporous Mesoporous Mater., 2013, 174, 25–33 CrossRef.
- K. Wu, Y. Gao, G. Zhu, J. Zhu, Q. Yuan, Y. Chen, M. Cai and L. Feng, J. Anal. Appl. Pyrolysis, 2017, 127, 335–342 CrossRef.
- J. Jeong, J. Jung, M. Choi, J. W. Kim, S. J. Chung, S. Lim, H. Lee and B. H. Chung, Adv. Mater., 2012, 24, 1999–2003 CrossRef PubMed.
- Q. Xu, P. Pu, J. Zhao, C. Dong, C. Gao, Y. Chen, J. Chen, Y. Liu and H. Zhou, J. Mater. Chem. A, 2015, 3, 542–546 RSC.
- Q. Xu, Y. Liu, C. Gao, J. Wei, H. Zhou, Y. Chen, C. Dong, T. S. Sreeprasad, N. Li and Z. Xia, J. Mater. Chem. C, 2015, 3, 9885–9893 RSC.
- S. Y. Park, H. U. Lee, E. S. Park, S. C. Lee, J. W. Lee, S. W. Jeong, C. H. Kim, Y. C. Lee, Y. S. Huh and J. Lee, ACS Appl. Mater. Interfaces, 2014, 6, 3365–3370 CrossRef PubMed.
- Q. Xu, Y. Liu, R. Su, L. Cai, B. Li, Y. Zhang, L. Zhang, Y. Wang, Y. Wang, N. Li, X. Gong, Z. Gu, Y. Chen, Y. Tan, C. Dong and T. S. Sreeprasad, Nanoscale, 2016, 8, 17919–17927 RSC.
- P. K. Sarswat and M. L. Free, Phys. Chem. Chem. Phys., 2015, 17, 27642–27652 RSC.
- L. Li, G. Wu, G. Yang, J. Peng, J. Zhao and J.-J. Zhu, Nanoscale, 2013, 5, 4015 RSC.
- Q. Xu, T. Kuang, Y. Liu, L. Cai, X. Peng, T. Sreenivasan Sreeprasad, P. Zhao, Z. Yu and N. Li, J. Mater. Chem. B, 2016, 4, 7204–7219 RSC.
- V. Gude, A. Das, T. Chatterjee and P. K. Mandal, Phys. Chem. Chem. Phys., 2016, 18, 28274–28280 RSC.
- S. Hu, Chem. Rec., 2016, 16, 219–230 CrossRef PubMed.
- B. Li, Y. Guo, A. Iqbal, Y. Dong, W. Li, W. Liu, W. Qin and Y. Wang, RSC Adv., 2016, 6, 107263–107269 RSC.
- M. Shamsipur, A. Barati and S. Karami, Carbon, 2017, 124, 429–472 CrossRef.
- S. Y. Lim, W. Shen and Z. Gao, Chem. Soc. Rev., 2015, 44, 362–381 RSC.
- Y. Liu, C. Liu and Z. Zhang, Appl. Surf. Sci., 2012, 263, 481–485 CrossRef.
- Q. Xu, L. Ding, Y. Wen, W. Yang, H. Zhou, N. Li, X. Chen, J. Street, Y. Chen, A. Zhou and W. Ong, J. Mater. Chem. C, 2018, 6, 6360–6369 RSC.
- Q. Xu., R. Su, Y. Chen, S. Sreenivasan, N. Li, X. Zheng, J. Zhu, H. Pan, W. Li, C. Xu., Z. Xia and L. Dai, ACS Appl. Nano Mater., 2018, 1, 1886–1893 CrossRef.
- H. Nie, M. Li, Q. Li, S. Liang, Y. Tan, L. Sheng, W. Shi and S. X.-A. Zhang, Chem. Mater., 2014, 26, 3104–3112 CrossRef.
- H. Ding, S.-B. Yu, J.-S. Wei and H.-M. Xiong, ACS Nano, 2016, 10, 484–491 CrossRef PubMed.
- L. Xu, W. Mao, J. Huang, S. Li, K. Huang, M. Li, J. Xia and Q. Chen, Sens. Actuators, B, 2016, 230, 54–60 CrossRef.
- H. Xu, S. Zhou, L. Xiao, H. Wang, S. Li and Q. Yuan, J. Mater. Chem. C, 2015, 3, 291–297 RSC.
| This journal is © The Royal Society of Chemistry 2018 |