
 Open Access Article
 This Open Access Article is licensed under a Creative Commons Attribution-Non Commercial 3.0 Unported Licence
Hydroprocessing of low-temperature coal tar to produce jet fuel
Yong Gang ab,
Xu Zhanga,
Xiong Leiab,
Hongyao Guoa,
Wenhong Li*ab and
Dong Liab
ab,
Xu Zhanga,
Xiong Leiab,
Hongyao Guoa,
Wenhong Li*ab and
Dong Liab
aSchool of Chemical Engineering, Northwest University, Xi'an, Shaanxi 710069, P. R. China. E-mail: coal723@163.com; Tel: +86 13279201497
bShaanxi Research Center of Chemical Engineering Technology for Resource Utilization, Xi'an 710069, P. R. China
First published on 29th June 2018
Abstract
Jet fuel was prepared from low-temperature coal tar (LTCT) via two-stage fixed beds that were filled with two commercial catalysts. The effects of temperature (340–400 °C), pressure (6–12 MPa) and liquid hourly space velocity (LHSV) (0.4–1.0 h−1) on the hydrogenation performance and properties of the product were investigated, while the H2/oil ratio was maintained at a constant 1600![[thin space (1/6-em)]](https://www.rsc.org/images/entities/char_2009.gif) :1 in all cases. In this study, the freezing point and the heat value increased with increasing pressure and LHSV over the catalysts. However, the freezing point decreased and then increased, while the heat value increased and then decreased with the increase of temperature. The jet fuel (180–280 °C) fraction was separated from the product and analyzed. The density, the freezing point and the heat value of the jet fuel were 0.815 g mL−1, −56 °C and 42 MJ kg−1, respectively. The main components of jet fuel were cycloalkanes and isoalkanes. The results showed that the jet fuel obtained from the LTCT had a series of advantages such as lower freezing point and higher heat value.
:1 in all cases. In this study, the freezing point and the heat value increased with increasing pressure and LHSV over the catalysts. However, the freezing point decreased and then increased, while the heat value increased and then decreased with the increase of temperature. The jet fuel (180–280 °C) fraction was separated from the product and analyzed. The density, the freezing point and the heat value of the jet fuel were 0.815 g mL−1, −56 °C and 42 MJ kg−1, respectively. The main components of jet fuel were cycloalkanes and isoalkanes. The results showed that the jet fuel obtained from the LTCT had a series of advantages such as lower freezing point and higher heat value.
1. Introduction
In recent years, the decline of world oil resources and the rising trend of global oil prices have drawn more and more attention. Exploration of an alternative energy is urgently needed to ensure national defence safety and national interests.1 In this context, some alternative new energy sources such as bio-oil, shale oil and coal-derived liquid have been developed.2–5 However, there are still some problems with bio-oil, such as low heat value and fast aging, which restricts the development and application of industrialization.1 Coal tar is a by-product of coal processing and its output accounts for about 2.5–10% of coal. China has a large number of coal resources, which produce a large amount of coal tar each year. In 2015 alone, domestic coal tar production exceeded 10 million tons.4,6,7 However, coal tar is a complex mixture, which contains a large number of important industrial products.8 Since coal tar contains a lot of polycyclic aromatic hydrocarbons and hetero atoms, the extensive combustion will exert tremendous pressure on the environment, in addition, this has not achieved the rational utilization of coal tar. As an alternative to petroleum, coal tar is considered an ideal raw material for the preparation of clean fuels.9 On the one hand, it can solve the environmental problems, on the other hand, it can also improve the added value of coal resources by catalytic hydrogenation.At present, the technology for hydrotreating LTCT to produce clean liquid fuels has achieved an enormous breakthrough,1,9–13 which also provides some technical support for the preparation of higher value-added oil products. With the rapid development of the aviation industry, the demand for jet fuel is increasing. For example, the consumption of jet fuel reached an astonishing 20 million tons in 2013, and the annual growth rate remained at about 13% in China. At present, jet fuel is mostly derived from petroleum refining, but it accounts for only about 6.3% of the crude oil.14 In the future, with the development of supersonic aircraft, higher requirements for jet fuel properties are required.15,16 However, petroleum-based jet fuel does not possess these properties, such as high density and better endothermic performance. Therefore, it is of great strategic significance to prepare coal-based jet fuel.
Compared with petroleum, coal tar has a significant difference. Specific as follows: polycyclic aromatic hydrocarbons and the content of heavy component is relatively large;10,17 there are more metals and nitrogenous compounds than petroleum, which causes the deactivation of the catalyst.18 Therefore, it is a huge challenge for coal tar to produce clean fuel. Hydroprocessing is considered as one of the most effective means of treating heavy oils,11,12,17,19–22 such as hydrofining, hydroisomerization, hydrocracking and catalytic cracking, etc., to meet the requirements of clean fuel by removing heteroatoms and saturated unsaturated hydrocarbons.22 Generally, the operation temperature of hydrocracking and catalytic cracking process is generally higher than 300 °C, which causes a higher coking rate and a large amount of C1–C4 light hydrocarbon.23–27 However, the composition of jet fuel is mostly C8–C15,28–32 and the content of aromatics is relatively low. In general, the heat value decreased in order alkane > cycloalkane > aromatic. In addition, olefins and aromatics were translated into alkanes (isoalkanes) and cycloalkanes via hydropressing, which improved the low-temperature fluidity and the heat value and so on of the oil products. For instance, the condensation point of the hexadecane and the naphthalene was 18.2 °C and 80.5 °C, while the condensation point of the 3-methylpentadecane and the c-decalin was −23 °C and −43 °C, respectively. Therefore, hydroisomerization is suitable process for preparation of jet fuel in this paper.
In this study, the LTCT is used as raw material to produce the jet fuel via two-stages catalytic hydroprocessing in the fixed-bed reactor filled with Ni–W/γ-Al2O3 catalyst and Ni–W/SAPO-11 catalyst. The effects of reaction conditions on the compositions and properties of the product were investigated. Meanwhile, the success of this experiment is to provide some datas for pilot scale experiment.
2. Experiment
2.1 Feedstock
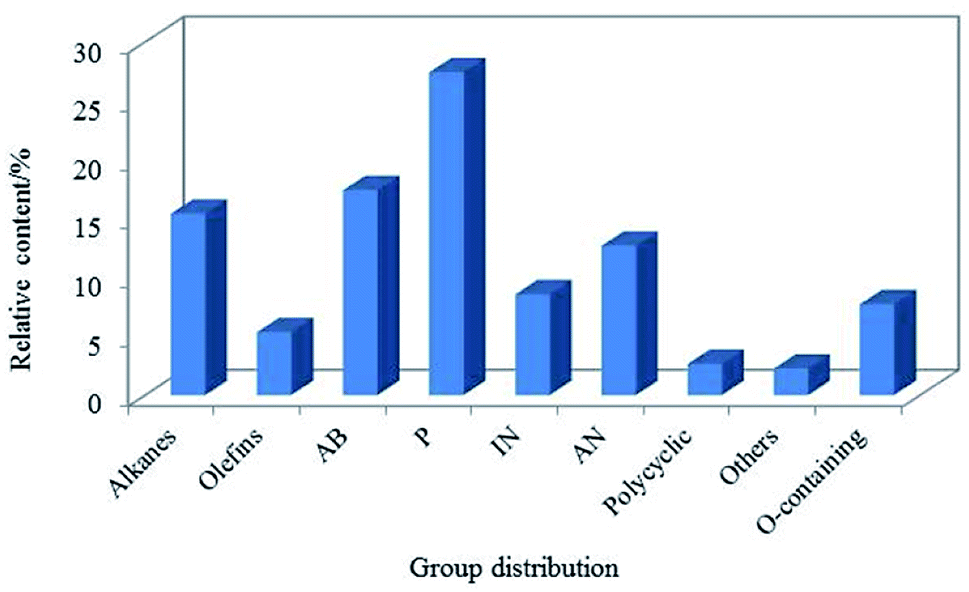
The LTCT was obtained from North of Shaanxi Province, China. As coal tar contains a lot of asphaltenes, in this experiment, the coal tar fraction of less than 360 °C was adopted as the feedstock for hydroprocessing like many researchers.12,21,33,34 The main chemical properties of the sample are listed in Table 1. As shown in Table 1, the heteroatoms, especially the oxygen atom, accounting for 6.74 wt%, which was similar to Cui.1 Meanwhile, it was also found that the initial boiling point and the final boiling point of the oil were relatively high, indicating that the heavy oil still occupied a large proportion. The composition distribution of the LTCT was detected by gas chromatography/mass spectrometry (GC/MS), the datas were presented in Fig. 1. Assuming the response factor of each component was same, and the relative content of each component was proportional to the corresponding area. The content of phenols (P) in raw materials was high, accounting for 27.44%, indicating that most of the oxygen atoms in the raw materials exist as phenolic hydroxyl groups in view of the fact that the content of oxygen atom was relatively high. The content of alkylbenzenes (AB) was also relatively high, accounting for 17.43%. In addition, the content of indenes (IN) and alkylnaphthalenes (AN) was also higher, and they could be converted into naphthenic hydrocarbon components in jet fuel.35–37 What's more, the content of paraffin was also relatively high, which was similar to JP-8,16 and they could be used as basis for the conversion of isomerization reactions into high-quality jet fuel with a lower freezing point. In summary, it is suitable for feedstock to produce jet fuel.| Properties | Unit | Value |
|---|---|---|
| a By difference.b Initial boiling point.c Final boiling point. | ||
| Density (20 °C) | g cm−3 | 0.9982 |
| Viscosity (50 °C) | mm2 s−1 | 13.71 |
|
||
| Distillation range | ||
| IBPb | °C | 174 |
| 30%/50% | °C | 245/295 |
| 70%/90% | °C | 331/370 |
| FBPc | °C | 401 |
|
||
| Elemental analysis | ||
| C | wt% | 83.92 |
| H | wt% | 8.73 |
| N | wt% | 0.43 |
| S | wt% | 0.15 |
| Oa | wt% | 6.74 |
 | ||
| Fig. 1 Distribution of group components in feedstock. | ||
2.2 Catalysts
Two commercial catalysts were used in this experiment with namely NiW/γ-Al2O3 and NiW/SAPO-11, respectively. The contents of metal elements were determined by X-ray fluorescence (XRF), and the specific surface area and pore volumes were measured by nitrogen adsorption performed on a MicromeriticsASAP 2010 M instrument. As a result of the signing of the agreement with the catalyst company brands, the remaining information and the model number of the catalysts could not be published for the time being. Main physicochemical properties of the catalysts were given in Table 2.| Properties | Ni–W/γ-Al2O3 | Ni–W/SAPO-11 | |
|---|---|---|---|
| Composition/wt% | Ni | 2.44 | 3.15 |
| W | 21.92 | 17.41 | |
| SBET, m2 g−1 | 253 | 205 | |
| Pore volume, mL g−1 | 0.53 | 0.2 | |
| Pore diameter, nm | 4.74 | 3.92 | |
| Acidity/mmol g−1 | 2.18 | 0.15 | |
2.3 Reaction system
The experiment was carried out via two-stage fixed beds reactors. As illustrated in Fig. 2, the device was mainly made up of three parts, the feeding part, the reaction part and the separation part. In the feedstock feeding unit, there were mainly the high pressure hydrogen that came from the compressor and the feedstock supply that was obtained via the metering pump from feedstock tank that was sealed by low pressure nitrogen. The separation unit mainly contained separator, cooler, and so on.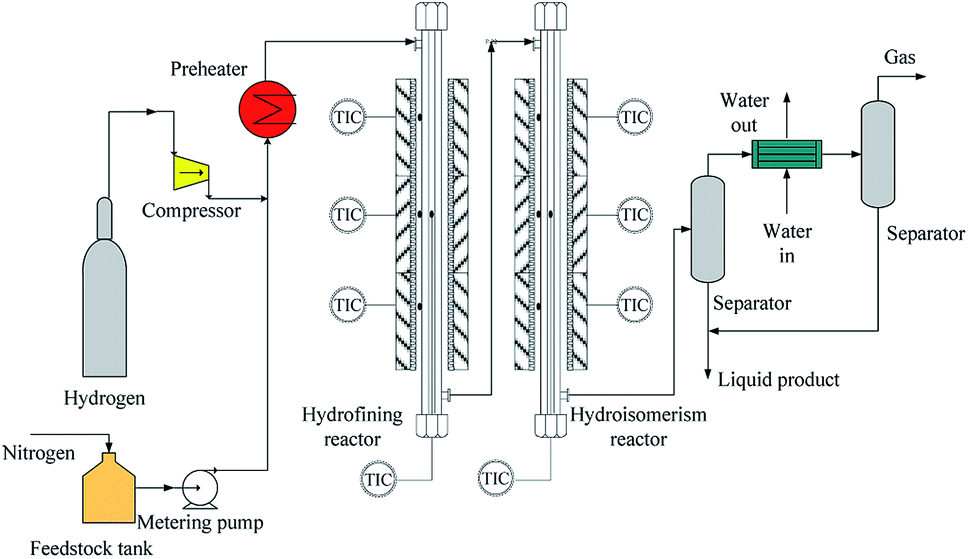 | ||
| Fig. 2 The schematic diagram of coal tar hydrogenation reactor. | ||
The refined reactor and the isomeric reactor were mainly part in the reaction unit. For the refined reactor, there was a reactor tube that was made of 316 stainless steel with 17 mm in internal diameter and 1120 mm in length. The two catalysts were sectioned into little pieces and sieved through 2.15–1.85 mm. The refined reactor was filled the 30 mL porcelain balls with 4–5 mm in diameter to guarantee homogeneous distribution between liquid and gas, then the 30 mL refining catalyst (NiW/γ-Al2O3) and finally the 30 mL porcelain balls. According to the above method, isomeric catalyst (NiW/SAPO-11) and porcelain balls were filled in the second reactor (the isomeric reactor). The reaction temperature in both reactors was monitored via the thermocouples with 6 mm in the external diameter which were placed into metal tube with 0.25 inch in the internal diameter. High pressure hydrogen and liquid reactants were mixed at the top of the reactor and then entered the reactor after they were preheated to 150 °C. Finally, the liquid products were collected after the separator, while the gas was emptied after the wet type gas flowmeter.
Both reactors were heated though electric heating furnace. Each reactor had three stages of electric heating, the preheating section, the constant temperature section and thermal insulation section, respectively. In each stage, there was an independent temperature control to monitor the bed temperature by a K thermocouple. The length and the power of the electric heating furnace were 200 mm and 1.5 kW in the preheating section and the constant temperature section, while the length and the power of the electric heating furnace were 150 mm and 1.0 kW in the thermal insulation section.
2.4 Hydrogenation procedure and product analysis
Before the reaction, the catalysts were sulphided with 2 wt% CS2. The presulfiding process was carried out at a fixed temperature (360 °C), pressure (10 MPa) and LHSV (1.0 h−1) for 6 h, and the flow rate of feedstock through metering pump was 0.5 mL min−1. After the presulfiding the experimental parameters were set as follows: temperature of 340–400 °C, pressure of 4–10 MPa, LHSV of 0.4–1.0 h−1 and H2/oil ratio of 1600:1. In addition, when the experimental parameters were changed, the device was stable for 7 hours to ensure the catalyst activity. During each run, the samples were collected in the first three hours, while the remaining products were collected in the next four hours.
In this paper, the isomerism of alkane was mainly discussed, and the conversion, isomer yield and selectivity of alkanes were defined as:


The feedstock and the product (180–280 °C)38 were analyzed as follows: (1) the density (DM 40, Mettler-Toledo International Inc.); (2) the distillation range (standard: ASTM D86); (3) the freezing point (Beijing times new dimension measurement and Control Equipment Co Ltd, standard: GB/T 2430-2008); (4) the heat value (standard: GB/T 384-81); (5) the flash point (standard: GB/T 261); (6) the acid number (standard: GB/T 12574); (7) the contents of C, H and O in feedstock were analyzed on Elementar Vario MICRO cube (Germany); (8) the contents of S and N were analyzed on KY-3000SN (JiangSu KeYuan Electronic Instrument Co. Ltd.); (9) the composition of feedstock and products (liquid) was analyzed by GC-MS (Agilent 6890N with a 30 m × 0.25 mm × 0.25 μm, Rtx-5 MS capillary column, Restek).
3. Results and discussion
In general, besides the catalyst, reactor type and the properties of raw material, the most important factors of hydrogenation reaction are reaction temperature, reaction pressure and LHSV. According to the related research, for the hydrogenation reaction, the temperature should not be too high.39 In addition, the appropriate pressure and the lower LHSV40–43 are beneficial to the hydrogenation reaction. In this study, the temperature, pressure and LHSV varied in the range of 340–400 °C, 4–10 MPa and 0.4–1.0 h−1, respectively. The H2/oil ratio was kept at a fixed level of 1600:1 in all cases.
3.1 Effect of temperature on product
High temperature can increase the reaction rate and the conversion of the feedstock. However, higher temperature may depress the extent of hydroisomerization due to the hydroisomerization was an exothermic reaction.44 In addition, the high temperature might aggravate the occurrence of side effects such as cracking and coking. However, the temperature too low to form a great number of activation molecules in reactant.45 In this study, the experimental temperature was varied in the range of 340–400 °C, and other conditions including reaction pressure, LHSV and H2/oil ratio were kept constant, at values of 10 MPa, 0.8 h−1 and 1600:1, respectively.
As shown in Table 3, the influence of temperature on the product was researched at stepwise of 340–400 °C. The density decreased and then increased from 340 °C to 400 °C, and it reached the minimum value of 0.827 g mL−1 and then quickly rose to 0.836 g mL−1, this might be that the high temperature improved activity of the catalyst. However, due to the fact that there was the competitive adsorption phenomenon of the positive carbon ions in the isomerization reaction and the cracking reaction,46 and the high temperature was favorable for the occurrence of the cracking reaction. The yield of jet fuel reached the maximum at value of 58% at 380 °C, which was also an important reason for the minimum density. Moreover, the yield of jet fuel slightly changed with the increase of temperature. This might be the fact that the carbon ions that formed on the surface of the SAPO-11 zeolite had the short life and weak electrophilic ability so that it had little effect on the C–C bond, in fewer small molecules.47 The freezing point decreased and then increased, while the heat value increased and then decreased with the increase of temperature. This might be attributed to the aggravation of cracking and dehydrogenation reaction with the increase of temperature, resulting in the reduction of the content of isomeric alkane and naphthenic hydrocarbon.48 Besides, due to the high isomeric selectivity of SAPO-11, a large number of alkanes were converted to isomers at 380 °C, resulting in lower the freezing point.49 As illustrated in Fig. 3, the isomer yield also increased and then decreases from 340 °C to 400 °C. Furthermore, we also found that the conversion and the isomer yield were almost the same at the initial stage with the increase of temperature, indicating that the conversion was consistent with the isomer yield before 380 °C. Moreover, although the conversion still increased along with the rising of reaction temperature from 340 to 400, the isomerization and the selectivity of isomerization increased and then decreased. The reaction was still an ongoing, the product had not mainly isomers, but the secondary reaction of the isomers, which was similar to Wojcieszak50 et al. Because of the low temperature, the reaction was controlled by kinetically, and the isomerization reaction activation energy was relatively lower. So that the main reaction at this time was the isomerization reaction instead of cracking reaction, suggesting that low temperature was not conducive to cracking reaction.51 The reaction was gradually controlled by the thermodynamics when the temperature continued to rise to the maximum. This was inseparable from the fact that the cracking reaction and the isomerization reaction were an endothermic and exothermic reaction, respectively. Therefore, the cracking reaction was enhanced and the isomerization reaction was inhibited at the higher temperature. In addition, isomerization products were split into small molecular compounds due to the secondary reaction. This fully demonstrated that there was a competitive reaction mechanism46 between the isomerization reaction and the cracking reaction itself, that was, during the isomerization reaction, the raw materials could be hydrogenated to form isomers as well as be cleaved into small molecule compounds.
| Properties | Temperature/°C | |||
|---|---|---|---|---|
| 340 | 360 | 380 | 400 | |
| a Experimental conditions: P = 10 MPa, LHSV = 0.8h−1and H2/oil = 1600:1. |
||||
| Density (20 °C)/(g mL−1) | 0.831 | 0.827 | 0.827 | 0.836 |
| Nitrogen/ppm | 100.93 | 92.31 | 84.49 | 78.96 |
| Sulfur/ppm | 50.31 | 46.25 | 40.84 | 34.29 |
|
||||
| Jet fuel | ||||
| Yield, v% | 55.8 | 56.6 | 58 | 56.5 |
| Freezing point/°C | −44.1 | −46.5 | −51 | −47.3 |
| Heat value/MJ kg−1 | 39.6 | 40.4 | 42 | 41.1 |
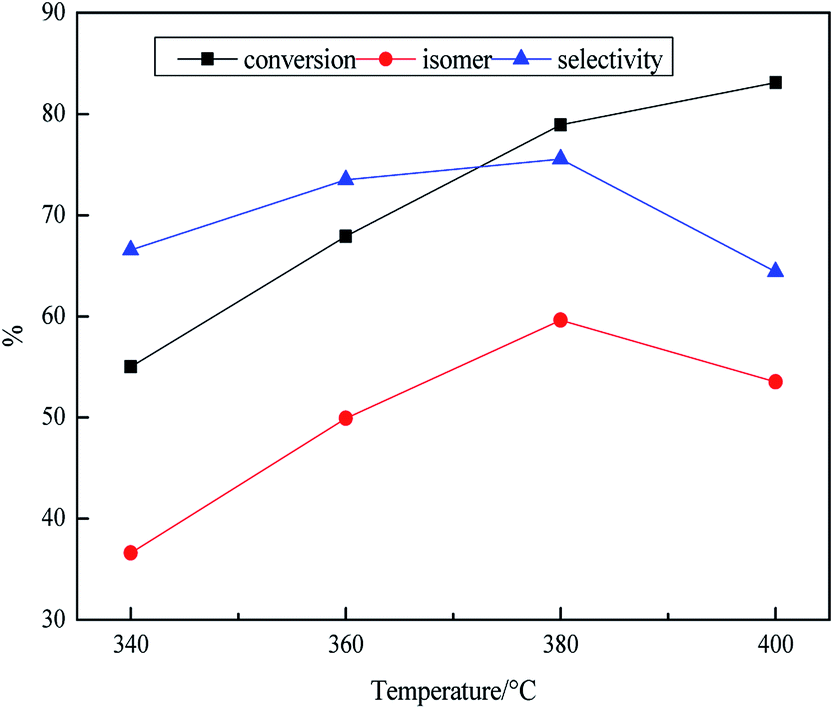 | ||
| Fig. 3 Effect of reaction temperature on transformation rule. Reaction condition: P = 10 MPa, LHSV = 0.8 h−1 and H2/oil = 1600:1. | ||
It could be seen that the content of nitrogen and sulfur showed downward trend with increasing the temperature from 340 to 400, because some compounds such as non-thiophene sulfur and non-reactive nitrogen were activated enough to react with hydrogen at high temperature, in addition, the active sites on the catalyst pore penetration rate would be increased owing to the high temperature. Large molecules were split into small molecules, which also improved the performance of the reaction at the high temperature.11 Furthermore, the high temperature environment also promoted the activation energy of the reaction, resulting in an increase in the number of molecules interacting with each other.52 Among them, the content of nitrogen was 100.93 μg g−1 at 340 °C, and then decreased to 78.96 μg g−1 at 400 °C. In contrast, the content of sulfur was 50.31 μg g−1 at 320 °C and 34.29 μg g−1 at 400 °C. By comparison, it was found that the sulfur was more reactive than nitrogen and the sulfur was relatively easier to be removed from the coal tar, which was consistent with previous studies.9,11,53 The mechanism of the desulfurization and the denitrification was different. The hydrodenitrogenation reaction was generally divided into two steps: firstly, the saturation reaction of aromatic rings was carried out, and then the C–N fracture was carried out in the second steps, while the hydrodesulfurization reaction could directly carry out the C–S bond fracture reaction. Moreover, the aromatic rings of nitrogen compounds such as pyridine, quinoline and other substances in coal tar were relatively stable, which had a certain degree of hindrance to nitrogen removal.54,55
3.2 Effect of pressure on product
Pressure had a great influence on the hydrogenation reaction. On the one hand, high pressure had more stringent requirements on the reaction equipment. On the other hand, it also had adverse effects on the catalyst. The abnormal phenomenon such as cracking and carbon deposition could not be effectively controlled when the pressure was too low.56 In this study, the experimental pressure was varied in the range of 6–12 MPa while other conditions including reaction temperature, LHSV and H2/oil ratio were kept constant, at values of 380 °C, 0.8 h−1 and 1600:1, respectively.
As shown in Table 4, the influence of pressure on the product was researched at stepwise of 6–12 MPa. The density and the yield of jet fuel showed downward trend from 6 MPa to 12 MPa. However, the decline was not obvious from 10 MPa to 12 MPa with from 0.827 g mL−1 to 0.824 g mL−1. In general, the density of hydrocarbons decreased with the increase of the number of branches at the same number of carbon atoms, while the decline was less obvious under the high pressure system, it might be that the isomerization reaction was inhibited under high pressure. The heat value was 37.2, 40.1, 42, 43.2 MJ kg−1, respectively in the range of 6–12 MPa. Because high pressure environment could promote the hydrogenation reaction and accelerate the formation of naphthenic hydrocarbons. There was a turning point in the change of freezing point change from 6 MPa to 12 MPa. This might be the fact that the isomerization reaction of the paraffin was inhibited. As shown in Fig. 4, it was observed that the isomer yield and the conversion decreased from 85.3% to 76.2% and 63.1% to 57.8% with the rising of pressure from 6 MPa to 12 MPa. The data showed that the high pressure system might inhibit the activity of the catalyst, resulting in lower isomer yield. Actually, there were still arguments about the effect of pressure on isomerization. In the study by Wang57 and Garin,58 high pressure was beneficial to isomerization. However, one the other hand, the selectivity of isomerization would decrease with the increase of pressure when the C7 (or above) paraffin was used as raw materials on the one-dimensional pore structure zeolite catalysts because the high pressure also resulted in the blockage of the channel, and the hydrogenolysis and hydrocracking of alkane reactivity would be relatively increased in the metal centre, resulting in lower selectivity of isomerization.59 The reaction mechanism of hydroisomerization was a dual function catalytic mechanism, and one of the most important steps was dehydrogenation on the metal site.60 Therefore, high pressure could inhibit the dehydrogenation reaction on the metal site, so that it could not be normal or only form a few carbenium ions, resulting in lower isomer yield.
| Properties | Pressure/MPa | |||
|---|---|---|---|---|
| 6 | 8 | 10 | 12 | |
| a Experimental conditions: T = 380 °C, LHSV = 0.8 h−1 and H2/oil = 1600:1. |
||||
| Density (20 °C)/(g mL−1) | 0.834 | 0.831 | 0.827 | 0.824 |
| Nitrogen/ppm | 93.45 | 92.99 | 84.49 | 78.16 |
| Sulfur/ppm | 43.51 | 41.84 | 40.84 | 38.24 |
|
||||
| Jet fuel | ||||
| Yield, v% | 54.8 | 56.5 | 58 | 59.8 |
| Freezing point/°C | −54.2 | −52.4 | −51 | −50 |
| Heat value/MJ kg−1 | 37.3 | 40.1 | 42 | 43.2 |
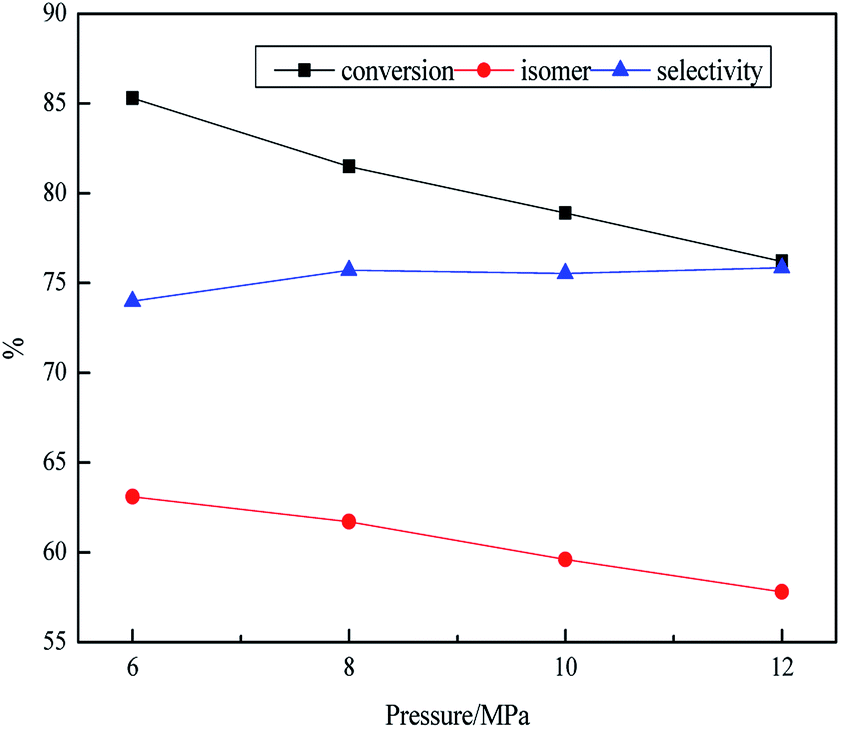 | ||
| Fig. 4 Effect of reaction pressure on transformation rule. Reaction condition: T = 380 °C, LHSV = 0.8 h−1 and H2/oil = 1600:1. | ||
The data also showed that the content of sulfur and nitrogen decreased with the increase of pressure. Ancheytajuárez61 believed that hydrogen and feedstock could fully react on the catalyst, enhancing the extent of heteroatoms removal under high pressure. At the same time, we found that the content of nitrogen decreased from 93.45 μg g−1 to 78.16 μg g−1, while the sulfur decreased from 43.51 μg g−1 to 38.24 μg g−1. It was also seen that the high pressure was more favourable for HDN than HDS. In the kinetic study by Vishwakarma62 et al., the rate of HDN reaction higher than HDS, which could be attributed to the inhibition of HDN by pore diffusion while the HDS was the opposite. On the other hand, in the study by Áshildur,63 the inhibition of nitrogenous compounds was not only due to blocking, but also nitrogenous compounds reducing the number of hydrogen atoms available for the hydrogenation reaction. In the kinetic study, the high pressure and high temperature environment were more favourable to the thermodynamics of the HDN reaction.
3.3 Effect of LHSV on product
LHSV was an indicator that could reflect residence time of feedstock, and it could express the hydrogenation depth, having a great influence on the properties of the product. It, however, was a double-edged sword. For one thing, although small LHSV could ensure sufficient contact time between the raw material and the catalyst, it had no practical significance for industrialization. For another thing, while the higher LHSV could guarantee the yield, the quality of the product could not be ignored. In this study, the experiment LHSV was varied in the range of 0.4–1.0 h−1, while other conditions including reaction temperature, pressure and H2/oil ratio were kept constant, at values of 380 °C, 10 MPa and 1600:1, respectively.
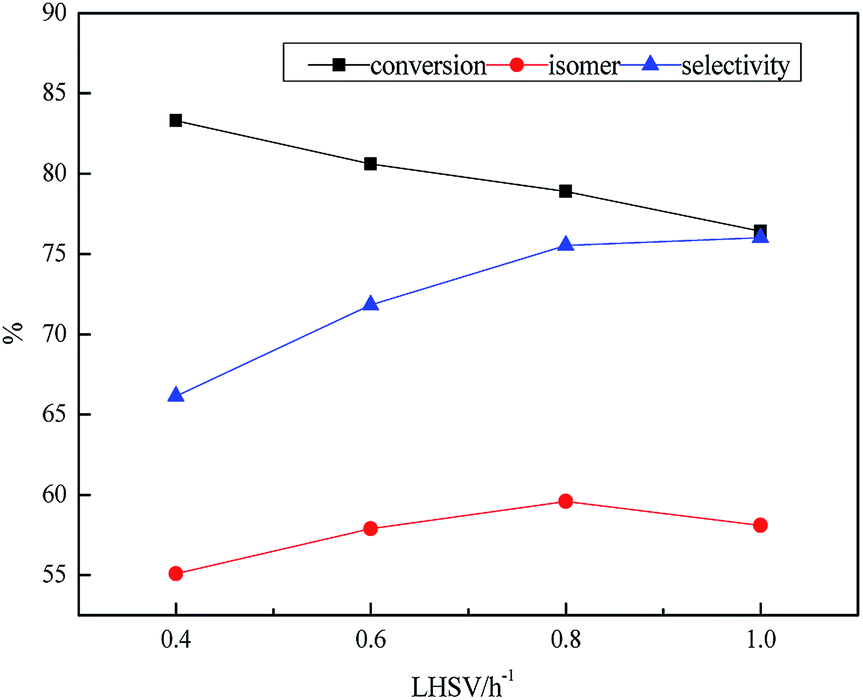
As illustrated in Table 5, the influence of LHSV on the product was discussed at 0.2 h−1 intervals from 0.4 h−1 to 1.0 h−1. The density increased from 0.814 g mL−1 to 0.834 g mL−1 with increasing the LHSV from 0.4 to 1.0 h−1. The retention time of feedstock on the catalyst was too short to be fully hydrogenated, resulting that heavy components could not achieve greater degree of hydrogenation under the higher LHSV. The freezing point increased from −53.1 °C to −49.6 °C, however, the heat value decreased from 43.9 MJ kg−1 to 40.1 MJ kg−1 in the range of 0.4–1.0 h−1. This was due to the insufficient retention time between raw material and catalyst, resulting in feedstock not fully hydrogenated. The concentrations of sulfur and nitrogen increased with the increase of LHSV from 0.4 h−1 to 1.0 h−1 owing to the less retention time was provided for HDS and HDN at higher LHSV. There was a similar phenomenon in the Fig. 5. Although the reaction time could be enough on the catalyst at small LHSV, secondary reactions would also increase, resulting in decline of the isomer yield. However, the higher LHSV ensured the industrial application, inhibiting the side reaction but it depressed the hydrogenation depth of reactant, resulting in the attenuation of the isomer yield of naphthenic hydrocarbons and isomeric hydrocarbons, which had a more adverse effect on the heat value, the freezing point and thermal stability.
| Properties | LHSV/h−1 | |||
|---|---|---|---|---|
| 0.4 | 0.6 | 0.8 | 1.0 | |
| a Experimental conditions: T = 380 °C, P = 10 MPa and H2/oil = 1600:1. |
||||
| Density (20 °C)/(g mL−1) | 0.814 | 0.82 | 0.827 | 0.834 |
| Nitrogen/ppm | 76.57 | 79.19 | 84.49 | 87.34 |
| Sulfur/ppm | 36.61 | 38.76 | 40.84 | 42.18 |
|
||||
| Jet fuel | ||||
| Yield, v% | 60.8 | 59.6 | 58 | 56.8 |
| Freezing point/°C | −53.1 | −52.1 | −51 | −49.6 |
| Heat value/MJ kg−1 | 43.9 | 43.2 | 42 | 40.1 |
 | ||
| Fig. 5 Effect of LHSV on transformation rule. Reaction condition: T = 380 °C, P = 10 MPa and H2/oil = 1600:1. | ||
3.4 Chemical compositions and properties of jet fuel
The components and the properties in the intermedial (the product of the first reactor) and the final products (jet fuel) were investigated at fixed reaction temperature, pressure, LHSV and H2/oil ratio, at values of 380 °C, 10 MPa, 0.8 h−1 and 1600:1, respectively. The hydrocarbon distributions of jet fuel were identified by GC-MS analysis in Fig. 6 and the properties of jet fuel were shown in Table 6. Compared with raw materials, there were most abundant alkanes, cycloalkanes and tetralin in the intermedial product, however, indene, naphthalene almost disappeared, indicating most of the hydrocarbons had been saturated after hydrorefining process. But we cannot ignore the fact that there were in large n-alkanes and alkylbenzenes, which seriously affected the freezing point and the heat value of the oil, and so on. The final product had a large number of isoalkanes and cycloalkanes (especially bicyclic alkanes), accounting for 36.8% and 60%, respectively. Based on research, isoalkanes and cycloalkanes had positive effect on depressing the low-temperature fluidity and the density. For instance, the density of the naphthalene and the c-decalin was 1.162 g mL−1and 0.89 g mL−1, respectively. In general, the heat value increased in linear manner with H/C, resulting in that isoalkanes and cycloalkanes played an unique role in improving the heat value. At the same time, the components of tetralin, n-alkanes, alkylbenzenes and so on that affected the properties of jet fuel decreased or disappeared in varying degrees. In addition, as illustrated in Table 6, there was little difference in main physicochemical properties between the jet fuel that was obtained from the LTCT via hydrofining and hydroisomerization at two-stage fixed beds and JP-900, indicating that coal-based jet fuel possessed tremendous market potential.
 | ||
| Fig. 6 Distribution of group components in feedstock and product. Reaction condition: T = 380 °C, P = 10 MPa, LHSV = 0.8 h−1 and H2/oil = 1600:1. | ||
| Properties | Unit | Jet fuel | JP-900 |
|---|---|---|---|
| a Experimental conditions: T = 380 °C, P = 10 MPa, LHSV = 0.8 h−1 and H2/oil = 1600:1. |
|||
| Density/(20 °C) | g mL−1 | 0.815 | 0.87 |
| Freezing point | °C | −51 | −65 |
| Acid number | mg KOH per g | 0.011 | 0 |
| Heat value | MJ kg−1 | 42 | 42.8 |
| Flash point/(closed cup) | °C | 51 | 61 |
| Sulfur | ppm | 40.84 | 0 |
|
|||
| Distillation range | |||
| IBP/10% | °C | 172/194 | 180/192 |
| 50%/FBP | °C | 226/256.4 | 204/270 |
4. Conclusion
Jet fuel was prepared from the LTCT via two-stage fixed beds reactor that was filled with two commercial catalysts. The effects of temperature, pressure and LHSV on the hydrogenation performance and properties of product were investigated. Pressure and LHSV had a positive effect on the freezing point and heat value over the catalysts. However, temperature was a double effect on the freezing point, that was, the freezing point decreased and then increased, while the heat value increased and then decreased with the increase of temperature.The data of the final products showed that the density, the freezing point and the heat value were 0.815 g mL−1, –51 °C and 42 MJ kg−1, and the content of sulfur was lower. And the components in the final products were mostly isoalkanes and cycloalkanes (especially bicyclic alkane), accounting for 36.8% and 60% by GC-MS analysis. The results showed that the LTCT could be upgraded by catalytic hydrogenation to improve the added value.
Conflicts of interest
There are no conflicts to declare.Acknowledgements
The authors are grateful to the financial support of the Overall Science and Technology Innovation Project of Shaanxi Province (2014KTCL01-09), National Natural Science Foundation of China (21206136) and Scientific Research Project of the Department of Education of Shaanxi Province (14JF026 and 15JF031).References
- W. G. Cui, W. H. Li, R. Gao, H. X. Ma, D. Li and M. L. Niu, Energy Fuels, 2017, 31, 3768–3783 CrossRef.
- J. C. Serrano-Ruiz and J. A. Dumesic, Energy Environ. Sci., 2010, 4, 83–99 RSC.
- A. Marafi, S. Fukase, M. AlMarri and A. Stanislaus, Energy Fuels, 2003, 17, 661–668 CrossRef.
- C. Li and K. Suzuki, Resour., Conserv. Recycl., 2010, 54, 905–915 CrossRef.
- E. Regnier, Energy Econ., 2007, 29, 405–427 CrossRef.
- J. Xu, Y. Yang and Y. W. Li, Fuel, 2015, 152, 122–130 CrossRef.
- K. C. Xie, W. Y. Li and W. Zhao, Energy, 2010, 35, 4349–4355 CrossRef.
- Y. T. Xu, C. M. Nie, Q. Yang, X. N. Tian and X. Chen, Appl. Chem. Ind., 2008, 37, 1496–1499 Search PubMed.
- R. Wang, D. H. Ci, X. Cui, Y. Bai, C. Y. Liu, D. T. Kong, S. Zhao, Y. H. Long and X. F. Guo, Fuel Process. Technol., 2017, 155, 153–159 CrossRef.
- W. G. Cui, H. A. Zheng, M. L. Niu, S. J. Zhang, D. Li, J. Qiao and W. H. Li, React. Kinet., Mech. Catal., 2016, 119, 491–509 CrossRef.
- D. Li, Z. Li, W. H. Li, Q. C. Liu, Z. L. Feng and Z. Fan, J. Anal. Appl. Pyrolysis, 2013, 100, 245–252 CrossRef.
- K. Tao, H. Y. Wang, H. X. He, C. S. Li and S. J. Zhang, Fuel, 2011, 90, 3404–3409 CrossRef.
- Z. Liu, S. Shi and Y. Li, Chem. Eng. Sci., 2010, 65, 12–17 CrossRef.
- P. Y. Bi, J. C. Wang, Y. J. Zhang, P. W. Jiang, X. P. Wu, J. X. Liu, H. Xue, T. J. Wang and Q. X. Li, Bioresour. Technol., 2015, 183, 10–17 CrossRef PubMed.
- H. Li, Y. Piao, W. J. Cao, C. F. Du, S. L. Wang and J. S. Gong, J. China Coal Soc., 2015, 41, 2347–2351 Search PubMed.
- S. Butnark, M. W. Badger, H. H. Schobert and G. R. Wilson, Fuel Chemistry Division Preprints, 2003, 48, 158–161 Search PubMed.
- L. H. Day, Chem. Eng. J., 2014, 236, 529–537 CrossRef.
- H. U. Nan, L. Wang and Y. Huang, Chem. Eng. J., 2013, 27, 56–60 Search PubMed.
- X. Li, Z. M. Zong, W. W. Ma, J. P. Cao, M. Mayyas, Z. H. Wei, Y. Li, H. L. Yan, D. Wang, R. Yang and X. Y. Wei, Fuel Process. Technol., 2015, 134, 39–45 CrossRef.
- R. J. Sun, S. G. Shen, D. F. Zhang, Y. P. Ren and J. M. Fan, Energy Fuels, 2015, 29, 7005–7013 CrossRef.
- T. Kan, X. Y. Sun, H. Y. Wang, C. S. Li and U. Muhammad, Energy Fuels, 2012, 26, 3604–3611 CrossRef.
- A. Marafi, A. Hauser and A. Stanislaus, Energy Fuels, 2006, 20, 1145–1149 CrossRef.
- L. J. Jin, X. Y. Bai, Y. Li, C. Dong, H. Q. Hu and X. Li, Fuel Process. Technol., 2016, 147, 41–46 CrossRef.
- W. Y. Wen and E. Cain, Ind. Eng. Chem. Process Des. Dev., 1984, 23, 627–637 CrossRef.
- D. Velegol, M. Gautam and A. Shamsi, Powder Technol., 1997, 93, 93–100 CrossRef.
- S. A. Qader and G. R. Hill, Ind. Eng. Chem. Process Des. Dev., 1969, 8, 450–455 CrossRef.
- J. P. Meng, Z. Y. Wang, Y. H. Ma and J. Y. Lu, Fuel Process. Technol., 2017, 165, 62–71 CrossRef.
- R. Xing, A. V. Subrahmanyam, H. Olcay, W. Qi, G. P. V. Walsum, H. Pendse and G. W. Huber, Green Chem., 2010, 12, 1933–1946 RSC.
- P. Dagaut and M. Cathonnet, Prog. Energy Combust. Sci., 2006, 32, 48–92 CrossRef.
- V. Vukadinovic, P. Habisreuther and N. Zarzalis, Fuel, 2013, 111, 401–410 CrossRef.
- E. Corporan, T. Edwards, L. Shafer, M. J. Dewitt, C. Klingshirn, S. Zabarnick, Z. West, R. Striebich, J. Graham and J. Klein, Energy Fuels, 2011, 25, 955–966 CrossRef.
- P. Lobo, D. E. Hagen and P. D. Whitefield, Environ. Sci. Technol., 2011, 45, 10744–10749 CrossRef PubMed.
- J. Kusy, L. Andel, M. Safarova, J. Vales and K. Ciahotny, Fuel, 2012, 101, 38–44 CrossRef.
- F. Dai, M. J. Gao, C. S. Li, S. G. Xiang and S. J. Zhang, Energy Fuels, 2011, 25, 4878–4885 CrossRef.
- Y. Xue, S. L. Wang and J. Liu, Acta Pet. Sin., 2010, 26, 264–267 Search PubMed.
- L. M. Balster, E. Corporan, M. J. Dewitt, J. T. Edwards, J. S. Ervin, J. L. Graham, S. Y. Lee, S. Pale, D. K. Phelps, L. R. Rudnick, R. J. Santoro, H. H. Schobert, L. M. Shafer, R. C. Striebich, Z. J. West, G. R. Wilson, R. Woodward and S. Zabarnick, Fuel Process. Technol., 2008, 89, 364–378 CrossRef.
- C. E. Burgess and H. H. Schobert, Fuel Process. Technol., 2000, 64, 57–72 CrossRef.
- S. X. Lin and C. M. Xu, Petroleum Industry Press, 2000, 123–130 Search PubMed.
- D. Leckel, Energy Fuels, 2006, 20, 1761–1766 CrossRef.
- M. Šafářová, J. Kusý and L. Anděl, J. Anal. Appl. Pyrolysis, 2010, 89, 265–270 CrossRef.
- M. Nuzzi and B. Marcandalli, Fuel Process. Technol., 2003, 80, 35–45 CrossRef.
- J. Surygala, R. Wandas and E. Sliwka, React. Kinet. Catal. Lett., 1994, 53, 217–221 CrossRef.
- Y. Z. Luan, Q. M. Zhang, D. M. He, J. Guan and C. H. Liang, Asia-Pac. J. Chem. Eng., 2010, 4, 704–710 CrossRef.
- J. M. Wu, Q. W. Sun, Z. S. Zhang and L. F. Pang, Chem. Eng. J., 2014, 42, 33–38 Search PubMed.
- A. T. Jarullah, I. M. Mujtaba and A. S. Wood, Energy Fuels, 2011, 25, 773–781 CrossRef.
- S. Z. Zhang, S. L. Chen, P. Dong, G. M. Yuan and K. Q. Xu, Appl. Catal., A, 2007, 332, 46–55 CrossRef.
- W. G. Huang, D. D. Li, X. H. Kang, Y. H. Shi, X. B. Meng, K. Wang, W. Z. Dong, H. Nie and C. Li, Chin. J. Catal., 2003, 154, 2353–2358 Search PubMed.
- S. Zeng, Sino-Global Energy, 2011, 16, 72–77 Search PubMed.
- P. Mériaudeau, V. A. Tuan, V. T. Nghiem, S. Y. Lai, L. N. Hung and C. Naccache, J. Catal., 1997, 169, 55–66 CrossRef.
- R. Wojcieszak, S. Monteverdi, M. Mercy, I. Nowak, M. Ziolek and M. M. Bettahar, Appl. Catal., A, 2004, 268, 241–253 CrossRef.
- W. Souverijns, J. A. Martens, G. F. Froment and P. A. Jacobs, J. Catal., 1998, 174, 177–184 CrossRef.
- A. T. Jarullah, I. M. Mujtaba and A. S. Wood, Energy Fuels, 2011, 25, 773–781 CrossRef.
- T. C. Ho, Catal. Rev., 1988, 30, 117–160 CrossRef.
- L. G. Xu, R. A. Keogh, C. S. Huang, R. L. Spicer, D. E. Sparks, S. Lambert, G. A. Thomas and B. H. Davis, Liq. Fuels Technol., 1994, 12, 1355–1376 Search PubMed.
- R. Rosal, F. V. Diez and H. Sastre, Ind. Eng. Chem. Res., 1992, 31, 1007–1012 CrossRef.
- M. Ke, Y. G. Chen, Z. Z. Song and Q. Z. Jian, Pet. Sci., 2005, 2, 27–31 Search PubMed.
- H. Wang, G. Q. Pan and Y. F. Liu, Pet. Process. Petrochem., 2001, 5, 25–28 Search PubMed.
- F. Garin, D. Andriamasinoro, A. Abdulsamad and J. Sommer, J. Catal., 1991, 131, 199–203 CrossRef.
- A. Holló, J. Hancsók and D. Kalló, Appl. Catal., A, 2002, 229, 93–102 CrossRef.
- K. C. Park and S. K. Ihm, Appl. Catal., A, 2000, 203, 201–209 CrossRef.
- J. Ancheytajuárez, G. Betancourtrivera, G. Marroquínsánchez, A. M. Perez-Arellano, S. K. Maity, T. Cortez and R. del Rio-Soto, Energy Fuels, 2000, 15, 120–127 CrossRef.
- S. K. Vishwakarma, A. V. Sundaramurthy, A. K. Dalai and J. Adjaye, Ind. Eng. Chem. Res., 2007, 46(14), 4778–4786 CrossRef.
- Á. Logadóttir, P. G. Moses, B. Hinnemann, N. Y. Topsøe, K. G. Knudsen, H. Topsøe and J. K. Nørskov, Catal. Today, 2006, 111, 44–51 CrossRef.
| This journal is © The Royal Society of Chemistry 2018 |