 Open Access Article
Degradation kinetics and mechanism of pentoxifylline by ultraviolet activated peroxydisulfate
B. Kamińska a,
K. Majewskaa,
A. Skwierawska*a and
K. Kozłowska-Tylingob
aDepartment of Chemistry and Technology of Functional Materials, Gdansk University of Technology, Narutowicza 11/12, 80-233 Gdansk, Poland. E-mail: anna.skwierawska@pg.edu.pl
bDepartment of Pharmaceutical Technology and Biochemistry, Gdansk University of Technology, Narutowicza 11/12, 80-233 Gdansk, Poland
First published on 29th June 2018
Abstract
Degradation of pentoxifylline (PTX) by sodium peroxydisulfate (SPDS) assisted by UV irradiation has been investigated in deionized water. The treatment was more favorable over direct photolysis or peroxydisulfate oxidation alone. The effects of various parameters, including different dosage of oxidant agent, PTX concentration, initial solution pH levels, and the presence of inorganic ions like chloride, nitrate and carbonate have been evaluated. The rate of PTX decomposition depends on the oxidant agent dose. The highest degradation was determined at pH 10.5, which can be explained by the generation of additional hydroxyl radicals (HO˙) in the reaction between sulfate radicals and hydroxide ions. The presence of inorganic ions, especially the carbonate ions quench valuable sulfate radicals and have successfully retarded the PTX decomposition. Six PTX oxidation products were identified using UPLC-QTOF-MS for trials in a basic environment. The main degradation product (3,7-dimethyl-6-(5-oxohexyloxy)-3,7-dihydro-2H-purin-2-one) was isolated by column chromatography and identified by 1HNMR and LC MS analyzes.
Introduction
The presence of pharmaceuticals and personal care products (PCPs) in the environment has recently gained much attention due to their possible negative impact on human health and the ecosystem. To date, several active compounds have been found in surface water, underground water and tap water in different regions of the world.1–3 There are many pathways allowing pharmaceuticals to enter the environment: hospitals, veterinary clinics, households, and pharmaceutical manufacturing facilities. Wastewater treatment plants can also successively supply active ingredients to the ecosystem, as most of them do not mineralize pharmaceuticals. For this reason, new technologies are being implemented, combining physicochemical and biological methods.Advanced oxidation processes (AOP) are very often used for this purpose. Among the various oxidizing agents used, SO4˙− ions characterized by high redox potential (E0 ≈ 2.6 V compared to a standard hydrogen electrode (SHE)) – deserve special attention.4–6 They are formed during the activation of the peroxydisulfate anion (S2O82−), according to eqn (1). The sulfate radicals are kinetically fast, non-selective and more stable than the hydroxyl radicals. Moreover, SO4˙− may also initiate production of other intermediate highly reactive oxygen species e.g. hydroxyl radicals (eqn (2)). These reactive oxygen species can initiate propagation and termination of chain reactions in which organics are partially and even fully decomposed.7 Peroxydisulfate anions (S2O82−) are formed during the dissociation of peroxydisulfate salts in aqueous solution. Because of the low solubility of potassium peroxydisulfate in water, sodium peroxydisulfate (SPDS) is the most common and suitable form used in degradation processes.
| S2O82− + activating agent → 2SO4˙− | (1) |
| SO4˙− + H2O → HO˙ + HSO4− | (2) |
There are several methods of activation of peroxydisulfate ions for example: temperature,8 UV,9 transition metals,10 or alkaline pH.11 In our study SPDS was activated by UV radiation.
In this paper, for degradation process pentoxifylline (1-(5-oxohexyl)-3,7-dimethylxanthine) (PTX) has been chosen (Fig. 1). It is a commonly known drug improving blood flow by decreasing blood viscosity and increasing red blood cell flexibility. Due to the PTX resistance to conventional water treatment, its presence in surface waters was detected.12 Therefore, methods providing the effectiveness of API removal are still searched. Several techniques such as non-thermal plasma,13 electrochemical oxidation,14 oxidation with chloride dioxide,15 ozone and O3/H2O2,16 H2O2, H2O2/UV, Fenton's and photo-Fenton processes where used to degrade PTX.17,18 However, the reaction of ultraviolet-activated peroxydisulfate has not been considered.
In this study, the effect of SPDS doses, pH and presence of inorganic salts were investigated. The obtained results confirmed that the model of UV-activated peroxydisulphate may be suitable for the specific purification of waters containing an active compound, such as PTX.
Materials and methods
Reagents
Pentoxifylline (PTX, ≥99%) was donated by local pharmaceutical company. Sodium peroxydisulfate (Na2S2O8, ≥98%), ammonium formate (HCOONH4, ≥99%) were purchased from Sigma Aldrich. Methanol (HPLC-grade) and acetonitrile (HPLC-grade) from Chempur (Poland). Hydrogen peroxide (H2O2, 30%), sodium hydroxide (NaOH, ≥99%), sulfuric acid (H2SO4, 95% to 98%), sodium chloride (NaCl, ≥99%), sodium nitrate (NaNO3, ≥99%), sodium carbonate (Na2CO3, ≥99%) were of analytical grade and obtained from P.P.H. Gliwice (Poland). All chemicals were used without further purification. Water used in all experiments was purified by Hydrolab-system (HLP SPRING, temp. 22 °C, κ = 2.70 μS). Preparative column and thin layer chromatography were performed on silica gel 60 and aluminum sheet covered with silica gel 60 F254 (Merck, Germany), respectively.Experimental setup and analytical methods
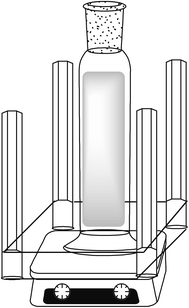
Irradiation experiments were carried out in a cylindrical quartz reactor (height 16 cm, diameter 5 cm) under magnetic stirring (Fig. 2). The UV light irradiation sources were four low-pressure mercury discharge lamps (Philips, TUV PL-L 35W 4P HO) with maximum emission at 253.7 nm. The light intensities (253.7 nm) were 63.7 W m−2. The distance between the reactor and the light source was 4 cm. The irradiance was measured by a UV radiometer (Radiometer RR-20 OPTEL, Poland). The pH was measured with a pH meter CP-505 ELMETRON. Total organic carbon (TOC) analysis was performed using a TOC analyzer (TOC-V CSH Shimadzu). Residual PTX was quantified through HPLC assay on Agilent 1200 Series LC chromatographic system equipped with a vacuum degasser (G1322A), autosampler (G1311A), thermostated column compartment (G1316A) and diode array detector (G1315B). Analyses were performed on Zorbax Eclipse XDB-C18 column, 250 mm × 4.6 mm, 5 μm particle size (Agilent, USA). The mobile phase consisted of 0.05 M HCOONH4 (S1) and acetonitrile (S2). Samples were analyzed using 50 minutes linear gradient, where the content of solvent (S2) was progressively increased from 10 to 50% – 50 minutes (1.0 mL min−1). The detector was set at 273 nm for PTX. The column temperature was set at 30 °C, the injection volume was 40 μL with a draw speed of 200 μL min−1. For identification purposes, standard addition was use by comparing the relative retention time and peak purity with UV-Vis spectral reference data.The UHPLC-QTOF-MS analysis were carried out using an Agilent 1290 UHPLC system coupled to a hybrid quadrupole time-of-flight (QTOF) mass spectrometer (Agilent 6540 Series Accurate Mass QTOFMS) with dual ESI interface operated in positive ion mode. The separation of analytes was performed on Lichrocart 250-4 Lichrospher 100 RP-18e column (250 mm × 4 mm; 5 μm) maintained at 40 °C. The mobile phase A was ultrapure water and B was acetonitrile and the flow rate was set to 1 mL min−1. The analysis were carried out in gradient elution (starting from 80% A to 20% A in 15 min, back to 80% A in 6 min and kept at 80% A for 9 min) and the injection volume was 5 μL. The QTOF-MS conditions were as follows: sheath gas temperature 400 °C at the flow rate of 12 L min−1, capillary voltage 3500 V, nebulizer pressure 35 psig, drying gas 10 L min−1, gas temperature 300 °C, skimmer voltage 45 V, octopole RF peak 750 V and fragment or voltage 100 V. Analysis were performed in two different modes, MS/MS or target MS/MS with various collision energies (10, 20 and 30 V) and the masses were scanned from 100 to 1000 m/z. The instrument was working in the 4 GHz high-resolution mode with the acquisition rate of 1.5 spectra per s. Acquisition data were processed using Agilent Mass Hunter Workstation software.
The 1H NMR spectra were recorded on Bruker instrument at 400 MHz. All sample solutions were prepared in deuterated chloroform. TMS was used as an internal standard.
Experimental procedure
For the degradation tests, to aqueous solution of different concentration of PTX (200 mL, 0.067, 0.1 or 0.2 mM) was fixed with appropriate amount of SPDS (0, 1, 2, 3 or 4 mM) in quartz reactor and stirred for 30 minutes. During this time, 2 mL of the sample was collected from each replicate flask at selected time intervals and then passed through a 0.22 mm polyvinylidene fluoride membrane filter for sampling analysis. After filtration, excess methanol, a well-known quenching agent for sulfate and hydroxyl radicals, was added and vigorously shaken. The pH of the PTX solution was adjusted to 3, 5.2 or 10.5 by sulfuric acid or sodium hydroxide, respectively.19 Inorganic salt (sodium chloride, sodium nitrate or sodium carbonate) were added in one portion to 200 mL of solution 0.2 mM PTX using appropriate equivalents of 1, 10 or 100 mM. Processes were carried out at room temperature (24 ± 3 °C). All experiments were performed in triplicate. Obtained results were nearly similar, and referred in this paper as the mean value.Column chromatography
To the mixture obtained after degradation of PTX (0.2 mM PTX, 2 mM SPDS, initial pH 10.5) was added 10 mL of methanol, the excess of which after radical decomposition was removed under reduced pressure. The residue was lyophilized to give a precipitate. A small amount of chloroform was added to the residue. The mixture was subjected to TLC analysis in ethyl acetate![[thin space (1/6-em)]](https://www.rsc.org/images/entities/char_2009.gif) :
:![[thin space (1/6-em)]](https://www.rsc.org/images/entities/char_2009.gif) methanol solvent system (85
methanol solvent system (85![[thin space (1/6-em)]](https://www.rsc.org/images/entities/char_2009.gif) :
:![[thin space (1/6-em)]](https://www.rsc.org/images/entities/char_2009.gif) 15). The resulting suspension was then applied to a glass chromatographic column (length 200 mm, diameter 15 mm) filled with a mixture of silica gel and chloroform. The components were separated using a methanol gradient in chloroform. Fractions containing the main product were combined. The solvent was removed under reduced pressure.
15). The resulting suspension was then applied to a glass chromatographic column (length 200 mm, diameter 15 mm) filled with a mixture of silica gel and chloroform. The components were separated using a methanol gradient in chloroform. Fractions containing the main product were combined. The solvent was removed under reduced pressure.
The obtained oily residue was analyzed by 1H NMR and LC MS.
Results and discussion
Comparison of pentoxifylline degradation under various processes
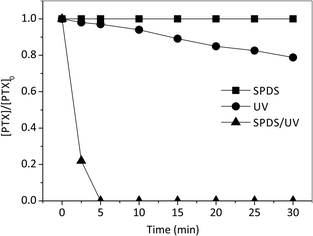
Primary experiments were carried out to determine the suitability of pentoxifylline for SPDS and radiation alone, as well as in combined SPDS/UV system (Fig. 3). The control experiments revealed that PTX was not efficiently oxidized by sodium peroxydisulfate alone ([SPDS]0/[PTX]0 = 20), even after 60 minutes of the reaction. PTX was not good subject to direct photolysis by the low pressure UV source with the quantum yield (Φ) 6.81 × 10⁻⁴ [mol per einstein], molar absorption coefficient 3720 dm3 mol−1 cm−1. Low value of Φ may indicate a significant participation of photophysical processes, numerous reactions and deactivation of excited molecules as a result of their mutual collisions before they leave the interaction zone (caged effect). Low effectiveness of PTX decomposition may be also related to the lack of ideal coverage of the pentoxifylline absorption band (273 nm) and the emission of applied lamps (253.7 nm). Nevertheless, the lamps used in our experiments (with maximum emission 253.7 nm) are popular and widely used in laboratory and industrial scale. The direct photolysis of PTX solution, caused 11 and 21% degradation of the drug at the irradiation time of 15 and 30 minutes, respectively. Extending the process time, does not affect improvement in PTX degradation efficiency.Moreover, Wols et al. used monochromatic low pressure (LP) (254 nm) and polychromatic medium pressure (MP) (200–300 nm) lamps to degrade 40 kinds of pharmaceuticals commonly detected in source waters. According to their research, PTX is categorized as the slowly-degrading pharmaceutical compound.20 On the other hand the SPDS/UV system provided complete decomposition of PTX after 4 minutes with [SPDS]0/[PTX]0 = 20 molar ratio, indicating that UV radiation is an essential radical promoter. Therefore, it is a promising method for PTX decomposition. The result is obtained due to reaction of PTX with sulfate radical anions SO4˙− characterized in high oxidation potential (eqn (3)):
| PTX + SO4˙− → products | (3) |
In all UV and SPDS/UV processes, the PTX remaining concentration plotted vs. reaction time (min) exhibited a good fit of the experimental date to a pseudo-first-order model by exponential regression analysis. This is evidence by the very high correlation coefficient (R2 > 0.97) obtained from the linear plots of ln[PTX]/[PTX0] vs. time (minutes). The degradation rates are 3.55 × 10⁻² and 68.60 × 10⁻² min−1 in UV and SPDS/UV system, respectively. Moreover, the SPDS/UV process provides a good TOC removal within 30 min and the corresponding mineralization is 77%. It is much better results than obtained in PTX degradation using UV system, where at the same time of the reaction only 15% of mineralization was observed. This phenomenon was observed during degradation of carbamazepine (CBZ) (0.02 mmol L−1) in aqueous solutions. CBZ was not degraded using UV alone during 60 min of the reaction. While, all of the CBZ had been degraded by the SPDS/UV process in just 10 min.21
Influence of SPDS and PTX dosage
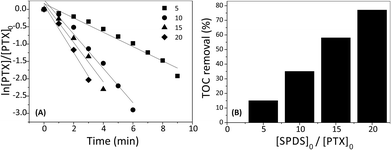
To examine the influence of sodium peroxydisulfate concentration on the PTX degradation by SPDS/UV system, different [SPDS]0/[PTX]0 ratios (5, 10, 15 or 20) were used while keeping other experimental parameters constant (200 mL PTX 0.2 mM; UVmax 253.7 nm). According to the Espendon's recommendation, the reactant remains almost constant, where [SPDS]0/[PTX]0 molar ratio is >10/1. It is consistent with the assumptions of pseudo-first-order reaction. Nonetheless, in our research controlled test with [SPDS]0/[PTX]0 molar ratio equal 5 was also taken under consideration.Fig. 4A exhibits the graphs of ln[PTX]/[PTX]0 in the presence of oxidant at different concentration as a function of reaction time. The PTX decay increase with increasing SPDS dosage. After three minutes, the degradation efficiencies of PTX with [SPDS]0/[PTX]0 ratio of 5, 10, 15 and 20 were 30, 68, 74 and 86%, respectively. The PTX decomposition well fit to a pseudo-first-order kinetics model (R2 > 0.96). As seen in Table 1, the oxidation rate constants increased from 20.68 × 10⁻² min−1 to 68.60 × 10⁻² min−1 with the increasing [SPDS]0/[PTX]0 molar ratio from 5 to 20. Similar observation was also reported by Gao Y. Q. et al. during the degradation of sulfamethazine (SMT) where within 45 minutes, [SPDS]0/[SMT]0 molar ratio 2.5, 5, 10 and 25 accomplished 54.7%, 84.6%, 96.5% and 100% degradation of 0.02 mM SMT, respectively.9 It is an undeniable fact that the rate of degradation of many organic compounds increases with increasing SPDS concentration e.g. during oxidation of phenol,22 polyvinyl alcohol,23 iopromide,24 or ibuprofen.8 Obviously, the more sodium peroxydisulfate is present in the system, the more sulfate radical ions causing degradation of organic compounds are generated. Nevertheless, one should keep in the mind, that too high dose of peroxydisulfate can inhibit decomposition of organic matter.25 It may be due to the reaction of sulfate radical ions with an excess of peroxydisulfate ions according to the eqn (4):26
| SO4˙− + S2O82− → SO42− + S2O8˙− k = 2.1 × 10⁷ M−1 s−1 | (4) |
| [PTX]0 (mM) | [SPDS]0 (mM) | [SPDS]0/[PTX]0 molar ratio | Pseudo-first-order kinetics fitting k × 10−2 [min−1] | Half-life t1/2 (min) | pH (initial–final) |
|---|---|---|---|---|---|
| SPDS concentration | |||||
| 0.2 | 1 | 5 | 20.68 | 3.35 | 5.2–3.0 |
| 0.2 | 2 | 10 | 49.52 | 1.40 | 5.2–2.8 |
| 0.2 | 3 | 15 | 56.94 | 1.22 | 5.2–2.3 |
| 0.2 | 4 | 20 | 68.60 | 1.01 | 5.2–2.2 |
![[thin space (1/6-em)]](https://www.rsc.org/images/entities/char_2009.gif) |
|||||
| PTX concentration | |||||
| 0.1 | 1 | 10 | 52.17 | 1.33 | 5.8–2.9 |
| 0.067 | 1 | 15 | 86.14 | 0.80 | 5.9–2.7 |
![[thin space (1/6-em)]](https://www.rsc.org/images/entities/char_2009.gif) |
|||||
| Initial pH | |||||
| 0.2 | 2 | 10 | 37.41 | 1.85 | 3.0–2.7 |
| 0.2 | 2 | 10 | 70.67 | 0.98 | 10.5–6.2 |
However, in our studies using even 20-fold excess of SPDS, the above effect was not observed.
Although the PTX degradation with the SPDS/UV system occurred quickly within a few minutes, the reduction of TOC was much slower and took a few hours. Fig. 4B shows the percent removal of total organic carbon depending on the excess oxidant used after 30 min of the reaction. The TOC removal rate increased with the molar ratio [SPDS]0/[PTX]0 in the range of 5–20. Additionally, the mineralization of PTX increased with time and PTX was 37% mineralized after 10 min, while 77% after 30 min with [SPDS]0/[PTX]0 = 20. It implicates, that mineralization of PTX might take place in a few stages through intermediates products (eqn(5)):
| PTX → intermidiates → CO2 + H2O | (5) |
The effect of initial PTX concentration (0.067, 0.1 or 0.2 mM) on the effectiveness of API degradation was also evaluated. In each experiment the same SPDS initial concentration (10 mM) was used. Obviously, the lower initial PTX concentration was used, the faster PTX decomposition was noticed. It may be related to the fact that, the lower PTX concentration, the higher steady-state concentration of sulfate radicals in analyzed system. Nevertheless, for all experiments, changes in PTX concentration well fit to the pseudo-first order kinetics pattern (R2 > 96) (Table 1).
Effect of initial pH
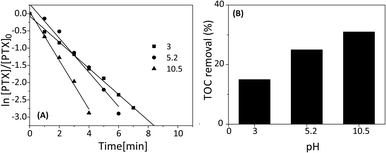
To study the effect of pH on degradation of PTX three solutions at pH 3.0, 5.2 and 10.5 were prepared using sulfuric acid or sodium hydroxide.20 All experiments were conducted using 2 mM of SPDS in the presence of UV light. As indicated in Fig. 5A, the PTX decomposition was dependent on the initial pH solution level and the degradation efficiency of PTX increased as pH increased. At the initial pH of 10.5, no PTX was detected in the samples after five minutes. At the same time, the pH of the solution decreased to 9.8.The photo-oxidation of PTX revealed first-order kinetic rate constants at different pH levels. Their corresponding rate constants (k) at pH 3.0, 5.2 and 10.5 were 37.41 × 10⁻², 49.52 × 10⁻² and 70.67 × 10⁻² min−1, respectively. This experiment implies that the k value at pH 10.5 was 1.9 times as high as that at pH 3.0. In the SPDS/UV system at pH < 7, a major role in the decomposition of PTX play sulfate radicals which are in the predominant species in analyzed system. Nevertheless, SO4˙− produced in the reaction can be scavenged by SO4˙− itself and/or persulfate anions, according to eqn (4) and (6):
| SO4˙− + SO4˙− → S2O82− | (6) |
Therefore, PTX decomposition may be retarded. Significantly decay in PTX concentration during SPDS/UV process in alkaline pH can be explained by two ways. Firstly, more valuable sulfate radicals were formed in alkaline pH by base-activated of SPDS (eqn (7)):
 | (7) |
Second, part of SO4˙− was transformed to hydroxyl radicals in the presence of hydroxyl anions (eqn (8)):22
| SO4˙− + OH− → SO42− + HO˙ | (8) |
The ˙OH are characterized by high redox potential (Eo = 2.7 V vs. SHE) and low selectivity for organic compound oxidation. Therefore, hydroxyl as well as sulfate radicals can react simultaneously with PTX and its oxidation products causing increase of the reaction rate.
Although, PTX can be degraded up to 100% after 5 minutes of the reaction with 2 mM SPDS in the presence of UV irradiation and pH 10.5, and the maximum mineralization was only 31% (Fig. 5B). When the reaction was carried out at pH 3.0 and 5.2, the TOC decreased in 15 and 25%, respectively.
Effect of anions
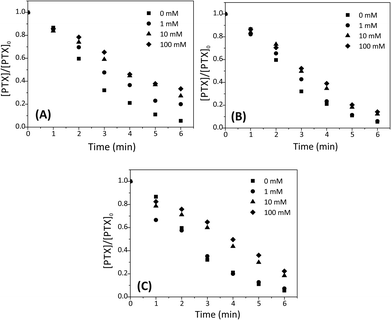
Since the effectiveness of the SPDS/UV process in decontaminating wastewater may be affected by the presence of background ions, the effects of inorganic Cl−, NO3− and CO32− anions on the degradation of PTX by the SPDS/UV system were examined using 1, 10 and 100 mM of each anions. As it is noted, chloride additive shows a negative effect on the degradation of PTX (Fig. 6A). The decomposition rates of PTX declined when concentration of chloride ions increased. The pseudo-first-order rate constants for API degradation were 49.52 × 10⁻², 28.84 × 10⁻², 21.67 × 10⁻² and 19.50 × 10⁻² min−1 for 0, 1, 10 and 100 mM chloride ions, respectively. It is experimentally proven, that chloride ion can perform as a booster as well as a retardant during oxidation of organic contaminants by SPDS. It might be a consequence of scavenging of valuable SO4˙− (eqn (9) and (10)).27,28| SO4˙− + Cl− ⇆ SO42− + Cl˙ kf = (3.2 ± 0.2) × 108 M−1 s−1; kr = (2.1 ± 0.1) × 108 M−1 s−1 | (9) |
| Cl˙ + Cl− ⇆ Cl2˙− kf = 8 × 10⁹ M−1 s−1; kr = 4.2 × 10⁴ s−1 | (10) |
Tan et al. reported a similar finding in the inhibition role of chloride ions during degradation of antipyrine in SPDS/UV system.23 In the presence of 0.53 mM SPDS, the pseudo-first-order rate constant for degradation of 0.0265 mM antipyrine was decreased from 1.657 to 1.588 h−1 when the initial chloride concentration was increased from 0 to 100 mM.
In the SPDS/UV system, NO3− ions in concentration 1, 10 and 100 mM slightly decrease of degradation efficiency of PTX (Fig. 6B). After 5 min of the reaction, the percentage removal of PTX was 89.0, 88.6, 81.6 and 79.6% when 0, 1, 10 and 100 mM nitrate ions were used, respectively. It can be caused by forming small amounts of nitrate radicals (11) which could have a worse ability to oxidaze PTX than SO4˙−.29
| SO4˙− + NO3− → SO42− + NO3˙ k = 5 × 10⁴ M−1 s−1 | (11) |
The presence of nitrate ions can also affect the photolysis rate of SPDS by absorbing part of UV-light.
Degradation of PTX was also tested in the presence of carbonate ions (Fig. 6C). For the SPDS/UV system, a low level of CO32− (1 mM) did not affect the PTX decomposing process compared to the control reaction with no carbonate. However, the pseudo first-order rate constant decrease from 49.52 × 10⁻² to 26.79 × 10⁻² and 23.53 × 10⁻² min−1 with the increasing [CO32−]0 from 0 to 10 and 100 mM, respectively. An inhibition effect of carbonate ions can be caused by forming of carbonate radical ion that has a lower a reduction potential than SO4˙− (eqn (12)):30
| SO4˙− + CO32− → SO42− + CO3˙− k = 1.6 × 10⁶ M−1 s−1 | (12) |
The pH of the PTX solution (0.2 mM, 200 mL) after dissolving 2.12 g of anhydrous sodium carbonate is 10.9, i.e. slightly higher than the highest used to determine the effect of pH on the degradation rate. In the absence of interactions of carboxylic anions with SO4˙− radicals in both cases the reaction rate should be similar if not higher. In fact, it is significantly slowed down (pH 10.5, k = 70.67 × 10⁻² min−1, pH 10.9, k = 23.53 × 10⁻² min−1).
The adverse impact of the carbonates on degradation organic compounds in SPDS reaction was also investigated e.g. by Nie M. et al. during degradation of chloramphenicol,31 Deng J. et al. in carbamazepine oxidation32 or Tan Ch. et al. in diuron decomposition.10
Operating cost analysis
There are many factors which are taken under consideration during choosing a wastewater treatment technology, e.g. operation (maintenance, control and safety), the composition of wastewater, regulations, effluent quality goals, and economics which are often paramount. In the UV-based AOPs, electrical energy is frequently the major part of the operating cost. According to the IUPAC, the efficiency of an electric-energy-intensive oxidation process can be measured with the electrical energy per order (EE/O, kWh m−3 order−1).33 The EE/O is described as the electrical energy in kilowatt per hours required to reduce the concentration of organic pollutants by one order of magnitude in 1 m3 contaminated water and can be calculated from the following (eqn (13) and (14)):
 | (13) |
 | (14) |
 | (15) |
The EE/O values for 2 × 10⁻⁴M PTX treatment by SPDS/UV system at various oxidant concentrations were calculated and delineated in Fig. 7. The lowest EE/O value was 39.18 kWh m−3 order−1 at an SPDS concentration of 4 mM It was noted that the lower the EE/O value, the more efficient the process was. There were not taken into account the costs associated with energy and chemical oxidants in eqn (13). Therefore, to identify the most economical process conditions, the total photo-oxidation process costs were calculated. If the price of electricity, in the north of Poland is $ 0.16 per kW h and SPDS purchased in AG Chemia (Poland) is $ 4.3 per kg, the cost of degradation processes will be 21.81, 10.73, 10.63 and 10.36 $ per m3 for 1, 2, 3 and 4 mM SPDS, respectively.
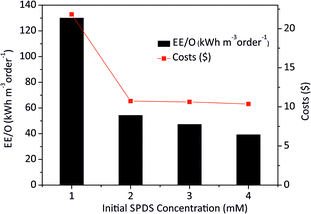 | ||
| Fig. 7 The EE/O values at different initial SPDS concentrations for PTX oxidation by SPDS/UV system. | ||
Products of PTX degradation
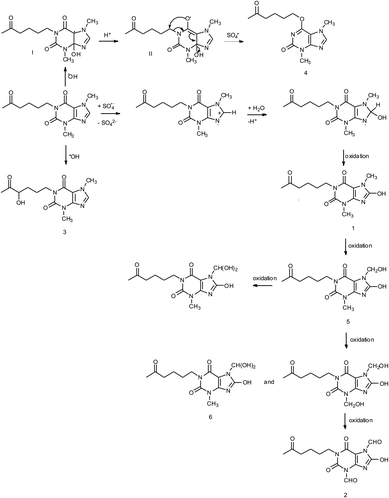
Photooxidation of simple purines (methylxanthines, adenine and guanine) in aqueous solution in presence of peroxydisulfate indicated only one reaction mechanism in which sulfate radical is capturing an electron from C8 position of purine to form purine radical cation. Subsequent reaction is deprotonation follow by water molecule or hydroxyl radical addition.34,35 Undoubtedly and in this case it is the main reaction (Fig. 8). The resulting uric acid derivative (1) undergoes the oxidation as a consequence of which products 2, 5 and 6 are obtained. However, it is difficult to explain the formation of products 3 and 4 on the basis this mechanism. On another hand PTX is not resistant to UV radiation (Fig. 3, after 30 min about 20% drug is decomposed) as well as combined system hydroxyl radical/UV (after 10 min residual concentration of PTX was detected).17 As a consequence, it should be assumed that in this case the mechanism is much less explicit. The participation of hydroxyl radicals cannot be excluded given that the major changes take place in the first five minutes when the pH of the reaction medium is 9.8. Undoubtedly, the double bond between C4 and C5 is also predisposed to substitution. However, due to the steric hindrance of the methyl substituents, direct attack of the sulfate radical is impossible. In this case, the sulfate radical is responsible for the formation of hydroxyl radicals which, without difficulty, attack the said position. The resulting radical (I) is then possibly stabilized by rearrangement to form a radical on the oxygen atom (II) that initiates another rearrangement. Almost certainly sulfate radical also participates in the last stage of the reaction (Fig. 8). Fig. 9 shows the chromatogram obtained after PTX degradation by SPDS/UV system. The major chromatographic peak is most likely formed during the PTX rearrangement. An accurate measurement of the molar mass equivalent to the PTX mass and the simultaneous absence of PTX in the mixture are in favor of this hypothesis. The final proof was 1H NMR analysis of the isolated product (Fig. 10). Comparing the H1 NMR spectra of PTX and product, it is easy to see that there is no triplet (3.96 ppm), while there is a triplet with the chemical shift 4.51 ppm characteristic of
  group. In addition, the effect of the oxygen atom on the methylene protons in the beta position is visible and resulting in a multiplet corresponding to four protons (PTX 1.58–1.63 ppm) differs by two (m, 1.68–1.74 ppm m, 1.76–1.83).
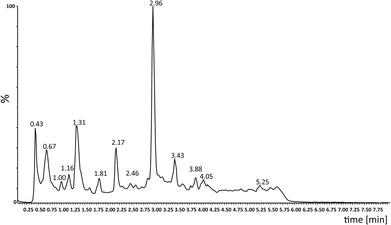 | ||
| Fig. 9 HPLC-MS chromatogram of an aliquot of the mixture after 10 min of SPDS/UV degradation (PTX 0.2 mM; [SPDS]0/[PTX]0 = 20; UVmax 253.7 nm). | ||
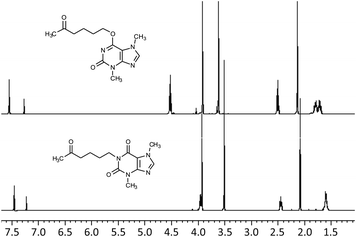 | ||
| Fig. 10 1H NMR (δ, 400 MHz, DCCl3) of PTX and its main degradation product 3,7-dimethyl-6-(5-oxohexyloxy)-3,7-dihydro-2H-purin-2-one. | ||
The formation of the isomer has not been found so far despite the use of many methods of PTX degradation.13,36–39
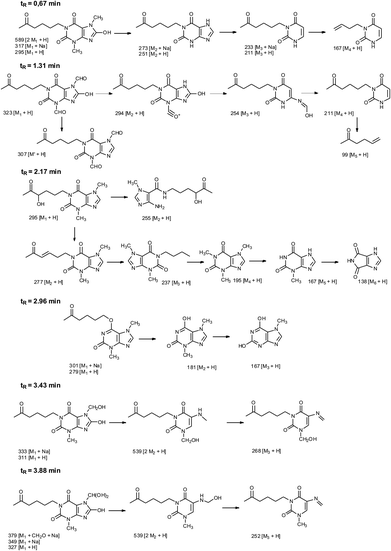
In addition to the 3,7-dimethyl-6-(5-oxohexyloxy)-3,7-dihydro-2H-purin-2-one, five other products were identified in the mixture (Table 2). Fig. 11 shows the probable structures of fragmentation ions.
| Compound | Retention time (min) | Molecular formula | [M + H]+ theoret. | [M + H]+ experim. | Error (ppm) | Mass spectral peaksa (m/z) | DBE |
|---|---|---|---|---|---|---|---|
| a The main mass ions are marked in bold. | |||||||
| 1 | 0.67 | C13H18N4O4 | 295.1406 | 295.1408 | 0.7 | 589, 317, 295, 273, 251, 233, 211, 167 | 6.5 |
| 2 | 1.31 | C13H14N4O6 | 323.0992 | 323.0990 | −0.6 | 323, 307, 294, 254, 211, 99 | 8.5 |
| 3 | 2.17 | C13H18N4O4 | 295.1406 | 295.1403 | −1.0 | 295, 277, 255, 237, 195, 167, 138 | 6.5 |
| 4 | 2.96 | C13H18N4O3 | 301.1277 [M + Na]+ | 301.1276 [M + Na]+ | −0.3 | 301, 279, 181, 167 | 6.5 |
| 279.1457 | 279.1454 | −1.1 | |||||
| 5 | 3.43 | C13H18N4O5 | 311.1355 | 311.1359 | 1.3 | 539, 333, 311, 268 | 6.5 |
| 6 | 3.88 | C13H18N4O6 | 327.1305 | 327.1302 | −0.9 | 539, 379, 349, 327, 252 | 6.5 |
Conclusions
The degradation of pentoxifylline in aqueous solution by ultraviolet activated peroxydisulfate was studied. Peroxydisulfate dosage, pH and presence of inorganic ions on PTX removal were examined. The experimental results indicate that the efficiency of the pharmaceutical decomposition increased with the SPDS concentration. The degradation of PTX by SPDS/UV process exhibited pseudo-first kinetics. The alkaline conditions were more suitable for the removal and mineralization analyzed compound. Addition of salts containing Cl− and CO32− reduced the degradation efficiency of PTX. The degradation pathway of PTX photolysis using peroxydisulfate was proposed. The main product present in the post-reaction mixture was isolated and identified as 3,7-dimethyl-6-(5-oxohexyloxy)-3,7-dihydro-2H-purin-2-one.These results showed that the SPDS/UV system can be an effective and economical process of PTX degradation in aqueous solutions.
Conflicts of interest
There are no conflicts to declare.Acknowledgements
The authors thank Gdańsk University of Technology for financial support (DS 031841). Authors express gratitude professor Żaneta Polkowska and PhD Katarzyna Kozak for their help in performing TOC measurements.Notes and references
- M. Al Aukidy, P. Verlicchi, A. Jelic, M. Petrovic and D. Barcelò, Sci. Total Environ., 2012, 438, 15–25 CrossRef PubMed.
- T. H. Fang, F. H. Nan, T. S. Chin and H. M. Feng, Mar. Pollut. Bull., 2012, 64, 1435–1444 CrossRef PubMed.
- L. P. Padhye, H. Yao, F. T. Kung'u and C. H. Huang, Water Res., 2014, 51, 266–276 CrossRef PubMed.
- Y. Ji, Y. Yang, L. Zhou, L. Wang, J. Lu, C. Ferronato and J. M. Chovelon, Water Res., 2018, 133, 299–309 CrossRef PubMed.
- H. s. Ou, J. Liu, J. s. Ye, L. l. Wang, N. y. Gao and J. Ke, Chem. Eng. J., 2017, 308, 386–395 CrossRef.
- R. Zhang, Y. Yang, C. H. Huang, N. Li, H. Liu, L. Zhao and P. Sun, Environ. Sci. Technol., 2016, 50, 2573–2583 CrossRef PubMed.
- R. E. Huie, C. L. Clifton and P. Neta, Int. J. Radiat. Appl. Instrum., Part A, 1991, 38, 477–481 Search PubMed.
- A. Ghauch and A. M. Tuqan, Chem. Eng. J., 2012, 183, 162–171 CrossRef.
- Y. q. Gao, N. y. Gao, Y. Deng, Y. q. Yang and Y. Ma, Chem. Eng. J., 2012, 195–196, 248–253 CrossRef.
- C. Tan, N. Gao, W. Chu, C. Li and M. R. Templeton, Sep. Purif. Technol., 2012, 95, 44–48 CrossRef.
- G. V Buxton, C. L. Greenstock, W. P. Helman and A. B. Ross, J. Phys. Chem. Ref. Data, 1988, 17, 513–886 CrossRef.
- A. Y. C. Lin, T. H. Yu and C. F. Lin, Chemosphere, 2008, 74, 131–141 CrossRef PubMed.
- M. Magureanu, D. Piroi, N. B. Mandache, V. David, A. Medvedovici and V. I. Parvulescu, Water Res., 2010, 44, 3445–3453 CrossRef PubMed.
- J. C. Abbar, S. J. Malode and S. T. Nandibewoor, Bioelectrochemistry, 2012, 83, 1–7 CrossRef PubMed.
- M. M. Huber, S. Korhonen, T. A. Ternes and U. Von Gunten, Water Res., 2005, 39, 3607–3617 CrossRef PubMed.
- S. A. Snyder, E. C. Wert, D. J. Rexing, R. E. Zegers and D. D. Drury, Ozone: Sci. Eng., 2006, 28, 445–460 CrossRef.
- B. Kamińska, A. Skwierawska, K. Kozłowska-Tylingo, R. Tomczak-Wandzel, A. Pazik and K. Majewska, Environ. Prot. Eng., 2017, 43, 31–47 Search PubMed.
- W. Li, V. Nanaboina, Q. Zhou and G. V. Korshin, Water Res., 2012, 46, 403–412 CrossRef PubMed.
- C. Sun, R. Zhou, J. E., J. Sun and H. Ren, RSC Adv., 2015, 5, 57058–57066 RSC.
- B. A. Wols, C. H. M. Hofman-Caris, D. J. H. Harmsen and E. F. Beerendonk, Water Res., 2013, 47, 5876–5888 CrossRef PubMed.
- Q. Zhang, J. Chen, C. Dai, Y. Zhang and X. Zhou, J. Chem. Technol. Biotechnol., 2015, 90, 701–708 CrossRef.
- C. Liang, Z. S. Wang and C. J. Bruell, Chemosphere, 2007, 66, 106–113 CrossRef PubMed.
- C. Tan, N. Gao, Y. Deng, Y. Zhang, M. Sui, J. Deng and S. Zhou, J. Hazard. Mater., 2013, 260, 1008–1016 CrossRef PubMed.
- J. R. Bolton, K. G. Bircher, W. Tumas and C. A. Tolman, Pure Appl. Chem., 2001, 73, 627–637 Search PubMed.
- H. Hori, A. Yamamoto, E. Hayakawa, S. Taniyasu, N. Yamashita, S. Kutsuna, H. Kiatagawa and R. Arakawa, Environ. Sci. Technol., 2005, 39, 2383–2388 CrossRef PubMed.
- M. Nie, Y. Yang, Z. Zhang, C. Yan, X. Wang, H. Li and W. Dong, Chem. Eng. J., 2014, 246, 373–382 CrossRef.
- Z. Wang, R. Yuan, Y. Guo, L. Xu and J. Liu, J. Hazard. Mater., 2011, 190, 1083–1087 CrossRef PubMed.
- W. J. McElroy, J. Phys. Chem., 1990, 94, 2435–2441 CrossRef.
- M. Exner, H. Herrmann and R. Zellner, Ber. Bunsenges. Phys. Chem., 1992, 96, 470–477 CrossRef.
- Z. Zuo, Z. Cai, Y. Katsumura and N. Chitose, Radiat. Phys. Chem., 1999, 55, 15–23 CrossRef.
- M. Nie, C. Yan, M. Li, X. Wang, W. Bi and W. Dong, Chem. Eng. J., 2015, 279, 507–515 CrossRef.
- J. Deng, Y. Shao, N. Gao, Y. Deng, S. Zhou and X. Hu, Chem. Eng. J., 2013, 228, 765–771 CrossRef.
- P. Asaithambi, R. Saravanathamizhan and M. Matheswaran, Int. J. Environ. Sci. Technol., 2015, 12, 2213–2220 CrossRef.
- M. M. Sunil Paul, U. K. Aravind, G. Pramod, A. Saha and C. T. Aravindakumar, Org. Biomol. Chem., 2014, 12, 5611–5620 RSC.
- S. Steenken, Chem. Rev., 1989, 89, 503–520 CrossRef.
- M. K. Mone and K. B. Chandrasekhar, J. Pharm. Biomed. Anal., 2010, 53, 335–342 CrossRef PubMed.
- J. C. Abbar, S. J. Malode and S. T. Nandibewoor, Polyhedron, 2010, 29, 2875–2883 CrossRef.
- R. N. Hegde and S. T. Nandibewoor, Anal. Lett., 2008, 41, 977–991 CrossRef.
- R. N. Hegde, N. P. Shetti and S. T. Nandibewoor, Ind. Eng. Chem. Res., 2009, 48, 7025–7031 CrossRef.
| This journal is © The Royal Society of Chemistry 2018 |


