
 Open Access Article
 This Open Access Article is licensed under a
 Creative Commons Attribution 3.0 Unported Licence
Nitrogen-doped carbon quantum dots for fluorescence detection of Cu2+ and electrochemical monitoring of bisphenol A†
Xinran Wu‡
a,
Lina Wu‡b,
Xizhong Caob,
Ying Lia,
Anran Liu *a and
Songqin Liua
*a and
Songqin Liua
aJiangsu Engineering Laboratory of Smart Carbon-Rich Materials and Device (CMD), Jiangsu Province Hi-Tech Key Laboratory for Bio-medical Research, School of Chemistry and Chemical Engineering, Southeast University, Nanjing, 211189, P. R. China. E-mail: liuar@seu.edu.cn
bJiangsu Entry-Exit Inspection and Quarantine Bureau Industrial Products Testing Center, P. R. China
First published on 30th May 2018
Abstract
In this work, water-soluble nitrogen-doped carbon quantum dots (N-CDs) were synthetized at low temperature via a simple hydrothermal strategy, using citric acid as the carbon source and polyethylenimine (PEI) as the nitrogen source. The as-prepared N-CDs with near spherical structure and sizes of 4.5–7.5 nm exhibited blue luminescence and a fluorescence quantum yield of 40.2%. Both X-ray photoelectron spectroscopy (XPS) and FTIR spectroscopy measurements demonstrated the presence of the primary and secondary amines on the surface of the N-CDs. The fluorescence of N-CDs could be effectively quenched by Cu2+ owing to the formation of a copper–amine complex between Cu2+ and the amino groups on the surface of the N-CDs. Since this behavior was quite pronounced the fluorescence quenching was used for Cu2+ detection with high sensitivity and good selectivity. The linear range spanned the concentration of Cu2+ from 0.2 to 10 μM with a detection limit of 2 nM. In addition, the N-CDs could effectively electrochemically catalyze the oxidation of bisphenol A (BPA), which provided a promising method for BPA detection. The calibration range of BPA was 0.01 to 0.21 μM with a detection limit of 1.3 nM.
1. Introduction
In recent years, carbon dots (CDs) have attracted great interest in analytical chemistry due to their excellent properties, such as high water solubility, high fluorescence quantum yield and electrocatalytic performance.1–6 CDs can be synthesized from environment-friendly materials by simple and low-cost methods in contrast to heavy metal ion quantum dots.7,8 Synthesis of CDs could be realized by pyrolysis or carbonization of small organic molecules or by step-wise chemical fusion of small aromatic molecules, which is denoted the “bottom-up” method. The small organic molecules were heated above their melting point, followed by condensation and nucleation. After subsequent carbonization, larger CDs were formed. Some organic salts have been used as the precursors, such as diethylene glycol ammonium citrate,9 coffee grounds,10 citric acid,11 L-glutamic acid,12 glycerol,13 and disodium ethylenediamine tetraacetic acid.14 Simple combustion,15 plasma,16 hydrothermal methods17 and microwaves18 have been used to convert the precursors to CDs. These methods are simple, cost-effective and scalable, which allow natural inheritance of heteroatoms from the precursors. The exceptional fluorescent properties of CDs have been utilized to detect metal ions, sugars, and proteins in solutions or inside cells, based on either fluorescence “turn-on” or “turn-off” mechanisms.19–22 Glucose could induce boronic acid modified CDs to aggregation which would lead to fluorescence quenching, due to the specific covalent binding between the cis-diols of glucose and the boronic acid moieties on the surface of CDs.23 1-Butyl-3-methylimidazolium functionalized CDs were used to detect Fe3+ due to the high binding affinity of the imidazole ring of CDs to Fe3+.24 Fe3+ acted as a coordination center to bridge several CDs together and consequently led to fluorescence quenching. Owing to the small sizes, large specific surface area abundant edge sites and intrinsic catalytic activity, CDs could play a role as the catalytic centers of enzymes and they could also facilitate electron transfer.25,26 Due to the intrinsic catalytic activity of CDs towards H2O2, the sensor based on CDs modified Au electrode could sensitively detect H2O2 and monitor the dynamic H2O2 release from human breast adenocarcinoma MCF-7 cells.27 Zhao et al. demonstrated that CDs could greatly enhance the sensitivity by promoting electron transfer to electrode and the CDs could be applied in DNA or protein detection.28 Recent studies also demonstrated that heteroatom doping could also endow CDs with catalytic properties.29–31Selective and sensitive detection of heavy metal ions and environmental endocrine disruptors has become more and more significant in the areas of bioanalysis and environmental monitoring. Among the essential heavy metal ions, Cu2+ is a prominent environmental pollutant from the untreated industry wastewater and Cu2+ is greatly harmful to animals and plants. Excess Cu2+ inhibits the growth of a variety of viruses and bacteria owing to its high toxicity.32 Excess intake of copper exhibits toxicity, causing serious neurodegenerative diseases, such as Menkes, Alzheimer's and Wilson's diseases due to displacement of other vital metal ions in enzyme-catalyzed reactions.33,34 Hence, an effective method for the detection of Cu2+ in the water environment and human body is of great significance for environmental protection and human disease treatment. So far, various methods for Cu2+ detection have been developed including electrochemical method,35 UV-vis spectrophotometry,36 atomic absorption spectrometry,37 inductively coupled plasma mass spectrometry38 and fluorescence methods55 by using various nano-probes to enhance the sensitivity and selectivity towards the Cu2+ detection. For example, Chen and co-authors used glutathione-capped gold nanoparticles as fluorescence ‘‘turn-off’’ probe for Cu2+ sensing.39 The complexation between glutathione molecules and Cu2+ could induce aggregation and fluorescence quenching of glutathione-capped gold nanoparticles. After this work, they further fabricated a “turn-on” PET fluorescence sensor by incorporating coumarin fluorophores within the benzyl dihydrazone moiety.40 After Cu2+ ions were selectively coordinated by typical N,O-chelators, the fluorescence intensity of the sensor could be enhanced.
On the other hand, BPA is an significant raw material in industrial production which is widely found in our lives.41,42 However, a large number of studies showed that BPA has strong biological toxicity and can interfere with hormonal activities.43,44 For BPA detection, many traditional methods such as high-performance liquid chromatography (HPLC), fluorimetry, chemiluminescence, gas chromatography-mass spectrometry (GC-MS), and enzyme-linked immunosorbent assay (ELISA)45–49 have been developed. Electrochemical detection has its unique advantages such as cheap instrument, low cost, fast detection and high sensitivity. However, there is no obvious electrochemical response for BPA detection using bare electrode. Therefore, it is necessary to develop new sensing materials with excellent catalytic performance, good electrical conductivity and high stability for BPA sensing.
Herein, we synthesized a kind of Nitrogen doped carbon quantum dots (N-CDs), which could be applied to the Cu2+ and BPA detection. We used a one-step hydrothermal method to prepare the N-CDs by using citric acid and polyethylenimine (PEI). The amino groups on the surface of the N-CDs could bond the Cu2+ to form cupric amine, which would lead to a strong fluorescence quenching of the N-CDs (see Scheme 1). Thus, a rapid, selective and sensitive method based on N-CDs has been developed for fluorescent sensing of Cu2+. In addition, nitrogen doped carbon materials were proved to be ideal materials in electrochemical sensing for their excellent conductivity, good biocompatibility and electro-catalytic property due to active center provided by nitrogen, which showed good performance in the electrocatalysis for the oxidation of BPA.
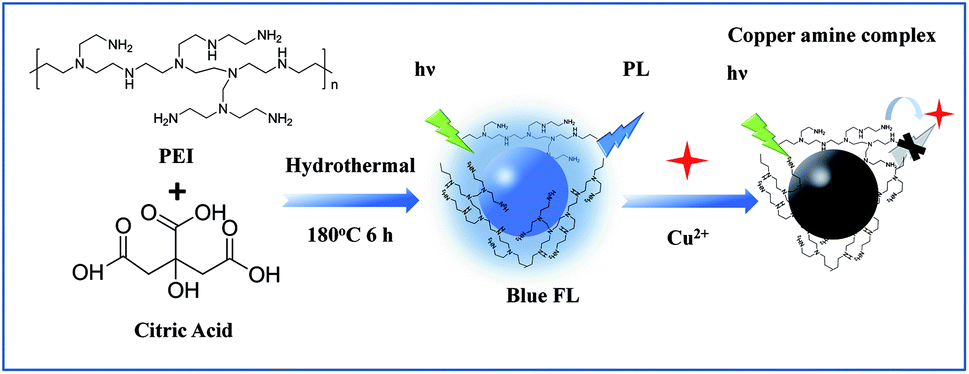 | ||
| Scheme 1 Schematic illustration for preparation of the N-CDs and using for fluorescence detection of Cu2+. | ||
2. Experimental section
2.1 Chemicals
CuCl2, ZnCl2, Co(NO3)2, FeCl2, Fe(NO3)2, CaCl2, KCl, NaCl, MnCl2, Ni(NO3)2, CdCl2, MgCl2, Al(NO3)2, Pb(NO3)2 and AgNO3 were bought from Shanghai Chemical Reagent Company. Citric acid and PEI were purchased from Sino Pharm Group Co. Ltd. 100 mM pH 6.0 and pH 7.4 phosphate solution (PBS) was prepared by mixing the stock solution of NaH2PO4 and Na2HPO4 in proportion at room temperature. Bisphenol A (BPA), bisphenol F (BPF) and bisphenol S (BPS) were purchased from Sinopharm Chemical Reagent Co. Ltd. (China). Nafion (10%, in water) was received from Sigma-Aldrich (Shanghai, China). All reagents were of at least analytical grade and used as received without further purification. All solutions were prepared with double distilled water.2.2 Apparatus
The transmission electron microscopy (TEM) was carried out with a JEM-2010 TEM (JEOL, Japan). The energy dispersive spectroscopy (EDS) was carried out with a JEM-2100F TEM (JEOL, Japan). X-ray diffraction (XRD) pattern were acquired on a Bruker D8 Discover with Cu Kα radiation in the diffraction angle range of 2θ = 5–80°. UV-vis absorption spectra were performed on the UV-visible spectrometer (Shimadzu UV-2450, Kyoto, Japan). The FT-IR spectra of the N-CDs were gathered on a FT-IR spectrophotometer (Nicolet 5700). Fluorescence spectra were collected by FluoroMax-4 Spectrofluorometer with xenon discharge lamp excitation (Horiba, USA). Cyclic voltammograms (CV) and amperometric measurements were recorded on CHI 660C electrochemical workstation (Chenhua, China). All electrochemical measurements were performed using a conventional three-electrode system: a glassy carbon electrode (GCE, 3 mm in diameter), a platinum wire electrode and a saturated calomel electrode (SCE) as the working electrode, the counter electrode and the reference electrode respectively.2.3 Preparation of fluorescence probe N-CDs
The N-CDs were briefly synthesized by using citric acid as carbon sources and polyethylenimine (PEI) as nitrogen sources through a hydrothermal process. Citric acid (1 g) and PEI (0.5 g) were dissolved in 20 mL of deionized water in a 50 mL glass beaker under magnetic stirring. Then, the mixture was placed in a Teflon-lined stainless steel autoclave and heated at 180 °C for 6 hours. After the reaction finished, the reactor was cooled down to the room temperature and a dark brown solution was obtained. The resultant solution was dialyzed in a dialysis bag for a week (retained molecular weight: 1000 Da) to purify the N-CDs.2.4 Quantum yield measurement
The quantum yield (Qy) of the N-CDs was measured with quinine sulfate using following equation:| Qy = Qstd (Ix/I) (nx2/nstd2) (Astd/Ax) | (1) |
2.5 Procedures for the Cu2+ detection
The fluorescent detection of Cu2+ was carried out in 100 mM PBS (pH 6.0) buffer solution. 100 μL of the purified N-CDs solution (100 μg mL−1) was added to 1 mL buffer solution. Then different concentrations of Cu2+ were added and the fluorescence spectra at an excitation of 361 nm were recorded.2.6 Procedures for the BPA detection
The glassy carbon electrode (GCE) with 3 mm diameters was polished using alumina powder, followed by rinsing thoroughly with purified water. After sonication in 1![[thin space (1/6-em)]](https://www.rsc.org/images/entities/char_2009.gif) :1 nitric acid, acetone and water, the GCE was rinsed by purified water. Then, 6 μL N-CDs were modified onto the cleaned surface of the GCE and dried at room temperature. After that, 5 μL 0.05% Nafion solution was coated atop the N-CDs/GCE and dried at room temperature. After dried, the Nafion/N-CDs/GCE modified working electrode was ready to measure.
:1 nitric acid, acetone and water, the GCE was rinsed by purified water. Then, 6 μL N-CDs were modified onto the cleaned surface of the GCE and dried at room temperature. After that, 5 μL 0.05% Nafion solution was coated atop the N-CDs/GCE and dried at room temperature. After dried, the Nafion/N-CDs/GCE modified working electrode was ready to measure.
The 0.1 M pH 7.4 PBS was used for all electrochemical measurements. Cyclic voltammograms (CVs) were recorded at 100 mV s−1. The differential CVs were recorded from 0 to 0.80 V and the oxidation peak current was measured for BPA detection. The current–time curve was recorded by amperometric measurement with an applied potential of 0.55 V (vs. SCE). In this case, BPA was added to the PBS solution after the background current stabilized at 500 s and the change of current was recorded.
3. Results and discussion
3.1 Characterization of the N-CDs
The N-CDs were synthesized by a complicated thermal decomposition process by using citric acid as carbon sources and PEI as nitrogen sources at a low temperature. The TEM images showed that the N-CDs displayed near spherical structures (Fig. 1A) and the size of the N-CDs nanoparticles were estimated to be 4.5 to 7.5 nm (Fig. 1B). The elemental chemical composition of the N-CDs was characterized by energy dispersive spectroscopy (EDS) and the result was shown in Fig. S1.† The N-CDs were composed of C (69.43%), N (10.27%) and O (16.30%). X-ray diffraction (XRD) pattern of the N-CDs showed a broad diffraction peak at 2θ = 21.02°(Fig. 1C), suggesting the formation of amorphous carbon in N-CDs, which is consistent with previous studies.50,51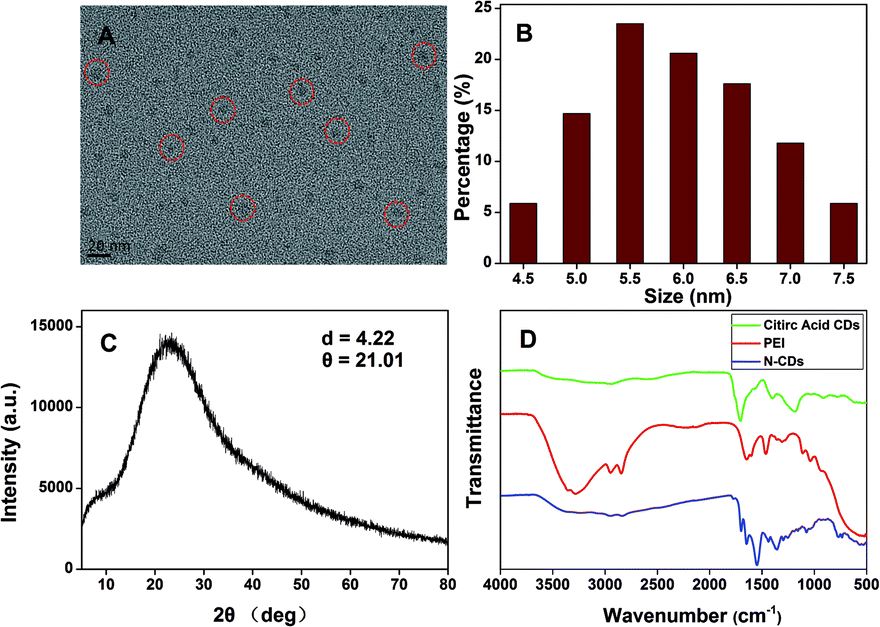 | ||
| Fig. 1 (A) TEM image, (B) size distribution histogram and (C) XRD spectrum of the N-CDs. (D) FT-IR spectra of citric acids, PEI and the N-CDs. | ||
The FTIR spectra (Fig. 1D) showed that the N-CDs had strong N–H bending vibration peaks at 1645 and 1546 cm−1, C–H bending vibration peak at 1455 cm−1, C![[double bond, length as m-dash]](https://www.rsc.org/images/entities/char_e001.gif) O stretching vibration at 1700 cm−1, characteristic absorption bands of O–H and N–H stretching vibration at 3354 and 3241 cm−1,52 indicating characteristic groups from citric acid and PEI. Moreover, the zeta potential of the N-CDs at pH 4 is +24 mV, demonstrating the presence of the primary and secondary amines on the surface of the N-CDs. The chemical constitution and the structure of the N-CDs were investigated by X-ray photoelectron spectroscopy (XPS). Fig. 2A showed the general survey of the XPS spectrum of the N-CDs. Three strong binding energy peaks at 285.08, 399.08 and 531.08 eV were attributed to O 1s, N 1s, and C 1s, respectively. The N-CDs were composed of C (63.79%), N (16.23%) and O (19.98%), which was consistent with the EDS data. Specially, in the high resolution spectrum of C 1s (Fig. 2B), there were three peaks at 284.6, 287.0 and 285.2 eV respectively, which were attributed to CC, CO, C–OH and C–N groups. Three remarkable peaks in the N 1s spectrum at 398.8, 399.5 and 401.2 eV (Fig. 2C) were attributed to C–NC, C–N–C and N–H groups. In the O 1s spectrum (Fig. 2D), two peaks at 530.3 and 531.3 eV were attributed to CO, C–OH and C–O–C groups.53 The XPS spectrum indicated that the N-CDs were composed to three elements of C, N and O with multiple oxygen-containing groups and nitrogen groups on the surface of the N-CDs.
O stretching vibration at 1700 cm−1, characteristic absorption bands of O–H and N–H stretching vibration at 3354 and 3241 cm−1,52 indicating characteristic groups from citric acid and PEI. Moreover, the zeta potential of the N-CDs at pH 4 is +24 mV, demonstrating the presence of the primary and secondary amines on the surface of the N-CDs. The chemical constitution and the structure of the N-CDs were investigated by X-ray photoelectron spectroscopy (XPS). Fig. 2A showed the general survey of the XPS spectrum of the N-CDs. Three strong binding energy peaks at 285.08, 399.08 and 531.08 eV were attributed to O 1s, N 1s, and C 1s, respectively. The N-CDs were composed of C (63.79%), N (16.23%) and O (19.98%), which was consistent with the EDS data. Specially, in the high resolution spectrum of C 1s (Fig. 2B), there were three peaks at 284.6, 287.0 and 285.2 eV respectively, which were attributed to CC, CO, C–OH and C–N groups. Three remarkable peaks in the N 1s spectrum at 398.8, 399.5 and 401.2 eV (Fig. 2C) were attributed to C–NC, C–N–C and N–H groups. In the O 1s spectrum (Fig. 2D), two peaks at 530.3 and 531.3 eV were attributed to CO, C–OH and C–O–C groups.53 The XPS spectrum indicated that the N-CDs were composed to three elements of C, N and O with multiple oxygen-containing groups and nitrogen groups on the surface of the N-CDs.
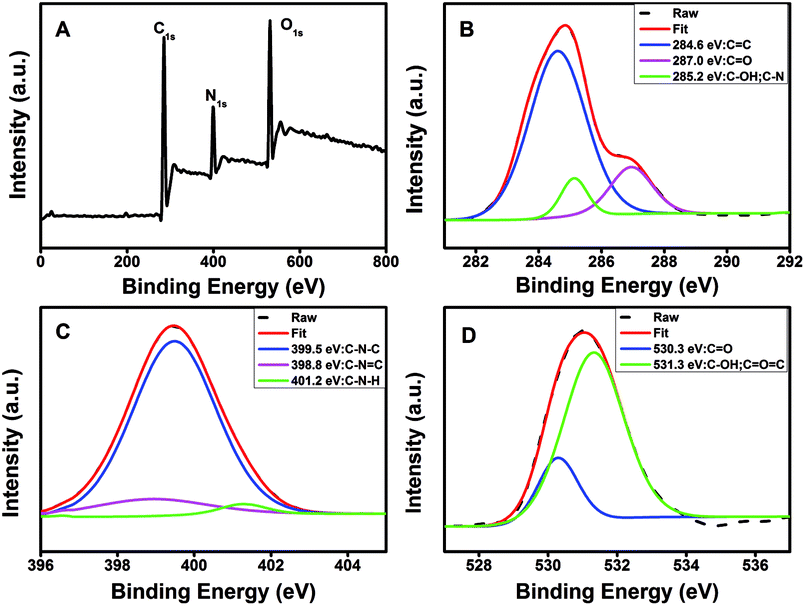 | ||
| Fig. 2 (A) XPS spectrum and high resolution XPS spectra of (B) C 1s, (C) N 1s and (D) O 1s of the N-CDs. | ||
To investigate the optical properties of N-CDs, more detail studies were performed by UV-vis and fluorescent spectra. The UV-vis spectra of N-CDs showed an absorption peak at about 361 nm (Fig. 3), which was relevant to the n–π* transition of the CO bonds.54 Under UV excitation at 365 nm, the N-CDs displayed blue luminescence. The N-CDs solution exhibited maximum emission wavelength at 441 nm under excitation at 361 nm. There was almost no shift of the maximum emission wavelength of the N-CDs when the excitation wavelength was changed from 300 to 380 nm, indicating that the N-CDs had uniform particle size and favorable dispersion in solution.55 The quantum yield of the N-CDs was 40.2% by using quinine sulfate as standard.
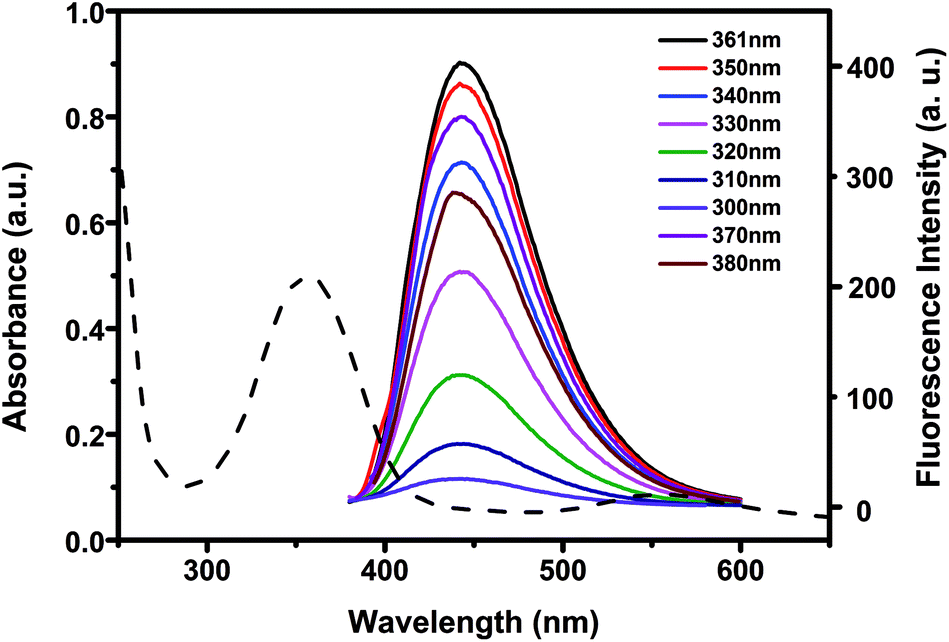 | ||
| Fig. 3 UV absorption spectra and fluorescence emission spectra of 10 μg mL−1 N-CDs at different excitation wavelengths. | ||
3.2 Fluorescence quenching and application for Cu2+detection
In the presence of Cu2+ the fluorescence intensity of the N-CDs quenched quickly (Fig. S2†). The fluorescence intensity of the N-CDs decreased up to around 90% of its original intensity within 3 minutes. No fluorescence quenching was observed for the bare CDs (prepared by citric acid as carbon source only) without amines after addition of the same amount of Cu2+ (Fig. S3†). We reason that Cu2+ could chelate with amines on the surface of N-CDs to form cupric amine. As a result, Cu2+ and N-CDs were close proximity with each other and the electron or energy transferred between Cu2+ and the N-CDs, which caused substantial fluorescence quenching. The electron or energy transferred between Cu2+ and N-CDs was supported by UV-vis measurement (Fig. S4†). Comparing to the N-CDs, the addition of Cu2+ into the N-CDs solution led to produce a new absorption band at 285 nm along with two other bands at around 600–700 nm which belonged to the N-CDs themselves (Fig. S4†). When adding Cu2+ to PEI, a new absorption band at 285 nm accompanied with two bands at around 600–700 nm were also observed (Fig. S5†). Therefore, the new absorption band at 285 nm could be attributed to the strong interaction between Cu2+ and amino-groups in PEI. This also demonstrated the presence of active amino-groups on the surface of the as-prepared N-CDs, which were able to chelate with Cu2+ to quench the fluorescence of the N-CDs.On the other hand, the fluorescence intensity of N-CDs was significantly affected by the pH of the solution. Fig. S6† showed the fluorescence intensities of 10 μg mL−1 N-CDs in the absence or presence of 10μM Cu2+ at different pH values (pH 2–12) in PBS solution. The N-CDs exhibited the best quenching efficiency at pH 6.0, which might be due to the protonation of amine groups.56 Thus, pH 6.0 was chosen as the optimized condition for the detection of Cu2+ (Fig. S6†). In pH 6.0 PBS solution, the fluorescence intensity of N-CDs was sensitive to Cu2+ concentration and the intensity decreased with the Cu2+ concentration increasing. The quenching efficiency (F0/F, F0 and F were the fluorescent intensity of N-CDs before and after addition of Cu2+) was increased with Cu2+ concentration in the range from 0.2 to 10 μM (Fig. 4). The linear regression equation was F0/F = 0.878 c(Cu2+) + 1.1079 with a correlation coefficient of 0.9996. The detection limits of Cu2+ (at a S/N of 3) is 2 nM.
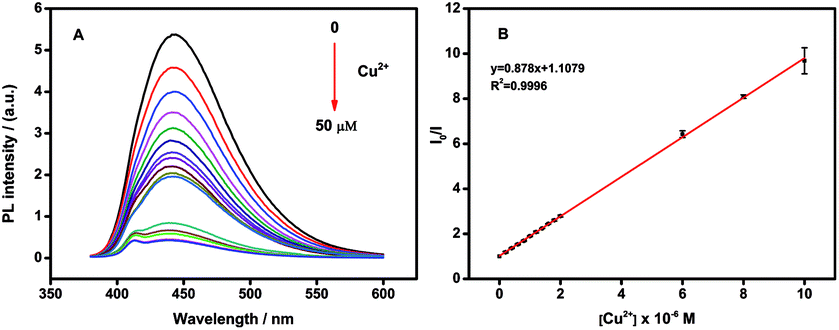 | ||
| Fig. 4 (A) Fluorescence response of 10 μg mL−1 N-CDs upon addition of various concentration of Cu2+ (from 0.2 to 50 μM) in PBS solution. (B) Linear correlation between the Cu2+ concentration and the quenching efficiency(F0/F) from 0.2 to 10 μM. | ||
For the stability of the N-CDs, the as-prepared N-CDs was stored in a dark and dry atmosphere environment for different periods of time, followed by fluorescence detection of 10 μg mL−1 N-CDs and the quenching efficiency by adding 10 μM Cu2+. As shown in Fig. S7,† approximately 88% of the original signal intensity was remained after 2 months, indicating good storage stability of the N-CDs. The reproducibility and precision was investigated by the standard recovery experiment by means of intra-assay and inter-assay relative standard deviation (RSD). The intra-assay RSDs were 4.5%, 3.7%, 5.2% corresponding to 0.5, 2, 5 μM Cu2+ concentration in five parallel experiments. The inter-assay RSDs were 4.8%, 5.5%, 4.4% towards 0.5, 2, 5 μM Cu2+ concentration from five batches of the as-prepared N-CDs fluorescence probe samples. The satisfactory reproducibility and precision indicated the potential value in practical applications.
To evaluate the selectivity of the N-CDs for Cu2+ recognition, the fluorescence intensity of the N-CDs in the presence of different ionic species, such as 10 μM of Cu2+, Fe2+, Fe3+, Co2+, Mn2+, Ni2+, Cd2+, Mg2+, Zn2+, Na+, K+, Al3+, Pb2+, Ca2+ and Ag+, were monitored. The results were presented in Fig. 5, which indicated that only Cu2+ quenched the fluorescence of the N-CDs dramatically. In comparison, the same metal ions were added to bare CDs (prepared by citric acid as carbon source only) without amines (Fig. S3†). No fluorescence quenching was observed with any metal ions addition included Cu2+, indicating that the N-CDs was highly selective for Cu2+ detection.
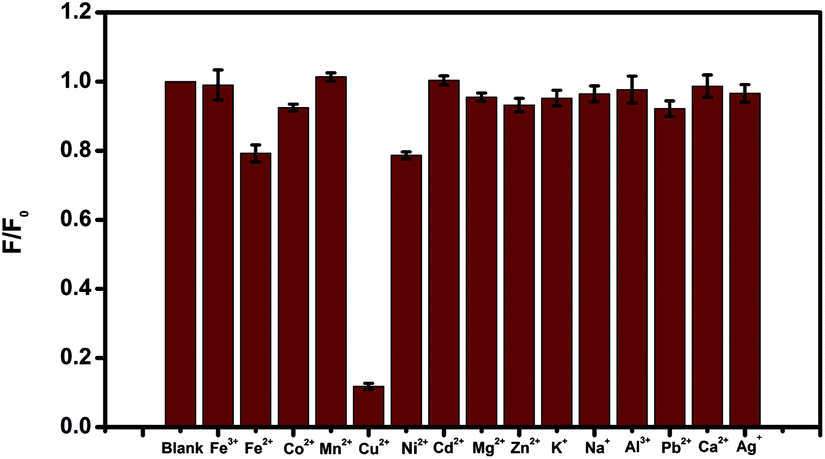 | ||
| Fig. 5 Fluorescence response of 10 μg mL−1 N-CDs at presence of 10 μM different metal ions. | ||
The detection of Cu2+ in real sample was conducted to evaluate the feasibility of the detection method for practical application. As shown in Table 1, different concentrations of Cu2+ were added to the standardized human serum (50-fold dilution with PBS buffer) in presence of the N-CDs, followed by testing the Cu2+ in each sample for 5 times. It was observed that the recoveries were between 96.6% and 102.2% and the relative standard deviations (RSD) were from 2.92% to 6.38%. These results demonstrated the Cu2+ detection method has great potential in human vivo diagnosis.
| No. | Added (μM) | Found (μM) | Recovery (%) | RSD (%) |
|---|---|---|---|---|
| 1 | 0.2 | 0.204 | 102.0 | 5.72 |
| 2 | 0.5 | 0.511 | 102.2 | 3.13 |
| 3 | 1 | 0.998 | 99.8 | 6.38 |
| 4 | 2 | 1.992 | 96.6 | 3.73 |
| 5 | 5 | 5.064 | 101.3 | 2.92 |
3.3 Electrochemical detection of BPA
The N-CDs exhibited good electrochemically catalytic properties for the oxidation of BPA. The response of the N-CDs modified GCE electrode in the absence and presence of 0.2 mM BPA in pH 7.4 PBS solution was shown in Fig. 6A. According to the results of cyclic voltammetry (CV), there was no oxidation current in the absence of BPA. After adding 0.2 mM BPA to the system, a distinct oxidation peak at 0.55 V was observed, indicating that an oxidation reaction of BPA occurred under electrochemically catalysis. When adding 0.2 mM BPA to the system with bare GCE without N-CDs as the control experiment, no obvious oxidation peak was observed, indicating that bare GCE could not catalyze the oxidation reaction of BPA. Moreover, the oxidation current intensity increased with the concentration of BPA from 0.1 to 0.4 mM (Fig. S8†), indicating the N-CDs could be used for a novel method for detection of BPA.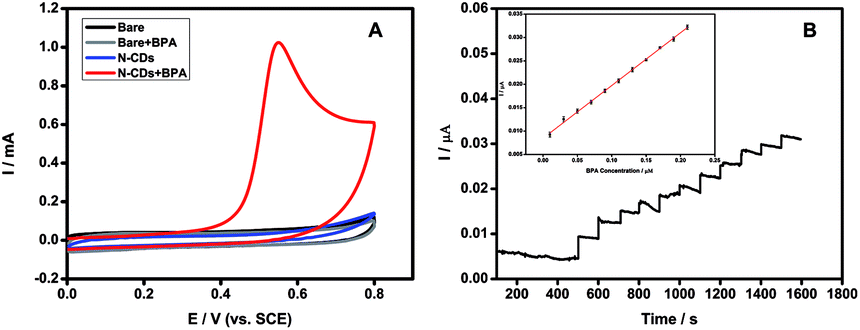 | ||
| Fig. 6 (A) CVs of the response to different modified GCE in the absence and presence of 0.2 mM BPA in pH 7.40 PBS solution. (B) Amperometric response of Nafion/N-CDs/GCE with successive additions of 0.02 μM BPA in PBS (pH 7). Applied potential: 0.55 V. Insert: calibration curve. | ||
The catalysis performance of the N-CDs usually depends on the amount of the N-CDs modified on the GCE and the pH value of the substrate solution during the BPA detection. The conditions above were all optimized to get the maximum signal to noise ratio, and thus obtain lower detection limit and wider detection range. As shown in Fig. S9,† the oxidation current response increased gradually to the maximum when the concentration of the N-CDs immobilized on the GCE was increased from 0.1 to 0.3 mg mL−1. Then the current signal decreased significantly when the concentration of the N-CDs increased further. It could be attributed to the high concentration of the N-CDs immobilized on the GCE, leading to increase of film thickness and the interface electron transfer resistance. Hence, 0.3 mg mL−1 of the N-CDs was chosen to immobilize on the GCE for BPA detection. The effect of pH value on the current response of BPA was also shown in Fig. S9.† The oxidation current increased from pH 4 to 7 and then decreased when the solution pH further increased. Therefore, pH 7 was chosen for the subsequent detection of BPA.
Based on an applied oxidation potential of 0.55 V, the current–time curve was recorded with the successive addition of 0.02 μM BPA into pH 7 PBS. Fig. 6B showed that the N-CDs modified electrode had highly sensitive response to BPA addition. A linear correlation between the BPA concentration and the current intensity could be obtained with the range from 0.01 to 0.21 μM via the equation of I = 0.11275 cBPA + 0.0085 with a correlation coefficient of 0.9987. The detection limit was estimated to be 1.3 nM according to 3σ. The favorable linearity and low detection limit indicates that the N-CDs could be a promising material to establish BPA electrochemical sensor.
In order to evaluate the selectivity of BPA detection, the electrochemical response to the substitutes of BPA such as BPS and BPF was recorded. The CVs of the response to different modified GCE in the presence of 0.2 mM BPA, BPF and BPS in pH 7.40 PBS solution were shown in Fig. S10.† Oxidation peaks could be observed at 0.58 V for BPF and 0.63 V for BPS, indicating that the N-CDs could also catalyze the oxidation of BPA substitutes with similar molecular structure. However, the peak current intensity of BPF and BPS was much lower than that of BPA, suggesting that the N-CDs could selectively detect BPA beside its substitutes.
4. Conclusions
In conclusion, a novel nitrogen-doped carbon quantum dots (N-CDs) were synthesized by a facile and green hydrothermal synthesis method through the reaction of citric acid with polyethylenimine. The water-soluble N-CDs could exhibit blue luminescence with a fluorescence quantum yield of 40.2%. Due to the selective fluorescence quenching by Cu2+ and the electrocatalytical performance towards the oxidation of BPA, the as-prepared N-CDs were successfully applied for the quantitative detection of Cu2+ and BPA. The N-CDs fluorescence probe showed a satisfactory reproducibility and precision for Cu2+detection, indicating the potential value in practical applications. Therefore, the sensitive and selective methods for Cu2+ and BPA detection have promising applications to environmental protection and human disease treatment.Conflicts of interest
There are no conflicts to declare.Acknowledgements
This work was financially supported by the National Natural Science Foundation of China (21505018), the Nation Key Research and Development Program of China (2016YFF0203703), Fundamental Research Funds for the Central Universities and the Open Project Program of State key laboratory of pharmaceutical biotechnology, Nanjing University, China.References
- M. Amjadi and R. Jalili, Biosens. Bioelectron., 2017, 96, 121–126 CrossRef PubMed.
- S. N. Baker and G. A. Baker, Angew. Chem., Int. Ed., 2010, 49, 6726–6744 CrossRef PubMed.
- Y. Q. Dong, N. N. Zhou, X. M. Lin, J. P. Lin, Y. W. Chi and G. N. Chen, Chem. Mater., 2010, 22, 5895–5899 CrossRef.
- D. H. Huang, L. F. Yin, X. Y. Lu, S. M. Lin, Z. J. Niu and J. F. Niu, Chem. Eng. J., 2017, 323, 406–414 CrossRef.
- H. Y. Wang, Q. H. Zhang, H. S. Yin, M. H. Wang, W. J. Jiang and S. Y. Ai, Biosens. Bioelectron., 2017, 323, 124–130 CrossRef PubMed.
- C. Q. Zhou, X. X. He, D. M. Ya, J. Zhong and B. Y. Deng, Sens. Actuators, B, 2017, 249, 256–264 CrossRef.
- K. Jiang, S. Sun, L. Zhang, Y. H. Wang, C. Z. Cai and H. W. Lin, ACS Appl. Mater. Interfaces, 2015, 7, 23231–23238 Search PubMed.
- S. J. Zhao, M. H. Lan, X. Y. Zhu, H. T. Xue, T. W. Ng, X. M. Meng, C. S. Lee, P. F. Wang and W. J. Zhang, ACS Appl. Mater. Interfaces, 2015, 7, 17054–17060 Search PubMed.
- A. B. Bourlinos, A. Stassinopoulos, D. Anglos, R. Zboril, M. Karakassides and E. P. Giannelis, Small, 2008, 4, 455 CrossRef PubMed.
- P. C. Hsu, Z. Y. Shih, C. H. Lee and H. T. Chang, Green Chem., 2012, 14, 917 RSC.
- J. Ju and W. Chen, Biosens. Bioelectron., 2014, 58, 219 CrossRef PubMed.
- X. Wu, F. Tian, W. Wang, J. Chen, M. Wu and J. X. Zhao, J. Mater. Chem. C, 2013, 1, 4676 RSC.
- C. W. Lai, Y. H. Hsiao, Y. K. Peng and P. T. Chou, J. Mater. Chem., 2012, 22, 14403 RSC.
- Y. H. Deng, D. X. Zhao, X. Chen, F. Wang, H. Song and D. Z. Shen, Chem. Commun., 2013, 49, 5751 RSC.
- J. Wang, C. F. Wang and S. Chen, Angew. Chem., Int. Ed., 2012, 51, 9297 CrossRef PubMed.
- J. Kim and J. S. Suh, ACS Nano, 2014, 8, 4190 CrossRef PubMed.
- K. Jiang, S. Sun, L. Zhang, Y. Lu, A. Wu, C. Cai and H. Lin, Angew. Chem., Int. Ed., 2015, 54, 5360–5363 CrossRef PubMed.
- J. Y. Yin, H. J. Liu, S. Jiang, Y. Chen and Y. Yao, ACS Macro Lett., 2013, 2, 1033 CrossRef.
- C. I. Wang, A. P. Periasamy and H. T. Chang, Anal. Chem., 2013, 85, 3263 CrossRef PubMed.
- H. Dai, C. Yang, Y. Tong, G. Xu, X. Ma, Y. Lin and G. Chen, Chem. Commun., 2012, 48, 3055 RSC.
- J. X. Shi, C. Lu, D. Yan and L. N. Ma, Biosens. Bioelectron., 2013, 45, 58 CrossRef PubMed.
- K. Qu, J. Wang, J. Ren and X. Qu, Chem.–Eur. J., 2013, 19, 7243 CrossRef PubMed.
- P. Shen and Y. Xia, Anal. Chem., 2014, 86, 5323 CrossRef PubMed.
- A. Ananthanarayanan, X. Wang, P. Routh, B. Sana, S. Lim, D.-H. Kim, K.-H. Lim, J. Li and P. Chen, Adv. Funct. Mater., 2014, 24, 3021 CrossRef.
- H. Razmi and R. Mohammad-Rezaei, Biosens. Bioelectron., 2013, 41, 498 CrossRef PubMed.
- X. L. Shao, H. Gu, Z. Wang, X. L. Chai, Y. Tian and G. Y. Shi, Anal. Chem., 2013, 85, 418 CrossRef PubMed.
- Y. Zhang, C. Wu, X. Zhou, X. Wu, Y. Yang, H. Wu, S. Guo and J. Zhang, Nanoscale, 2013, 5, 1816 RSC.
- J. Zhao, G. F. Chen, L. Zhu and G. X. Li, Electrochem. Commun., 2011, 13, 31 CrossRef.
- Q. Li, S. Zhang, L. Dai and L. S. Li, J. Am. Chem. Soc., 2012, 134, 18932 CrossRef PubMed.
- Y. Li, Y. Zhao, H. H. Cheng, Y. Hu, G. Q. Shi, L. M. Dai and L. T. Qu, J. Am. Chem. Soc., 2012, 134, 15 CrossRef PubMed.
- A. Ambrosi, C. K. Chua, A. Bonanni and M. Pumera, Chem. Rev., 2014, 114, 7150 CrossRef PubMed.
- C. Yu, J. Zhang, R. Wang and L. X. Chen, Org. Biomol. Chem., 2010, 8, 5277–5279 Search PubMed.
- D. S. Cukierman and A. B. Pinheiro, J. Inorg. Biochem., 2017, 170, 160–168 CrossRef PubMed.
- M. R. Bleackley and R. T. Macgillivray, BioMetals, 2011, 24, 785–809 CrossRef PubMed.
- X. Xu and G. T. Duan, ACS Appl. Mater. Interfaces, 2014, 6, 65–71 Search PubMed.
- D. Maity and T. Govindaraju, Chemistry, 2011, 17, 1410–1414 CrossRef PubMed.
- M. Ghaedi, F. Ahmadi and A. Shokrollahi, J. Hazard. Mater., 2007, 142, 272–278 CrossRef PubMed.
- L. L. Zhao, S. X. Zhong, K. M. Fang, Z. S. Qian and J. R. Chen, J. Hazard. Mater., 2012, 239, 206–212 CrossRef PubMed.
- W. B. Chen, X. J. Tu and X. Q. Guo, Chem. Commun., 2009, 13, 1736–1738 RSC.
- G. J. He, X. W. Zhao, X. L. Zhang, H. J. Fan, S. Wu, H. Q. Li, C. He and C. Y. Duan, New J. Chem., 2010, 34, 1055–1058 RSC.
- A. Ballesteros-Gomez, S. Rubio and D. Perez-Bendito, J. Chromatogr. A, 2009, 1216, 449–469 CrossRef PubMed.
- M. Rezaee, Y. Yamini, S. Shariati, A. Esrafili and M. Shamsipur, J. Chromatogr. A, 2009, 1216, 1511–1514 CrossRef PubMed.
- S. Xu, M. Deng, Y. Sui, Y. Zhang and F. Chen, RSC Adv., 2014, 4, 44644–44649 RSC.
- J. H. Kang, F. Kondo and Y. Katayama, Toxicology, 2006, 226, 79–89 CrossRef PubMed.
- Y. Zhuang, M. Zhou, J. Gu and X. Li, Spectrochim. Acta, Part A, 2014, 122, 153–157 CrossRef PubMed.
- X. W. Tan, Y. X. Song, R. P. Wei and G. Y. Yi, Chin. J. Anal. Chem., 2012, 40, 1409–1414 CrossRef.
- A. Motoyamal, A. Suzuki, O. Shirota and R. Namba, Rapid Commun. Mass Spectrom., 1999, 13, 2204–2208 CrossRef.
- M. K. Mudiam, R. Jain, V. K. Dua, A. K. Singh, V. P. Sharma and R. C. Murthy, Anal. Bioanal. Chem., 2011, 401, 1695–1701 CrossRef PubMed.
- V. Pichon and F. Chapuis-Hugon, Anal. Chim. Acta, 2008, 622, 48–61 CrossRef PubMed.
- Y. Wang and A. Hu, J. Mater. Chem. C, 2014, 2, 6921–6939 RSC.
- R. L. Liu, D. Q. Wu, S. H. Liu, K. Koynov, W. Knoll and Q. Li, Angew. Chem., Int. Ed., 2009, 48, 4598–4601 CrossRef PubMed.
- Y. Q. Dong, R. X. Wang, G. L. Li, C. Q. Chen, Y. W. Chi and G. N. Chen, Anal. Chem., 2012, 84, 6220–6224 CrossRef PubMed.
- Y. Z. Wang, K. Qu, L. H. Tang, Z. L. Li, E. Moore, X. Q. Zeng, Y. Liu and J. H. Li, TrAC, Trends Anal. Chem., 2014, 58, 54–70 CrossRef.
- X. H. Zhu, X. X. Zuo, R. P. Hu, X. Xiao, Y. Liang and J. M. Nan, Mater. Chem. Phys., 2014, 147, 963–967 CrossRef.
- C. Hu, C. Yu, M. Y. Li, X. N. Wang, J. Y. Yang, Z. B. Zhao, A. Eychmuller, Y. P. Sun and J. S. Qiu, Small, 2014, 10, 4926–4933 CrossRef PubMed.
- H. Kang, H. Kang, C. Jouvet, C. Dedonder-Lardeux, S. Martrenchard, G. Grégoire, C. Desfrancois, J. P. Schermann, M. Barat and J. A. Fayetonc, Phys. Chem. Chem. Phys., 2005, 7, 394–398 RSC.
Footnotes |
| † Electronic supplementary information (ESI) available. See DOI: 10.1039/c8ra03180k |
| ‡ These authors contributed to equal works. |
| This journal is © The Royal Society of Chemistry 2018 |