
 Open Access Article
 This Open Access Article is licensed under a Creative Commons Attribution-Non Commercial 3.0 Unported Licence
Perfecting band selective homo-decoupling for decoupling two signals coupled within the same band†
Ajay Vermaab,
Subrato Bhattacharyab and
Bikash Baishya *a
*a
aCentre of Biomedical Research, SGPGIMS Campus, RaeBareli Road, Lucknow-226014, U.P., India. E-mail: bikashbaishya@gmail.com; Fax: +91-522-2668215
bDepartment of Chemistry, Institute of Science, Banaras Hindu University, Banaras-221005, U.P., India
First published on 30th May 2018
Abstract
Recently, pure shift NMR methods have delivered ultrahigh resolution broadband proton NMR spectra that display singlet peak per chemical site. BASH/HOBS (band selective homo-decoupling/homonuclear band selective) decoupling is the only method that provides singlet only spectrum for a selected signal or a group of signals with a sensitivity higher than regular proton NMR, and an order of magnitude higher than broadband pure shift techniques. It is this aspect that makes this technique important. In the present work, we show that perfect echo (PE) when combined with band selective homo-decoupling (BASHD) permits increasing the bandwidth of the BASH/HOBS decoupling resulting in reduced experimental time for this class of experiments. Using new PE-BASHD technique two closely resonating coupled signals could be decoupled in a single experiment which otherwise demands two separate BASHD experiments. In polypeptides, it also allows decoupling of Hα and HN signals simultaneously from each other as well as from the side chain protons reducing experimental time. Further, pseudo 2D based PE-BASHD scheme provides spectrum superior to the real-time BASHD spectrum when applied to closely resonating coupled signals. Numerical simulation as well as experimental results indicate that the PE-BASHD sequence display good quality singlet only spectrum even in the presence of moderate strong coupling.
1. Introduction
Multidimensional NMR and high field magnet development have improved resolution greatly. Nevertheless, the complexity of the molecular systems that are investigated now a days are such that resolution of proton NMR spectra is often not adequate to reveal all the spectral information. The limited chemical shift dispersion and broad multiplet pattern in proton NMR spectrum still limits resolution to the extent that resolving peaks in crowded spectral regions often becomes a tedious task. Thus, achieving high resolution has been the focus of various NMR methodology development.In recent years, a large number of NMR methods have been developed that focus on improving the resolution via refocusing of homonuclear scalar coupling interaction which otherwise lead to the broad multiplet structure. All these methodologies are collectively coined as Pure Shift (PS) NMR methods as they produce spectrum that display singlet peak per chemical site (and hence ultrahigh-resolution).1–27 Pure shift NMR which converts multiplets to singlets via refocusing of homonuclear scalar couplings such as Zangger–Sterk (ZS) method,1–9 Bilinear Rotation Decoupling (BIRD),10–18 and PSYCHE (PS yielded by chirp excitation)23–27 produces broadband pure shift spectrum at a significant cost of sensitivity relative to regular proton NMR spectrum.
Selective methods such as BASHD (band-selective homonuclear decoupling) or HOBS (homonuclear band-selective) produces ultrahigh resolution spectrum for a signal or a group of signals in a narrow band.19–22 Even though this technique is not broadband, it offers sensitivity higher than regular proton NMR and an order of magnitude higher than the broadband pure shift techniques.
PS NMR with J-coupling information has also been developed to measure J-coupling in crowded spectral regions.28–32 Two dimensional (2D) correlation experiments such as TOCSY,6,24 NOESY,7 COSY,7 and HSQC13,15,17 have taken advantage of the ultra-high resolution available from various PS techniques such as ZS, BIRD, PSYCHE, and BASHD.
One dimensional PS proton spectrum can be recorded by utilizing either the faster real-time approach or slower data chunking technique (also called pseudo 2D). PS NMR in direct or indirect dimension along with covariance processing can also produce doubly PS 2D correlation map. Some 2D techniques incorporate PS utilizing data chunking in a pseudo 3D scheme which takes longer experimental time.14,15,33 There are also other schemes in liquid state NMR which are used to suppress the effect of homonuclear scalar couplings such as SITCOM effect34–37 and perfect echo (PE)15,38–45 based decoupling. Recently PE has been integrated with various NMR pulse schemes to improve their performance.15,40–45 The original PE scheme fully refocuses both chemical shift as well as coupling evolution in two spin systems but also works well for multiple spin systems when inter-pulse delays are kept short. Interestingly the method simply employs nonselective pulses in the sequence 90x–τ–180y–τ–90y–τ–180y–τ and J-coupling is refocused by the non-selective 90°y pulse applied at the centre of the sequence.
Recently, perfect echo has been integrated with slice selective broadband decoupling or ZS scheme to enable decoupling of spin pairs that share the same slice, or in other words closely resonating coupled signals.46 This method improves sensitivity of the ZS sequence and provides superior performance for strongly coupled spin systems. Since the ZS scheme actually performs a spatially encoded band selective homo-decoupling, by same logic, one could improve the decoupling performance of the most sensitive homo-decoupling technique-BASHD. Therefore, in the present work, we show that perfect echo can be combined with band selective homo-decoupling to increase the bandwidth of the BASHD experiment resulting in reduced experimental time for this class of experiments. The new method coined as PE-BASHD permits simultaneous decoupling of two closely resonating coupled signals using the pseudo 2D approach in a single experiment which otherwise demands two separate BASHD experiments. Whenever two coupled signals are very close in frequency, highly selective refocusing pulses are required to decouple these signals from each other. As a result two separate band selective experiments becomes necessary for observing the two homo-decoupled signals separately. It is highly desirable to decouple the two closely resonating signals in a single experiment from each other as well as from the rest of the signals. Further in a polypeptide, when a group of signals such as Hα are selectively decoupled from the rest of the signals (Hβ and HN) using BASHD, coupling within the Hα signals which occasionally exist are not refocused by BASHD. It is highly desirable to decouple the whole Hα region with the decoupling of the spins which are coupled within the Hα band in a single BASHD experiment. In order to address these issues, a new scheme that combines band-selective decoupling and perfect echo based decoupling has been developed. Below we describe this method and its applications to cyclosporine A and strychnine molecules.
2. Description of the pulse sequence
The pulse sequence for PE-BASHD scheme is shown in Fig. 1B. Fig. 1C is the schematic spectrum from a hypothetical three spin system designated as ADM with the chosen coupling network as shown. This spectrum will be used to describe how PE-BASHD pulse sequence acts on the signals A, D, and M. The signals (or spins) A and D are closely resonating and are well separated from the signal M. Due to the existence of three couplings, a doublet of doublet pattern is observed for each of the signals A, D, and M. First, we consider a regular band selective experiment as in Fig. 1A and its application to the spin system ADM. Particularly we focus on what happens when BASHD is applied on two closely resonating coupled signals. The band selective refocusing pulse bAD is applied on signals A & D and is more convenient to do so as they are close in frequency. Subsequently a spectrum will be obtained after Fourier Transform (FT) of the concatenated data chunks which will generate a spectrum with signals A and D each showing a doublet due to the un-refocused scalar coupling JAD as the selective pulse bAD cannot refocus this coupling. Thus, overall effect of the band selective pulse bAD is to mimic a two spin system in this coupled three spin system by decoupling the signal M from both A & D. Now, it is well known that PE based homo-decoupling is ideally suited for decoupling two spin systems. Therefore, a PE-BASHD pulse sequence is designed as shown in Fig. 1B which can refocus this kind of residual scalar couplings between two spins within the same band using the PE decoupling integrated with the BASHD scheme. Other option to decouple A from D & M would obviously be the application of a highly selective pulse which refocuses only one of the two signals A or D. This will require two separate BASHD experiments. Further, such a long pulse, firstly leads to faster T2 decay, and will increasingly affect the signal D the closer it becomes to signal A. In addition, there are situations in which the goal is to decouple many signals in a given region from other signals, for example, the Hα region in polypeptides like cyclosporine A. In this case, the Hα region contains an AB two-spin system (pertaining to the side-chain olefinic protons as shown in residue 1 of the cyclosporine structure in Fig. 3A) where A and B signals are coupled within the Hα band and cannot be decoupled from each other by a band selective refocusing pulse that covers the whole Hα region, although they are decoupled from the rest. The use of a highly selective pulse to decouple these two olefinic proton signals (marked with asterisk in Fig. 3A) individually will demand a highly selective pulse and more experiments. Also it should be noted that real-time BASHD approaches are not suitable when very long refocusing pulse becomes inevitable to decouple closely resonating coupled signals (severe line-broadening along with severe data-chunking artifact). In all such cases, it would be highly desirable to keep using a band selective pulse on both signals A & D and decouple the A & D J-coupling interaction using the well-known perfect echo decoupling within a pseudo 2D framework.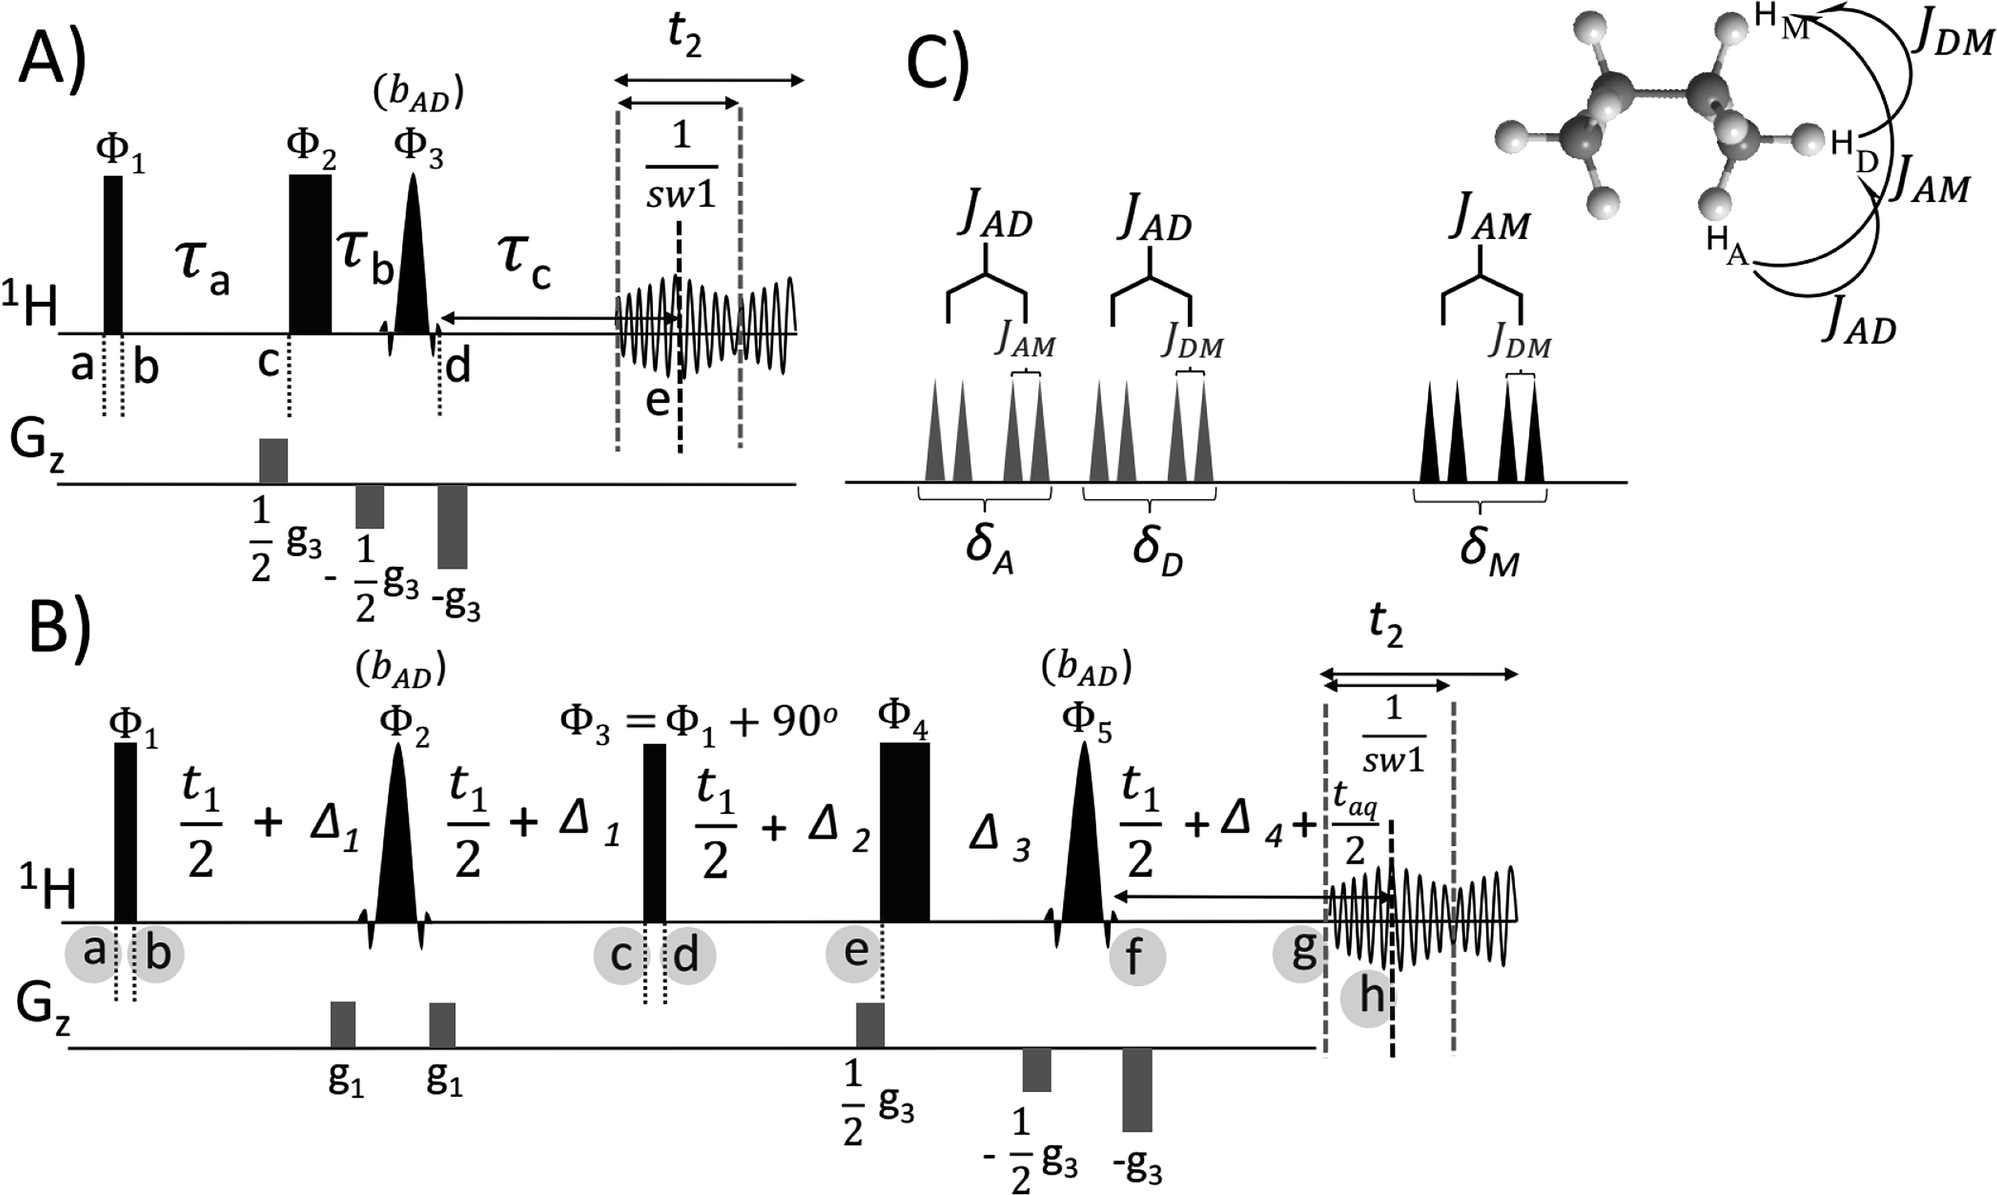 | ||
Fig. 1 (A) Pulse sequence schemes for (a) regular Band Selective Homodecoupling (BASHD), and (b) Perfect Echo based Band Selective Homodecoupling (PE-BASHD). Narrow and wide rectangles represent hard 90° and 180° pulses, respectively. Selective pulses are indicated by black shapes. In (B), the gradients G1 and G3 are used for coherence selection and a gradient amplitude ratio of 35![[thin space (1/6-em)]](https://www.rsc.org/images/entities/char_2009.gif) :90 can be used. An interferogram-based acquisition (pseudo 2D) is used and the duration of the data chunks is equal to twice the t1 increment (2SW1)−1 in the homodecoupling dimension. The delays Δ1 through Δ4 are Δ1 = (2SW1)−1 + p16 + 2d16, Δ2 = (4SW1)−1, Δ3 = (4SW1)−1 + p16 + 2d16 and Δ4 = p16 + 2d16, where p16 is the length of the gradient (800 μs) and d16 is a recovery delay (200 μs). Scalar coupling refocusing is achieved at time point ‘h’, while chemical shifts are refocused at ‘g’ of the first t1 increment. Phase cycling: Φ1 = x, −x, Φ2 = y, Φ3 = y, y, −y, −y, and Φrec = x – x for the regular BASHD in (A) and Φ1 = x, Φ2 = y, y, −x, −x, −y, −y, x, x, Φ3 = y, −y, Φ4 = Φ5 = x and Φrec = −x – x, x, x, for the PE-BASHD experiment in (B). (C) is the schematic proton spectrum from the hypothetical three spin system designated as ADM. :90 can be used. An interferogram-based acquisition (pseudo 2D) is used and the duration of the data chunks is equal to twice the t1 increment (2SW1)−1 in the homodecoupling dimension. The delays Δ1 through Δ4 are Δ1 = (2SW1)−1 + p16 + 2d16, Δ2 = (4SW1)−1, Δ3 = (4SW1)−1 + p16 + 2d16 and Δ4 = p16 + 2d16, where p16 is the length of the gradient (800 μs) and d16 is a recovery delay (200 μs). Scalar coupling refocusing is achieved at time point ‘h’, while chemical shifts are refocused at ‘g’ of the first t1 increment. Phase cycling: Φ1 = x, −x, Φ2 = y, Φ3 = y, y, −y, −y, and Φrec = x – x for the regular BASHD in (A) and Φ1 = x, Φ2 = y, y, −x, −x, −y, −y, x, x, Φ3 = y, −y, Φ4 = Φ5 = x and Φrec = −x – x, x, x, for the PE-BASHD experiment in (B). (C) is the schematic proton spectrum from the hypothetical three spin system designated as ADM. | ||
The PE-BASHD pulse sequence of Fig. 1B is analogous to the perfect echo sequence, but the non-selective refocusing pulses are now replaced with band selective pulses bAD which refocuses signals A & D simultaneously but does not interact with signal M. This pulse sequence is also very similar to the PEPSIE sequence except the slice encoding gradients are switched off in PE-BASHD. Scalar couplings to signal M is refocused by these band selective pulses bAD at the centre of the data chunk i.e. time point ‘h’. The coupling JAD which evolves from time point ‘b’ to ‘c’ is now refocused between time point ‘d’ to ‘h’ by the J-refocusing non-selective 90° pulse (applied between time point ‘c’ and ‘d’) which exchanges the antiphase states of A & D (detail of product operator calculation in ESI†). Chemical shift evolution can now be carried out, but only between time intervals ‘d’ and ‘h’ by introducing a non-selective refocusing pulse immediately preceding the band selective pulse bAD (just after time point ‘e’). The PE-BASHD scheme is compatible with only the pseudo 2D mode of acquisition.
3. Results and discussion
3.1 Application to strychnine
A three spin system akin to that described in the pulse sequence section can be found in the strychnine molecule shown in Fig. 2. The signals H22, H23a and H23b forms this spin system. Therefore, PE-BASHD and BASHD experiments were carried out for the two closely resonating signals at 4.08 (H23b) and 4.16 (H23a) ppm, each showing a dd multiplet pattern (see proton NMR in Fig. 2g) in regular proton spectrum with an intensity pattern that of a moderately strongly coupled spin pair (J/Δν = 13 Hz/32 Hz = 2.5).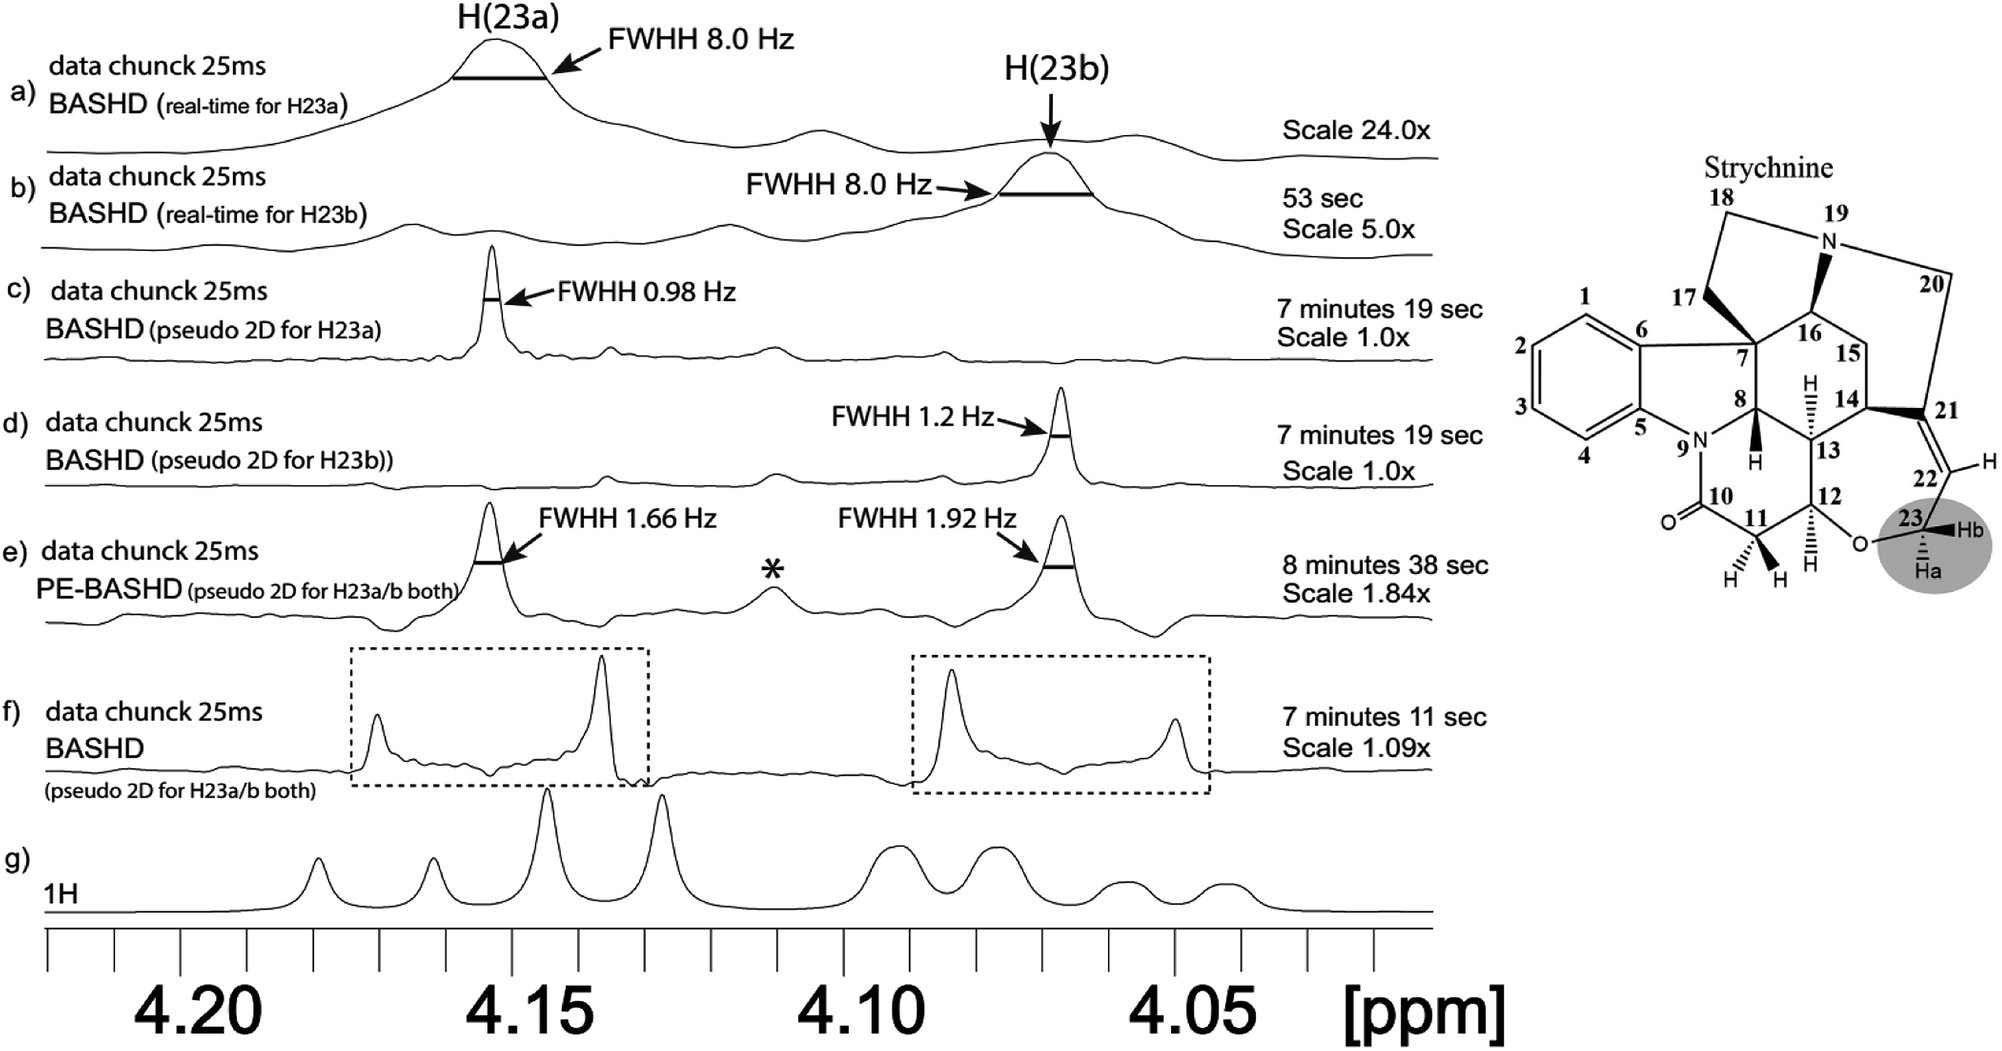 | ||
| Fig. 2 (a) Real-time 1D BASHD spectrum for signal H23a, (b) real-time 1D BASHD spectrum for signal H23b, (c) BASHD (pseudo 2D) spectrum for signal H23a, (d) BASHD spectrum (pseudo 2D) for signal H23b, (e) PE-BASHD spectrum for both signals H23a and H23b simultaneously, (f) BASHD spectrum for both signals H23a and H23b simultaneously, (g) regular proton NMR spectrum with 4 scan. The data chunk duration was 25 ms for all the experiments. The total FID acquisition time were 400 ms (a and b), 500 ms (c–f), 1.5 s (g) respectively. Total experimental time were 53 seconds for (a and b), 7 minutes on average for (c–f). The BASHD spectra (a–d) use refocusing RSnob pulse of duration 84 ms while (e) (PE-BASHD) and (f) (BASHD) requires 37.7 ms RSnob pulse. | ||
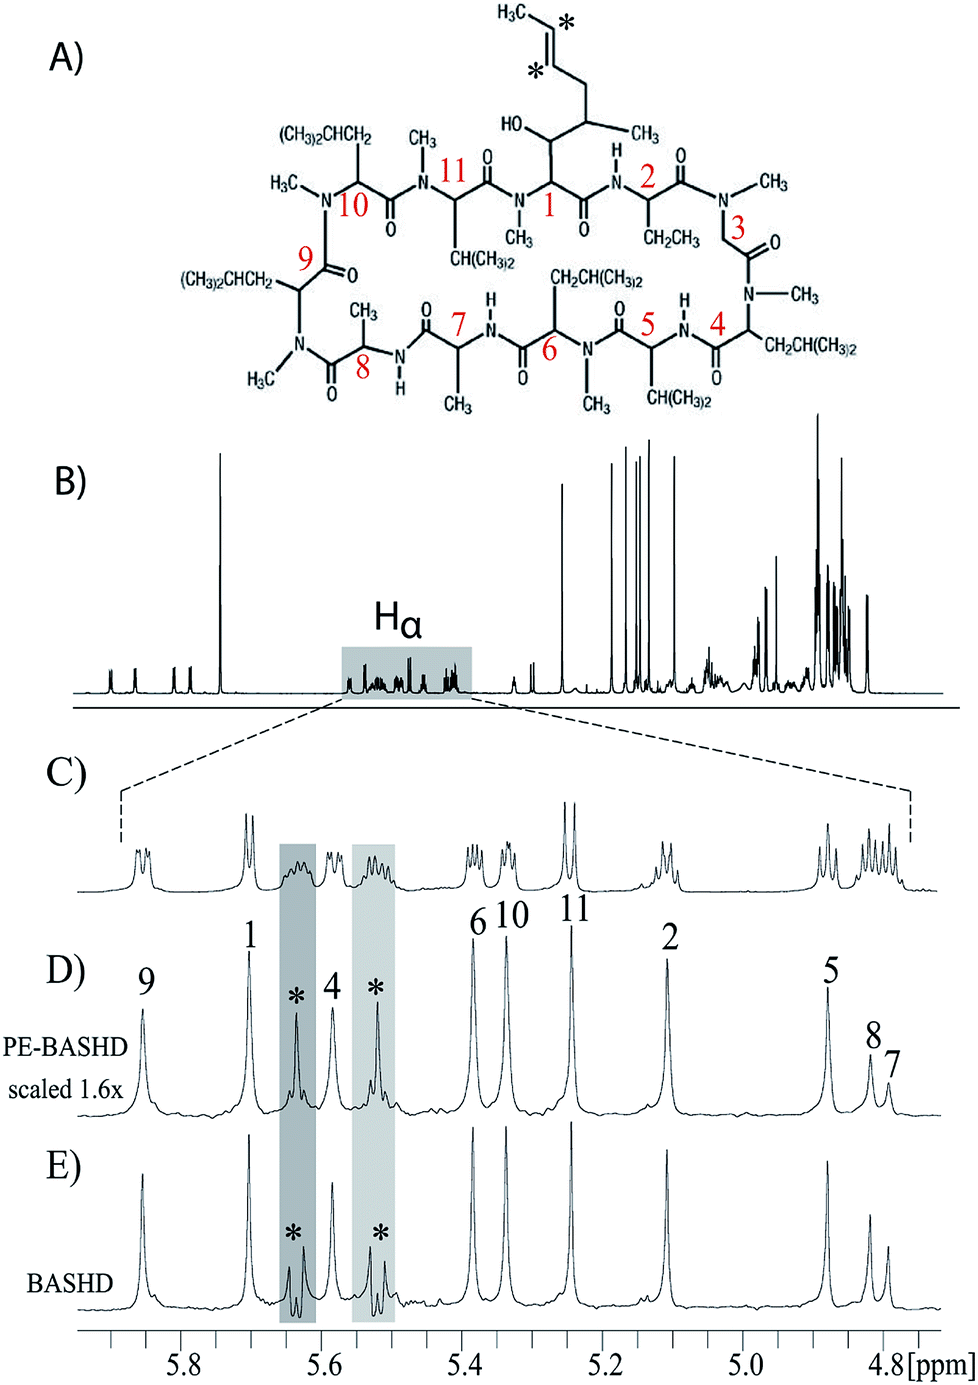 | ||
| Fig. 3 (A) shows the structure of cyclosporine A along with the numbering of the amino acid residues. (B) is the regular proton spectrum of cyclosporine A. (C) display the expanded view of the Hα signals. (D) and (E) are the PE-BASHD and BASHD spectra of the Hα region respectively. In BASHD proton spectrum (E), singlet peaks for all the Hα signals are observed except the signals marked with asterisk, the two olefinic proton signals from residue 1 are scalar coupled and appear as doublet. These signals are present within the Hα band. The PE-BASHD proton spectrum in (D) demonstrates that these olefinic proton signals are effectively decoupled and display singlet peak. | ||
Initially the BASHD and PE-BASHD spectra were recorded (in pseudo 2D mode) to simultaneously decouple these two signals (H23a and H23b) from rest of the signals as well as from each other i.e. the selective refocusing pulse (37.7 ms) had a bandwidth that covers both of these signals H23a/b. PE-BASHD spectrum in Fig. 2e displays singlet for each of these two signals while the BASHD spectrum in Fig. 2f shows the doublet pattern instead of the dd pattern in the regular proton NMR (Fig. 2g). In other words BASHD scheme decouples only the passive couplings to the third signal at 5.9 ppm (H22) and does not refocus the active coupling between H23a and H23b. In contrast the PE-BASHD spectrum refocuses the active as well as passive coupling simultaneously. The results indicated better efficiency of PE-BASHD than BASHD for decoupling two scalar coupled signals simultaneously from each other as well as from the rest of the signals in a single experiment.
Separate real-time BASHD experiment that selectively refocuses signal H23a or H23b were also performed (this required longer pulse of duration 84 ms as they are closely resonating) and spectra are displayed in Fig. 2a and b which showed significant amount of line broadening (FWHH 8 Hz) and artefact due to the necessity of multiple longer selective pulses for real-time acquisition (compare Fig. 2e vs. 2a & 2e vs. 2b).
However, when pseudo 2D based BASHD experiment is performed for each of these two closely resonating signals separately, showed significant decoupling efficiency (singlet with 0.98 Hz FWHH), no chunking artifact, and also sensitivity nearly two times the PE-BASHD (compare Fig. 2e vs. 2c & 2e vs. 2d). Thus BASHD experiment could decouple the two signals in two separate experiments in real-time as well as pseudo 2D mode. However, only pseudo 2D mode spectra were of good quality in this case. The PE-BASHD spectrum accomplished this task in a single pseudo 2D experiment.
The sensitivity of real-time BASHD experiment will be higher than pseudo 2D if carried out for same amount of experimental time (Fig. 2b vs. 2d or 2b vs. 2e). In other words, Fig. 2b (recorded in 53 seconds) has a signal intensity which is 5 times less than Fig. 2d or 2e (recorded for 7 minutes). Had Fig. 2b been carried out for 7 minutes it would have higher signal intensity. However, the line-broadening (8 Hz in Fig. 2a and b) in real-time mode spectra removes the desired objective of homo-decoupling (the goal of which was line narrowing by replacing the broad multiplets by singlets). The real time method works well when refocusing pulses between the data chunks are of small duration relative to the duration of one data chunk. However, when refocusing pulse gets longer, its advantages are outweighed by line broadening and chunking artefact as demonstrated in Fig. 2a and b (84 ms pulse vs. 25 ms data chunk duration).
Comparison of pseudo 2D based BASHD spectrum of Fig. 2d vs. PE-BASHD spectrum in Fig. 2e indicates that the baseline is distorted near the two singlets in the PE-BASHD spectrum which is a consequence of the deviations from the perfect echo property. This aspect will be further clarified with numerical simulations at the end of the results and discussion.
In overall, the PE-BASHD experiment can decouple two coupled signals within the same band. This relaxes the stringent condition of studying one signal at a time in BASHD experiment to at least two signals simultaneously when integrated with the perfect echo. Thus, shorter pulses can be used for homo-decoupling in PE-BASHD scheme relative to the regular BASHD scheme. The PE-BASHD sequence is two times longer than the BASHD sequence (Fig. 1A vs. 1B) and this results in broader lines in PE-BASHD spectrum due to longer transverse relaxation of the signals. Comparison of Fig. 2e vs. 2d & 2e vs. 2c reveals slightly lower sensitivity of the signals present in PE-BASHD spectrum (scaled 1.84×) relative to BASHD spectrum. Also the FWHH of PE-BASHD signals are 1.66 Hz and 1.92 Hz respectively (Fig. 2e) when compared to the FWHH of 0.98 Hz and 1.2 Hz of the BASHD spectra respectively (Fig. 2c and d). It should be noted that perfect echo refocuses homonuclear scalar couplings via exchange of the antiphase magnetizations. A product operator calculation (SI Section 1.3†) reveals that decay rate of the refocused in-phase magnetization of each signal is determined by its own in-phase transverse relaxation rate and also by the faster antiphase relaxation rate of the its coupled neighbour. Thus an averaging of relaxation rates occurs. In summary, PE-BASHD spectrum displays that combined effect of perfect echo and BASHD can be exploited to decouple any two closely resonating coupled signals within the same band.
3.2 Application to cyclosporine A
The performance of the PE-BASHD experiment was also evaluated on a cyclosporine A (CsA) sample which is an 11 residue cyclic undecapeptide. Peptides and small proteins are suitable targets for evaluating the performance of band-selective experiments because of the well separated regions of the signals HN, Hα or aliphatic side chain protons i.e. Hβ, Hγ.Fig. 3A shows the structure of CsA along with the numbering of the amino acid residues. Fig. 3B is the regular proton spectrum of CsA, and Fig. 3C is the expanded view of the Hα signals. Fig. 3D and E are the PE-BASHD and BASHD proton spectra of the Hα region respectively obtained by pseudo 2D scheme of acquisition.
Although regular BASHD proton spectrum for the whole Hα region produces singlet peak for most of the Hα signals 1 to 11, the two olefinic proton signals marked with asterisk from residue 1 are coupled within the Hα band and display doublet pattern shown as star marked in Fig. 3E. These signals are very effectively decoupled in the PE-BASHD proton spectrum in Fig. 3D and display singlet peak for each of the olefinic protons. Thus, the PE-BASHD experiment can decouple two coupled signals within the same Hα band. Comparison of Fig. 3D and E reveals slightly lower sensitivity of the signals present in PE-BASHD spectrum relative to BASHD spectrum. In overall, PE-BASHD spectrum displays that combined effect of PE and BASHD can be exploited to decouple any two coupled signals such as olefinic protons within the same band i.e. the Hα region.
This implies that one could use a broader band selective refocusing pulse on the HN and Hα signals simultaneously to decouple them from the side chain protons. This is feasible due to the distinct and well separated spectral regions of HN, Hα and side chain protons. The residual scalar coupling between the HN and Hα signals can then be refocused by the perfect echo scheme as already mentioned.
With the help of such a strategy two separate band selective experiment aimed at homo-decoupling individually the HN and Hα signals can now be replaced by a single band selective experiment. This strategy reduces experimental time by a factor of two.
Fig. 4 illustrates BASHD and PE-BASHD spectra obtained by using refocusing pulses that are simultaneously applied on HN and Hα. The BASHD spectrum in Fig. 4A displays the doublet pattern for HN and Hα signals marked as 2, 7, 8 and 5 in addition to the coupled olefinic proton signals. This is a consequence of the residual 3JHN–Hα couplings between HN and Hα in addition to the couplings within the olefinic protons. The Hα signals 2, 7, 8 and 5 in Fig. 4A can also be compared to the portion of their regular proton NMR shown with a small box above. This reveals that multiplet pattern for each of these signals are now replaced by a doublet as the effect of scalar couplings to side chain protons are now refocused rendering them effectively behave as two spin systems-suitable for decoupling by perfect echo.
 | ||
| Fig. 4 (A) shows the BASHD (pseudo 2D based) spectrum obtained by using a broad refocusing pulse that simultaneously refocuses HN and Hα signals. (B) shows the PE-BASHD (pseudo 2D based) spectrum for the same signals using the same broad refocusing pulse. Doublet pattern for the HN and Hα signals marked as 2, 7, 8, and 5 are evident in (A) due to the presence of residual 3JHN–Hα couplings between HN and Hα signals, although coupling to the side chain protons are refocused. In contrast the PE-BASHD spectrum display singlet peaks for all of these signals due to the effect of the perfect echo based decoupling which refocuses the residual 3JHN–Hα couplings. | ||
Thus, the band selective refocusing pulse that is simultaneously applied on both HN and Hα signals has the overall effect of mimicking a coherence evolution that is akin to two spin systems for all of these ten signals. This is simply accomplished by decoupling these signals from the rest of the side chain proton signals via band selective decoupling. Now, the perfect echo decoupling which is effective along with the BASHD in PE-BASHD scheme further refocuses the 3JHN–Hα residual scalar couplings for these ten signals simultaneously. This results in the PE-BASHD spectrum which display singlet peak per chemical site simultaneously for all the HN and Hα signals in a single band selective homo-decoupling experiment. Due to longer transverse relaxation of the PE-BASHD experiment, signals 9, 1, 6, 10, and 11 in Fig. 4B display on average 40% less sensitivity than 4A which is also demonstrated in Fig. 3D vs. 3E.
3.3 Investigation of strong coupling behaviour using numerical simulation
Since the PE-BASHD pulse sequence is designed for decoupling two signals coupled within the same band, it will be worthwhile to consider the effect of increasing strong coupling on the efficiency of refocusing of in-phase signals by perfect echo property. In the PE-BASHD pulse sequence, the band-selective decoupling is targeted at refocusing the passive couplings i.e. the coupling of the two active spins (inside the band) with passive spins which are outside the band. For refocusing the active couplings, the crucial role is played by the perfect echo based refocusing of in-phase signals via exchange of the antiphase coherences. This aspect of the perfect echo is well documented in the literature for the weakly coupled case. Here we evaluate the refocusing property for increasing strong coupling effect. Further the recent PEPSIE sequence has also been analysed comprehensively for the weak as well as strong coupling cases using product operator as well as density matrix calculations. These calculations were done under the assumption that for a two spin system (AX and AB) the slice selection gradient can be turned off, under which condition our PE-BASHD sequence also becomes identical to PEPSIE sequence. Therefore, the calculations necessary for the PE-BASHD sequence are identical to those that has been already performed and reported by J. Ilgen et al.46 for the PEPSIE sequence, and hence we refer to their work for getting an insight into the effect of strong coupling on the PEPSIE and hence also on the PE-BASHD sequence.In the present work, we show the results of numerical simulation using the full Hamiltonian and the full propagator for a two spin system AX for various cases of Δν/J (ratio of chemical shift difference and homonuclear J-coupling constants) values ranging from weakly coupled to strongly coupled case for the perfect echo sequence (detailed in ESI†). Since in a strongly coupled system, the refocusing pulses lead to coherence transfer between the coupled signals, this will add more complexity to the exchange of antiphase coherences. Thus, there are multiple coherence transfer feasible in the perfect echo sequence due to the presence of two refocusing pulses separated by a 90° pulse.
The idea is to see the effect of strong coupling on the perfect echo which is the heart of the PE-BASHD sequence as well as the PEPSIE sequence. In order to gain insight into the complex spin dynamics as the spin system transits from a weakly coupled case (AX) to a strongly coupled case (AB) we simulated the modulation of IY SQ (Single Quantum) coherence of spin A as a function of the delay τ for the different Δν/J values for the (1) perfect echo sequence as shown in Fig. S2A,† and (2) double spin echo sequence as shown in Fig. S2B.†
We predict that in the regime Δν ≫ J the double spin echo (DSE) will lead to modulation of the IY SQ coherence as the spin echo does not refocus the homonuclear scalar coupling J. But for the perfect echo sequence IY SQ coherence will not show any modulation due to the refocusing of the scalar coupling as is also confirmed from various experimental results in many publications. Again when Δν = 0, the behaviour of the two sequence will be same as the strong coupling Hamiltonian commutes with the coherence in such a case and hence no modulation of the IY SQ coherence is expected. Then we will look into the intermediate regime where Δν is comparable to J.
(a) In Fig. 5a, for Δν/J = 87.7 the spin system AX is a weakly coupled system. The thin blue curve is the modulation of the in-phase SQ coherence IY of spin A as a function of the interval τ in the double spin echo sequence [π/2x–τ–πy–τ–τ–πy–τ]. The blue curve indicates that IY is modulated by homonuclear scalar coupling J, as the simple spin echo does not refocus the effect of homonuclear scalar couplings. In contrast, in-phase SQ coherence IY when plotted as a function of the interval τ in the perfect echo sequence [π/2x–τ–πy–τ–π/2y–τ–πy–τ] does not display any modulation as indicated by the red curve in the same plot 5a. The red curve is completely flat and does not deviate from the normalized magnitude −1. This confirms that perfect echo sequence refocuses the effect of homonuclear scalar couplings for Δν/J = 87.7.
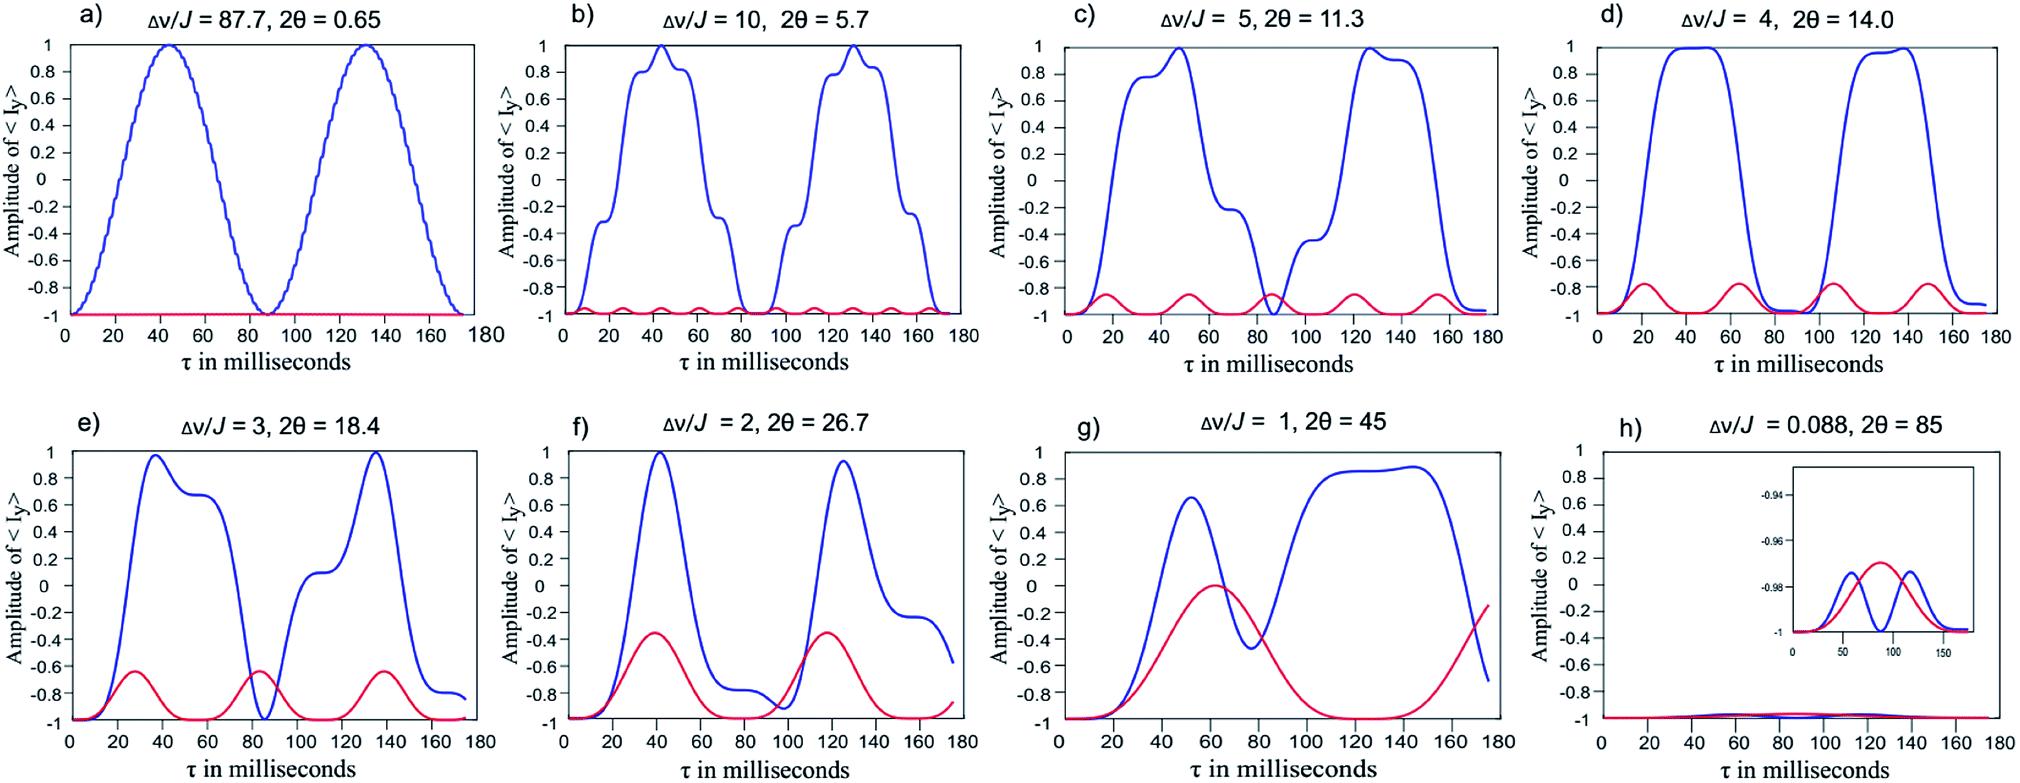 | ||
| Fig. 5 Plot of the amplitude of desired in-phase single quantum coherence vs. delay (tau) in milliseconds. Blue line represents double spin echo [π/2x–τ–πy–τ–τ–πy–τ] while red line corresponds to perfect echo sequence [π/2x–τ–πy–τ–π/2y–τ–πy–τ] (ESI Fig. S2a and b†). | ||
(b) In Fig. 5b, Δν/J = 10, the spin system AX is still weakly coupled. The thin blue curve is the modulation of the in-phase SQ coherence IY of spin A as a function of the interval τ in the double spin echo sequence. The IY coherence remains modulated by homonuclear scalar coupling J, although the modulation pattern is slightly different from the previous case as in (a).
In contrast IY coherence in the perfect echo sequence does not display any modulation as is indicated by the red curve in the same plot 5b. But the red curve is not completely flat as in case (a), the magnitude of IY coherence shows a very small fluctuation between −0.97 and −1 which is periodic in nature as is visible from the baseline. In overall the perfect echo sequence refocuses the effect of homonuclear scalar couplings effectively.
(c) In Fig. 5c, Δν/J = 5, the thin blue curve shows that IY coherence of spin A remains modulated in the double spin echo sequence. In contrast, IY coherence in the perfect echo sequence does not display any significant modulation as is indicated by the red curve in the same plot 5c. The amplitude of the minor modulations however increases compared to case (b). In other words the modulation of IY was restricted between −0.97 and −1 for Δν/J = 10; which now increases and varies between −0.85 to −1 for Δν/J = 5. In overall the perfect echo sequence refocuses the effect of homonuclear scalar couplings to a great extent in this case as well.
(d) Comparison of Fig. 5d–g for increasing strong coupling Δν/J values of 4, 3, 2, 1 reveals that the in-phase SQ coherence IY of spin A remains modulated in the double echo sequence (blue curves). More importantly, the IY coherence in the perfect echo sequence (the red curves) also displays an increasing amplitude of modulation with increasing strong coupling Δν/J values of 4, 3, 2, and 1. For Δν/J values of 2 (in Fig. 5f) the decrease in the amplitude of IY in-phase coherence is as low as −0.4. This implies some portion of the in-phase magnetization gets converted to other type of coherences which have different properties and hence leads to baseline distortions.
Due to this modulation of IY coherence the spectrum will deviate from the simple singlet only peaks. It is to be noted that there is a sharp increase in the modulation of IY coherence as Δν/J values becomes smaller than 4. This is in agreement with the calculations performed and reported by J. Ilgen et al.46
(e) Finally for strong coupling Δν/J values of 0.087 in Fig. 5h, the spin system approaches an A2 system. Consequently neither double spin echo nor perfect echo sequence shows any modulation of IY in-phase coherence as displayed by the blue and red curves staying close to the baseline and maintaining an amplitude which is close to −1 for all range of τ delays.
3.4 Experimental evaluation of the effect of strong coupling on the PE-BASHD sequence
Experimental as well as simulated PE-BASHD spectra were obtained from a strongly coupled AB system in 2,3-dibromothiophene to systematically investigate the effect of strong coupling. The two protons in this molecule show a temperature dependent chemical shift difference for a fixed ratio of the chosen solvent mixtures of benzene-d6 and chloroform-d1.Just by changing temperature in steps of 5 K from 300 K to 255 K, different coupling regimes can be created for this two spin system. Although the sample chosen is the same as that used by J. Ilgen et al.46 for investigating the effect of strong coupling on the PEPSIE sequence, however, in the present work we performed the PE-BASHD experiment on the two coupled signals for different regimes of coupling (from weak to strong coupling) induced by temperature variation.
Fig. 6a and b display the series of experimental and simulated PE-BASHD spectra for temperatures in the range from 300 K to 255 K in steps of 5 K recorded at 400 MHz NMR Spectrometer.
 | ||
| Fig. 6 (a) Simulated spectra of 2,3-dibromothiophene in a 5:4 mixture of C6D6:CDCl3 solvent as a function of temperature range from 300 K to 255 K, (b) experimental spectra. Both spectra were acquired with the same parameters. | ||
The simulated spectra were obtained by using the NMRSIM program in Bruker Topspin 3.2. The degree of strong coupling are indicated by the ratio of shift difference and coupling constants as well as the strong coupling parameter 2θ47 alongside the various temperatures mentioned. A 9.5 ms long RSnob pulse with 247 Hz bandwidth was used for refocusing the two proton signals in 2,3-dibromothiophene in the PE-BASHD sequence. Upto a value of Δν/J = 2.9 (2θ = 19°), the PEBASHD sequence display good spectra and absence of strong coupling artifact implying homonuclear decoupling in PE-BASHD scheme works well even in the presence of moderate strong coupling. For Δν/J values smaller than 2.9 obtained by further lowering of temperature, an artifact signal between the singlets becomes prominent increasing sharply in intensity relative to the outer lines. In fact for Δν/J = 0.7 (2θ = 35.2°) the central line is much higher in intensity than the outer lines. This is actually a consequence of the spin system finally converging towards an A2 system which shows singlet peak. Further, simulation also predicts that (Fig. 5h) for Δν/J = 0.1, the IY coherence or echo is no longer modulated implying that strong coupling scalar coupling Hamiltonian commutes with the coherence for the chemical equivalence case.
4. Conclusions
We have successfully demonstrated that new PE-BASHD pulse scheme allows observation of fully homo-decoupled band selective spectrum from two signals which are coupled to each other as well as to any other third signal(s) in a single band selective experiment. In other words, BASHD scheme refocuses only passive coupling (i.e. coupling between observed signal and decoupled signals) while PEBASHD scheme refocuses passive coupling as well as active coupling (coupling between two observed signals within the same band) as demonstrated in strychnine molecule. Experiments on cyclosporine A also demonstrated that one could simultaneously decouple Hα and HN from each other as well as from side chain protons in a single experiment reducing the need to perform two separate band selective experiments. Further the olefinic proton signals within the Hα band could also be decoupled from each other as well as from the rest of the signals simultaneously. Thus, increasing the bandwidth of selective refocusing pulses is feasible in PE-BASHD experiment to select any two coupled signals together. For closely resonating coupled signals, BASHD scheme will demand narrower bandwidth or longer pulses to decouple each signal separately in two experiments. Although real-time BASHD will have much higher sensitivity, it will lead to unrealistic line broadening and artifact for closely resonating signals when performed individually as is demonstrated for the strychnine. Excess line broadening removes the benefit of homo-decoupling. When we compare the pseudo 2D mode spectra of BASHD and PE-BASHD, due to longer transverse relaxation in PE-BASHD sequence, it displays slightly lower sensitivity than BASHD. Considering higher sensitivity of BASHD spectra relative to regular proton spectra, the current sensitivity of PE-BASHD spectra is much superior to conventional broadband PS spectra such as ZS, PSYCHE, and BIRD and hence will be very useful for low concentration sample. Simulation results performed on a two spin system indicated that in-phase magnetization remains unmodulated upto a Δν/J value of 4. For smaller values in the range of 3 to 1, the modulation sharply rises but in the limit of Δν ≪ J the modulation of the inphase magnetization disappears converging towards the chemically equivalent system. We have also demonstrated experimentally on 2,3-dibromothiophene that upto a Δν/J value of 2.9 (2θ = 19°), the PE-BASHD spectrum remains free from artifact except a very weakly distorted baseline. Mixing of the relaxation rates between the coupled signals and hence their contribution to line width are also addressed through a product operator formalism in the ESI.†5. Experimental
5.1 Experiments on strychnine
All experiments on strychnine (10 mg in 550 μL CDCl3) were recorded in a 400 MHz NMR spectrometer equipped with a BBFO probe with z-axis gradient only at 298 K of temperature. For all experiments in Fig. 2a–d, for signals H23a/b separately RSnob refocusing pulse of 84 ms was optimized. For same signals in Fig. 2e and f respectively, RSnob refocusing pulse of 37.7 ms was optimized. All spectra were scaled w.r.t. Fig. 2c and d which are scaled to 1. Real-time BASHD spectra in Fig. 2a and b were acquired with acquisition times of 400 ms for 4 transients. Data points were set to 2478. Spectral width was set to (3099 Hz) 7.7 ppm. Recycle delay was 1.5 seconds for all the spectra in Fig. 2.For BASHD spectra in pseudo 2D mode in Fig. 2c and d, SW and SW1 were set to 3099 Hz, and 40 Hz (data chunk 25 ms) in F2 and F1 respectively. Carrier frequency was set at 4.15 ppm (H23a) for Fig. 2c, and 4.06 ppm (H23a) for Fig. 2d. TD and TD1 were set to 2548, and 40 respectively. Spectrum were acquired with t2 and t1 acquisition times of 411 ms and 500 ms respectively with 4 transients per t1 increment for a total of 40 increments. FID resolution was 2.43 Hz in F2 and 2.00 Hz in F1 dimensions, respectively. All spectra were processed with zero filled to 4 K and 128 data points prior to Fourier transformations in F2 and F1 dimension respectively.
For PE-BASHD and BASHD spectra in Fig. 2e and f, all the acquisition parameters were kept same as in Fig. 2c and d. The transmitter frequency was set at the center of the two separate multiplets (H23a/b), i.e. at 4.11 ppm. In Fig. 2e strong coupling artifact is generated at the centre of the two peaks which is marked with asterisk. In Fig. 2f, doublets signals for each geminal protons (H23a, and H23b) are present because of mutual couplings between the geminal protons (H23a/b) which is marked with dotted rectangle.
In Fig. 2g, section from regular 1D proton NMR spectrum is displayed which is acquired for 4 scans in 10 seconds.
5.2 Experiments on cyclosporine A
All experiments for Fig. 3 and 4 were recorded on 800 MHz NMR spectrometer equipped with CPTCI cryoprobe and only z-axis gradient at 298 K temperature. For Fig. 3 and 4, 50 mM cyclosporine A in benzene-d6 is used. For Hα region signals, ReBurp pulse of 5.5 ms with 1.2 kHz bandwidth was used. All the spectra in Fig. 3D and 3E were acquired with t2 and t1 acquisition times of 350 ms and 500 ms in F2 and F1 respectively with 4 transients per t1 increment for a total of 80 increments, TD and TD1 were set to 5608, and 80 respectively. Recycle delay was 1.5 seconds. SW and SW1 were set to 8 kHz, and 80 Hz (data chunk 12.5 ms) in F2 and F1 respectively. Carrier frequency was set at 5.36 ppm. FID resolution was 1.42 Hz in F2 and 1.00 Hz in F1 dimensions, respectively. Data chunk duration was 12.5 ms (as SW1 is 80 Hz). Both spectra were processed with zero filled to 8 K and 256 data points in F2 and F1 dimension respectively with unshifted sine bell (SSB = 0) window function and line broadening of 0.3 Hz. Total experimental time to record the pseudo 2D data set for Fig. 3D was 15 minutes and 38 seconds, and for Fig. 3E was 12 minute 53 seconds.For both Hα and amide region signals in Fig. 4A and B, ReBurp pulse of 1.55 ms with 4.0 kHz bandwidth was used. All the acquisition and processing parameters for the Hα and HN region protons were kept same as in Fig. 3C and 3D. Carrier frequency was set at 6.51 ppm. Total experimental time to record the spectra in Fig. 4B was 13 minutes, and in Fig. 4C was 15 minutes and 44 seconds.
Conflicts of interest
There are no conflicts to declare.Acknowledgements
We thank SERB (DST) as this work was supported by extramural research fund provided by Science and Engineering Research Board under the Department of Science & Technology, Govt. Of India (Grant No. SERB/F/6435/2015-16). Ajay Verma thanks Council of Scientific and Industrial Research (CSIR), India, for research fellowship. We thank Julian Ilgen for their support and fruitful discussion for NMR simulation. We thank the Director, CBMR, Lucknow for research facilities.Notes and references
- K. Zangger and H. Sterk, J. Magn. Reson., 1997, 124, 486–489 CrossRef.
- N. H. Meyer and K. Zangger, Angew. Chem., Int. Ed., 2013, 52, 7143–7146 CrossRef PubMed.
- J. A. Aguilar, S. Faulkner, M. Nilsson and G. A. Morris, Angew. Chem., Int. Ed., 2010, 49, 3901–3903 CrossRef PubMed.
- P. Sakhaii, B. Haase, W. Bermel, R. Kerssebaum, G. E. Wagner and K. Zangger, J. Magn. Reson., 2013, 233, 92–95 CrossRef PubMed.
- S. Glanzer, E. Schrank and K. Zangger, J. Magn. Reson., 2013, 232, 1–6 CrossRef PubMed.
- G. A. Morris, J. A. Aguilar, R. Evans, S. Haiber and M. Nilsson, J. Am. Chem. Soc., 2010, 132, 12770–12772 CrossRef PubMed.
- J. A. Aguilar, A. A. Colbourne, J. Cassani, M. Nilsson and G. A. Morris, Angew. Chem., Int. Ed., 2012, 51, 6460–6463 CrossRef PubMed.
- K. Zangger, Prog. Nucl. Magn. Reson. Spectrosc., 2015, 86–87, 1–20 CrossRef PubMed.
- L. Castanar and T. Parella, Magn. Reson. Chem., 2015, 53, 399–426 CrossRef PubMed.
- J. P. Garbow, D. P. Weitekamp and A. Pines, Chem. Phys. Lett., 2015, 93, 504–509 CrossRef.
- A. Bax, J. Magn. Reson., 1983, 53, 517–520 Search PubMed.
- D. Uhrín, T. Liptaj and K. E. Kövér, J. Magn. Reson., 1993, 101, 41–46 CrossRef.
- J. A. Aguilar, M. Nilsson and G. A. Morris, Angew. Chem., Int. Ed., 2011, 50, 9716–9717 CrossRef PubMed.
- T. Reinsperger and B. Luy, J. Magn. Reson., 2014, 239, 110–120 CrossRef PubMed.
- L. Kaltschnee, A. Kolmer, I. Timári, V. Schmidts, R. W. Adams, M. Nilsson, K. E. Kövér, G. A. Morris and C. M. Thiele, Chem. Commun., 2014, 50, 15702–15705 RSC.
- A. Lupulescu, G. L. Olsen and L. Frydman, J. Magn. Reson., 2012, 218, 141–146 CrossRef PubMed.
- L. Paudel, R. W. Adams, P. Király, J. A. Aguilar, M. Foroozandeh, M. J. Cliff, M. Nilsson, P. Sándor, J. P. Waltho and G. A. Morris, Angew. Chem., Int. Ed., 2013, 52, 11616–11619 CrossRef PubMed.
- A. Verma and B. Baishya, J. Magn. Reson., 2016, 266, 51–58 CrossRef PubMed.
- L. Castañar, P. Nolis, A. Virgili and T. Parella, Chem.–Eur. J., 2013, 19, 17283–17286 CrossRef PubMed.
- J. Ying, J. Roche and A. Bax, J. Magn. Reson., 2014, 241, 97–102 CrossRef PubMed.
- L. Castañar, J. Saurí, P. Nolis, A. Virgili and T. Parella, J. Magn. Reson., 2014, 238, 63–69 CrossRef PubMed.
- A. Verma and B. Baishya, ChemPhysChem, 2015, 16, 2687–2691 CrossRef PubMed.
- M. Foroozandeh, R. W. Adams, M. Nilsson and G. A. Morris, Angew. Chem., Int. Ed., 2014, 53, 6990–6992 CrossRef PubMed.
- M. Foroozandeh, R. W. Adams, M. Nilsson and G. A. Morris, J. Am. Chem. Soc., 2014, 136, 11867–11869 CrossRef PubMed.
- V. M. R. Kakita and R. V. Hosur, ChemPhysChem, 2016, 17, 2304–2308 CrossRef PubMed.
- V. M. R. Kakita, S. P. Vemulapalli and J. Bharatm, Magn. Reson. Chem., 2016, 54, 308–314 CrossRef PubMed.
- V. M. R. Kakita, K. Rachineni and R. V. Hosur, Magn. Reson. Chem., 2017 DOI:10.1002/mrc.4635.
- N. Giraud, L. Béguin, J. Courtieu and D. Merlet, Angew. Chem., Int. Ed., 2010, 49, 3481–3484 CrossRef PubMed.
- M. Foroozandeh, R. W. Adams, P. Kiraly, M. Nilsson and G. A. Morris, Chem. Commun., 2015, 51, 15410–15413 RSC.
- D. Sinnaeve, M. Foroozandeh, M. Nilsson and G. A. Morris, Angew. Chem., Int. Ed., 2016, 128, 1102–1105 CrossRef.
- P. Kiraly, M. Foroozandeh, M. Nilsson and G. A. Morris, Chem. Phys. Lett., 2017, 683, 398–403 CrossRef.
- J. E. H. Pucheta, D. Pitoux, C. M. Grison, S. Robin, D. Merlet, D. J. Aitken, N. Giraud and J. Farjon, Chem. Commun., 2015, 51, 7939–7942 RSC.
- I. Timári, L. Kaltschnee, A. Kolmer, R. W. Adams, M. Nilsson, C. M. Thiele, G. A. Morris and K. E. Kövér, J. Magn. Reson., 2014, 239, 130–138 CrossRef PubMed.
- J. Dittmer and G. Bodenhausen, ChemPhysChem, 2006, 7, 831–836 CrossRef PubMed.
- B. Baishya, T. F. Segawa and G. Bodenhausen, J. Am. Chem. Soc., 2009, 131, 17538–17539 CrossRef PubMed.
- T. F. Segawa, B. Baishya and G. Bodenhausen, ChemPhysChem, 2010, 11, 3343–3354 CrossRef PubMed.
- D. Carnevale, T. F. Segawa and G. Bodenhausen, Chem.–Eur. J., 2010, 18(37), 11573–11576 CrossRef PubMed.
- K. Takegoshi, K. Ogura and K. Hikichi, J. Magn. Reson., 1989, 84, 611–615 Search PubMed.
- P. C. van Zijl, C. T. W. Moonen and M. J. Von Kienlin, J. Magn. Reson., 1990, 89, 28–40 Search PubMed.
- R. W. Adams, C. M. Holroyd, J. A. Aguilar, M. Nilsson and G. A. Morris, Chem. Commun., 2013, 49, 358–360 RSC.
- J. A. Aguilar, M. Nilsson, G. Bodenhausen and G. A. Morris, Chem. Commun., 2012, 48, 811–813 RSC.
- B. Baishya, C. L. Khetrapal and K. K. Dey, J. Magn. Reson., 2013, 234, 67–74 CrossRef PubMed.
- B. Baishya and C. L. Ketrapal, J. Magn. Reson., 2014, 242, 143–154 CrossRef PubMed.
- L. Castañar, E. Sistare, A. Virgili, R. T. Williamson and T. Parella, Magn. Reson. Chem., 2015, 53, 115–119 CrossRef PubMed.
- B. Baishya and A. Verma, J. Magn. Reson., 2015, 252, 41–48 CrossRef PubMed.
- J. Ilgen, L. Kaltschnee and C. M. Thiele, J. Magn. Reson., 2018, 286, 18–29 CrossRef PubMed.
- M. J. Thrippleton, R. A. E. Edden and J. keeler, J. Magn. Reson., 2005, 174(1), 97–109 CrossRef PubMed.
Footnote |
| † Electronic supplementary information (ESI) available: Details of pulse sequence used in this manuscript, and acquisition and processing parameters for the strychnine sample, detailed experimental parameters of Fig. 5 are given. See DOI: 10.1039/c8ra01272e |
| This journal is © The Royal Society of Chemistry 2018 |