 Open Access Article
Evaluation of diagnostic ratios of phenanthrenes and chrysenes for the identification of severely weathered spilled oils from the simulation weathering and the Sinopec pipeline explosion at Huangdao, 2013
Bin Han ab,
Li Zheng*ab and
Shun Yua
aKey Laboratory for Marine Bioactive Substances and Modern Analytical Technology, First Institute of Oceanography, State Oceanic Administration, Qingdao, 266061, China. E-mail: zhengli@fio.org.cn
bLaboratory for Marine Ecology and Environmental Science, Qingdao National Laboratory for Marine Science and Technology, Qingdao, 266071, China
First published on 18th September 2018
Abstract
The composition and physical properties of spilled oil undergo great changes during a serious weathering process. This causes great difficulties for identifying the source of an oil spill. So stable and trustworthy diagnostic ratios (DRs) for the accurate identification of severely weathered spilled oils are very important. An explosion in the Sinopec pipeline happened on November 22, 2013 at Qingdao, China. Local beaches at Jiaozhou Bay were polluted by spilled oils. After the accident we collected original spilled oil samples from an area free from human interference near the oil leakage point. Synchronized with actual beach weathering, laboratory experiments were conducted to simulate oil weathering for 360 days by using the collected original spilled oil samples. Based on the t-test and the repeatability limit method, 46 diagnostic ratios (DRs) of phenanthrenes and chrysenes were screened. 18 DRs maintained remarkable stability during the simulated weathering experiments and field weathering process. These stable ratios can retain the characteristics of the oil source during weathering. They are very beneficial for improving the accuracy of identifying the source of severely weathered oil and can be used as an effective supplement to the existing index system for source identification.
1 Introduction
The flourishing development of petroleum exploitation and the petrochemical industry in recent years has increased the chances of oil spill accidents. Oil pollution is a serious threat to the marine environment. Marine oil pollution not only pollutes the oceanic and coastal environment but also seriously affects industrial production and daily life in coastal areas.1–7 In the past few decades, oil spills have become a major environmental and ecological concern because of their extensive damage to marine and terrestrial ecosystems, human health, and natural resources.8,9 In the case of oil spills, it is very important to determine the source of an oil spill accurately and quickly. The diagnostic ratio method of biomarkers in spilled oil is critical for providing forensic evidence in the investigation of oil spill accidents and settling disputes related to liability.10–15 Biomarkers in petroleum usually include isoprenes, hopanes, steranes, polycyclic aromatic hydrocarbons, and so on. However, after an oil spill, the spilled oil will be affected by the weathering process. The weathering processes mainly include evaporation,16,17 dissolution,18,19 dispersion,20 hydrolysis,21 biodegradation,22,23 photooxidation,24 emulsification,25 adsorption onto suspended particulate materials, and sedimentation.26 The long-term effects of weathering change the chemical composition and physical properties of spilled oil. The lack of important components has caused great difficulties for the identification of the source of spilled oil. So it is essential to develop and verify some new stable DRs to improve the identification accuracy of seriously weathered spilled oil. These DRs are helpful for resolving disputes about responsibility caused by uncertainty about the source of spilled oil.Polycyclic aromatic hydrocarbons (PAHs) are constituted of two or more fused benzene rings, which can present different substituents. PAHs in oils are dominated almost exclusively by C1 (monosubstituted) to C4 (tetrasubstituted) alkylated homologues of parent PAHs, such as naphthalene (Nap), phenanthrene (Phe), dibenzothiophene (Dbt), fluorene (Flu) and chrysene (Chr).27 The properties of PAHs are extremely stable and have strong resistance to thermal degradation and biodegradability due to their special structure. Thus, some of these compounds are particularly recommended for source identification of oil spills.28 In these compounds, the diagnostic ratios of some compounds have been used in oil spill identification, while the DRs between phenanthrenes and chrysenes have rarely been selected.29–32 Phenanthrenes have three benzene rings. Chrysenes have four benzene rings. In terms of structure, their anti-weathering ability and anti-biodegradability are stronger than those of low molecular weight polycyclic aromatic hydrocarbons (PAHs). These two kinds of compounds are easy to use to build relatively stable diagnostic ratios. These ratios may be useful to identify the source of heavily weathered spilled oil. Some DRs of phenanthrenes have been adopted. These ratios, namely, 2MPhe/(2MPhe + 1MPhe), (C2Dbt/C3Phe)/(C3Dbt/C3Phe) and (C3Dbt/C3Phe)/(C3Dbt/C3Chr) have been used to identify the source of crude oils.28,33,34 Current research on identifying seriously weathered spilled oils according to the parameters of phenanthrenes and chrysenes is still relatively rare. On November 22, 2013, an oil pipeline explosion occurred in Qingdao, Shandong province, China. After the accident we collected original spilled oil samples from an area free from human interference near the oil leakage point. Synchronized with actual beach weathering, laboratory experiments were conducted to simulate oil weathering for 360 days by using the collected original spilled oil samples. Studies were performed on changes in the characteristics of crude oil with the weathering process for 360 days. The weathered samples were both collected in the laboratory and from the coastal field at the same time point. The phenanthrenes and chrysenes from the samples were qualitatively analyzed by the GC/MS method. 46 new DRs were constructed based on these compounds. The stability and applicability of the new DRs were screened and evaluated through practical application in identification of the source of oil samples collected from two types of serious weathering situations. On this basis, some reasonable suggestions for the application of phenanthrenes and chrysenes in the aspect of identifying the source of seriously weathered spilled oils have been put forward in this paper. This would be beneficial for improving the accuracy of source identification for seriously weathered spilled oils.
2 Materials and methods
2.1 Sample and experimental design
After the accident, we collected original spilled oil samples from an area free from human interference near the oil leakage point. The oil sample was identified as heavy crude through component analysis. A long-term simulated weathering lab experiment was performed by using this collected oil sample. A laboratory-scale weathering facility was designed and built on an open-air roof platform. The simulated natural weathering process was conducted in an experimental tank, which was 80 cm long, 60 cm wide, and 40 cm high, with about ten liters of seawater and sand on the bottom (approximately 8 cm thick). About two liters of the oil sample were dropped into the weathering tank. After weathering for 90 days, the oil spill on the shoreline was very sticky and clung to the stones. The spilled oil became stiff 180 days later, but the interior of a block of oil was soft. After 360 days, the spilled oil became very hard. Under the laboratory simulation experiment conditions, the oil samples remained viscous for 90 days and the surface layer of the oil became stiff after 180 days, and the inside of the oil remained viscous the whole time. The simulated weathering oil samples were collected periodically on the 90th, 180th, 270th, and 360th days. The simulated weathering process is the natural weathering process without human disturbance. At the same time, the coastal weathered oil samples were collected from one site with no human disturbance near the oil leakage point. The coastal sampling time was consistent with the sampling time of the laboratory simulation experiment. All of the oil samples were collected carefully in 100 mL wide-mouthed dark brown glass jars and transported to the laboratory where the analysis was conducted immediately. The remainders were stored in the refrigerator at 4 °C.In this study, eight crude oil samples from different regions were selected for testing the new DRs of phenanthrenes and chrysenes. The selected crude oil samples were mainly from the Bohai oil platform and the Bohai oil spill, South China Sea Oilfield, Congo and Saudi Arabia. The spilled oil sample from the Sinopec pipeline explosion on November 22, 2013 at Qingdao was selected as the contrasting test sample. The names and descriptions of the samples are shown in Table 1.
| Name | Description | Name | Description |
|---|---|---|---|
| S01 | Spilled oil at Qingdao, China | SP5 | Crude oil from South China Sea oil platform (NH047) |
| S02 | Spilled oil at Bohai (193), China | S06 | Crude oil from South China Sea oilfield (NH046) |
| S03 | Crude oil from Bohai oil platform (282) | S07 | Crude oil from Congo |
| S04 | Crude oil from Bohai oil platform (361) | S08 | Crude oil from Saudi Arabia |
2.2 Extraction and instrumental analysis
The weathered oil samples were processed as follows. Approximately 0.05 g of the oil samples was initially dissolved in hexane and then centrifuged at 2800 rpm speed. A silica gel column (30 cm × 1.2 cm I.D.) with a PTFE stopcock was packed with 5 g of activated silica gel and topped with approximately 1.0 cm-high anhydrous granular sodium sulfate. The column was then conditioned using 20 mL of hexane. Before exposure of the sodium sulfate layer to air, 200 μL of the centrifuged oil solution was quantitatively transferred into the column. 3 mL of hexane was used to complete the transfer. Approximately 25 mL of hexane was used to elute phenanthrenes and chrysenes. Thereafter, hexane was concentrated under a stream of nitrogen to less than 1 mL and was then adjusted to exactly 1.0 mL for gas chromatography-mass spectrometry (GC-MS) analysis.The determination of phenanthrenes and chrysenes was performed on an Agilent 6890N gas chromatography 5973N mass selective detector (GC-MS, Agilent, USA) system equipped with a fused silica capillary HP-5MS column (30 m × 0.25 mm i.d., 0.25 μm film thickness, Agilent, USA). The oven temperature program was as follows: start at 70 °C held for 5 min, 50–300 °C at 6 °C min−1 held for 20 min. An aliquot sample (1 μL) was injected in the splitless mode and helium was used as the carrier gas (1.0 mL min−1). The mass spectrometer was operated in the selective ion monitoring (SIM) mode using positive ion electron impact ionization (EI). The selected ions with m/z values of 184, 192, 206, 220, and 234 are for phenanthrenes. The selected ions with m/z values of 228, 242, 256, and 270 are for chrysenes.
2.3 Qualitative and quantitative analyses for phenanthrenes and chrysenes
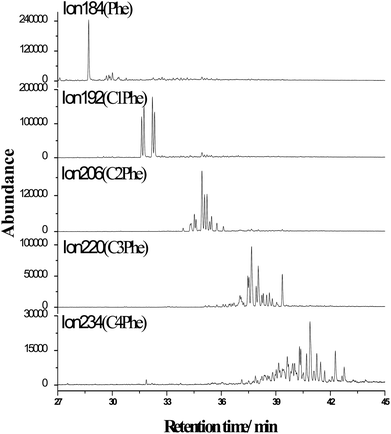
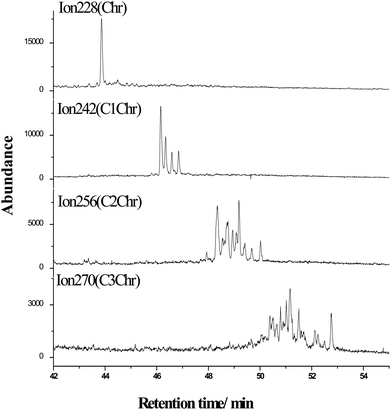
Petroleum is a complex mixture of alkanes, aromatic hydrocarbons, resins, and asphaltenes. Most compounds in the field lack standards. The mass chromatogram of the PAHs in crude oil has obvious distribution characteristics. A large number of PAHs have been identified qualitatively.27,35 PAHs can be confirmed qualitatively by combining information about ion fragments in the mass spectra with the retention time index, and comparing them with the spectra and data in the references. So the phenanthrenes and chrysenes were analyzed qualitatively by using the chromatogram properties and retention time index. The semi-quantitative GC-MS with internal standard (p-terphenyl-d) method was used to analyze the phenanthrenes and chrysenes quantitatively. The qualitative and quantitative determination methods for the standard samples were developed using SIM. Fig. 1 and 2 show phenanthrenes and chrysenes, respectively.2.4 DRs of phenanthrenes and chrysenes
The diagnostic ratio is mainly the ratio of biomarkers in oil samples. DRs are characterized by good stability and weathering resistance. The DRs of biomarkers are frequently used for oil source identification.27,35–37 On the basis of the calculation method for DRs,38 46 new DRs of the qualitative phenanthrenes and chrysenes were selected for source identification of weathered oil spills, as presented in Table 2.| Num. | Description | Num. | Description | Num. | Description |
|---|---|---|---|---|---|
| DR01 | Phe/(Phe + C1Phe) | DR17 | Chr/(Chr + C2Chr) | DR33 | C1Phe/(C1Phe + C3Chr) |
| DR02 | Phe/(Phe + C2Phe) | DR18 | Chr/(Chr + C3Chr) | DR34 | C2Phe/(C2Phe + Chr) |
| DR03 | Phe/(Phe + C3Phe) | DR19 | Chr/total Chr | DR35 | C2Phe/(C2Phe + C1Chr) |
| DR04 | Phe/(Phe + C4Phe) | DR20 | C1Chr/(C1Chr + C2Chr) | DR36 | C2Phe/(C2Phe + C2Chr) |
| DR05 | Phe/total Phe | DR21 | C1Chr/(C1Chr + C3Chr) | DR37 | C2Phe/(C2Phe +C3Chr) |
| DR06 | C1Phe/(C1Phe + C2Phe) | DR22 | C1Chr/total Chr | DR38 | C3Phe/(C3Phe + Chr) |
| DR07 | C1Phe/(C1Phe + C3Phe) | DR23 | C2Chr/(C2Chr + C3Chr) | DR39 | C3Phe/(C3Phe + C1Chr) |
| DR08 | C1Phe/(C1Phe + C4Phe) | DR24 | C2Chr/total Chr | DR40 | C3Phe/(C3Phe + C2Chr) |
| DR09 | C1Phe/total Phe | DR25 | C3Chr/total Chr | DR41 | C3Phe/(C3Phe + C3Chr) |
| DR10 | C2Phe/(C2Phe + C3Phe) | DR26 | Phe/(Phe + Chr) | DR42 | C4Phe/(C4Phe + Chr) |
| DR11 | C2Phe/(C2Phe + C4Phe) | DR27 | Phe/(Phe + C1Chr) | DR43 | C4Phe/(C4Phe + C1Chr) |
| DR12 | C2Phe/total Phe | DR28 | Phe/(Phe + C2Chr) | DR44 | C4Phe/(C4Phe + C2Chr) |
| DR13 | C3Phe/(C3Phe + C4Phe) | DR29 | Phe/(Phe + C3Chr) | DR45 | C4Phe/(C4Phe + C3Chr) |
| DR14 | C3Phe/total Phe | DR30 | C1Phe/(C1Phe + Chr) | DR46 | Total Phe/(total Phe + total Chr) |
| DR15 | C4Phe/total Phe | DR31 | C1Phe/(C1Phe + C1Chr) | — | — |
| DR16 | Chr/(Chr + C1Chr) | DR32 | C1Phe/(C1Phe + C2Chr) | — | — |
2.5 Screening technique for the DRs of phenanthrenes and chrysenes
The DRs of phenanthrenes and chrysenes should differ between oil samples from different sources. And they should remain stable during the weathering process. Thus, the DRs should be verified and screened prior to their application in source identification for severely weathered oils. The screening technique in this paper includes the similarity method, Student's t-test and repeatability limit.The degree of similarity between the oil samples can be acquired by using the correlation coefficient calculation method.39 N pairs of data from two sets (x, y) were represented as (xi, yi) (i = 1, 2, 3, … n). The correlation coefficient is given by:
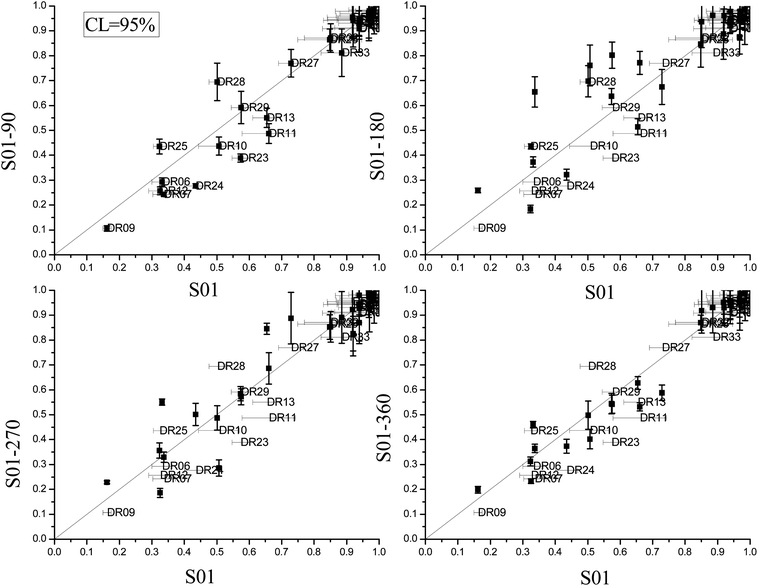
Student's t-test was adopted in this study to identify the DRs of phenanthrenes and chrysenes. Detailed descriptions and demonstrations for the t-test can be found in the reference (Sun et al., 2007). A straight line (x = y) represents a “perfect” match. If the error bars of all selected DRs overlap with the line, then the oil sample displays a positive match with the other sample (i.e., within analytical variation). After presenting the results of a comparison between different oil samples in the x–y plots, the DRs should not show a match.
The repeatability limit parameter was used to calculate the selected DRs in this study. The repeatability limit can be calculated from the standard deviation. It represents the maximum permitted difference between the weathered and original oil samples. A reliable estimate of the standard deviation was required to calculate the appropriate repeatability limits. The repeatability limit (r) is reported as  thereby providing limits within 95% of measurements.38,40 If the absolute difference between two DRs of the weathered and original oil samples is less than r95%, then the DRs show good stability during weathering. These DRs could be used for the source identification of weathered spilled oil samples. However, these DRs are not suitable. The repeatability limit analysis can be recommended for verifying the anti-weathering capability of the selected DRs in the weathering process.
3 Results and discussion
3.1 Difference analysis for the selected DRs
The individual differences in the DRs of phenanthrenes and chrysenes can be very important. If the differences in the selected DRs are small or do not exist between crude oils from different sources, then these DRs cannot discriminate between the oil samples from different sources. Moreover, these DRs will not be suitable for identifying the source of the oil. So if the DRs of phenanthrenes and chrysenes differ between different oil samples, they can be selected for the next stage of verification between simulated weathering and original samples. Finally, the DRs would be used to identify severely weathered spilled oils for further testing. Thus, the 46 selected DRs were used to differentiate crude oil samples from different regions. The selected DRs with a relative standard deviation (RSD) of less than 5% are not suitable for distinguishing oil samples from different fields. We first calculated and compared the RSDs of the 46 selected DRs between different samples. Taking S01 as the comparison object, the RSDs between the eight samples were calculated. The relative standard deviations (RSDs) of the 46 selected DRs between S01 and S02 range from 6.34% to 136.14%, with a mean of 51.51%; those between S01 and S03 range from 5.91% to 163.04%, with a mean of 49.13%; those between S01 and S04 range from 7.41% to 186.69%, with a mean of 58.40%; those between S01 and S05 range from 6.76% to 157.94%, with a mean of 52.71%; those between S01 and S06 range from 6.04% to 146.89%, with a mean of 47.41%; those between S01 and S07 range from 5.52% to 146.92%, with a mean of 44.98%; and those between S01 and S08 range from 5.56% to 128.68%, with a mean of 41.10%. The inconsistencies among the selected DRs may be partially explained by heterogeneity in the oil samples from different fields. The selected DRs with an RSD of more than 5% are suitable for distinguishing oil samples from different fields. Thus, all of the 46 selected ratios can be used for the identification of crude oils from different sources.Then, we screened and verified these diagnostic ratios by the similarity method. The calculation results for the similarity between the eight samples are shown in Table 3. The similarity between the oil samples from different fields using the 46 selected DRs was less than 1. Samples from close regions are of high similarity, with a similarity ratio of more than 0.80, such as those of S05 and S06, S03 and S04. But such phenomena are also found between oils from different sources, such as those of S01 and S07, S01 and S08, S07 and S08. This phenomenon may be the result of the diagnostic ratios between total numbers of PAHs. At this point, the 46 selected DRs are beneficial for identifying the source of oil without weathering. However, once oil leaks into seawater, weathering inevitably occurs. Thus, the identification of weathered oil samples should be considered further.
| Samples | Samples | |||||||
|---|---|---|---|---|---|---|---|---|
| S01 | S02 | S03 | S04 | S05 | S06 | S07 | S08 | |
| S01 | 1.00 | 0.62 | 0.80 | 0.64 | 0.95 | 0.87 | 0.91 | 0.93 |
| S02 | 0.62 | 1.00 | 0.85 | 0.69 | 0.55 | 0.42 | 0.74 | 0.52 |
| S03 | 0.80 | 0.85 | 1.00 | 0.81 | 0.75 | 0.60 | 0.93 | 0.72 |
| S04 | 0.64 | 0.69 | 0.81 | 1.00 | 0.57 | 0.44 | 0.68 | 0.56 |
| S05 | 0.95 | 0.55 | 0.75 | 0.57 | 1.00 | 0.97 | 0.91 | 0.92 |
| S06 | 0.87 | 0.42 | 0.60 | 0.44 | 0.97 | 1.00 | 0.81 | 0.93 |
| S07 | 0.91 | 0.74 | 0.93 | 0.68 | 0.91 | 0.81 | 1.00 | 0.87 |
| S08 | 0.93 | 0.52 | 0.72 | 0.56 | 0.92 | 0.93 | 0.87 | 1.00 |
3.2 Weathering resistance of the selected DRs under the lab simulation
The weathered and original S01 samples from the long-term simulated weathering experiment were selected to validate the 46 selected DRs. The correlation diagram of the t-test is shown in Fig. 3. Fig. 3 shows that when the confidence level is 95%, for S01 weathering for 90, 180, 270, and 360 days, some error bars of these DRs do not cross the y = x entirely fitted line. In this case, we can judge that some of the 46 selected DRs are unstable after weathering for 90 days in the simulated weathering experiment.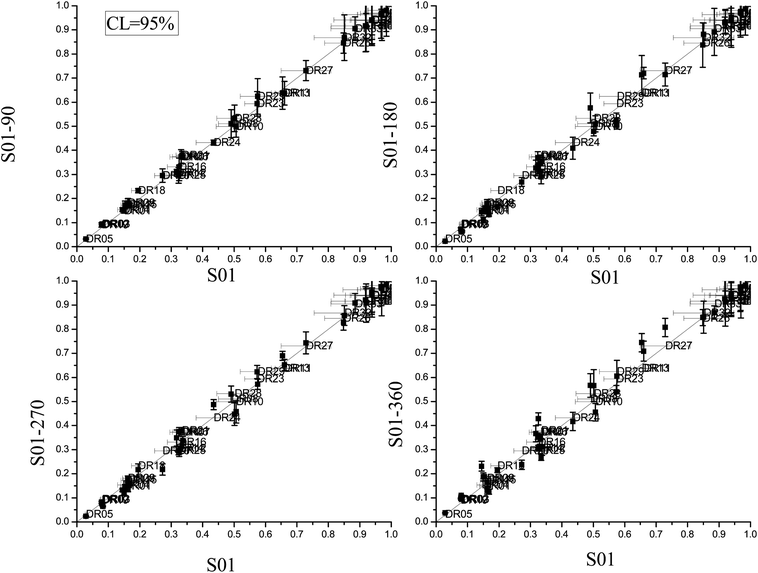 | ||
| Fig. 3 Student's t-tests of 46 DRs of phenanthrenes and chrysenes during the simulated weathering experiment (RSD < 5%). | ||
Meanwhile, the repeatability limit method was adopted to display the anti-weathering ability of these DRs during the long-term simulated weathering experiment. The repeatability limit analysis result for weathered S01 is shown in Fig. 4. These DRs are suitable for the source identification of weathered spilled oil when the absolute difference between the maximum and minimum values of the diagnostic are smaller than the repeatability limit. Otherwise, these DRs are not suitable. The repeatability limit analysis shows the anti-weathering capability of the selected DRs in the weathering process. Except for DR02 and DR18, the selected DRs maintain good stability during weathering for 90 days. After 90 days of weathering, other DRs, such as DR01, DR02, DR03, DR05, DR08, DR16 and DR20, displayed instability. The number of unstable ratios continues to grow over 180 days of weathering. Overall, under the weathering scale of the laboratory, 31 DRs including DR06, DR07, from DR09 to DR13 and from DR23 to DR46 maintained good weathering resistance for 360 days of weathering. It is not difficult for us to perceive that the stable DRs are mainly concentrated in the ratios between phenanthrenes and chrysenes. This is mainly related to the phenanthrene content being far greater than that of chrysenes in crude oils.
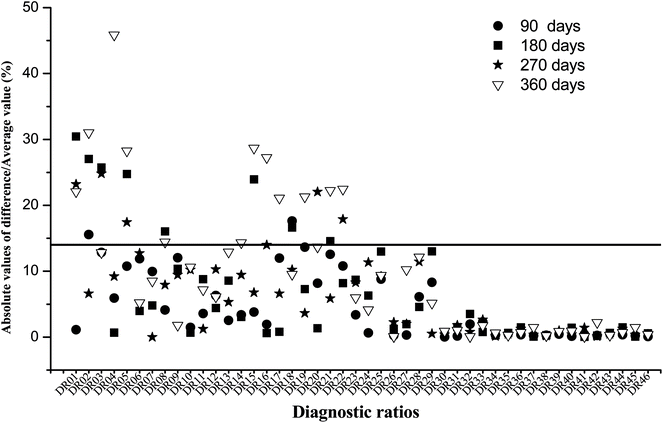 | ||
| Fig. 4 Repeatability limit analysis results of weathered S01 samples during the simulated weathering experiment. | ||
3.3 Weathering resistance of the selected DRs under the coastal experiment
In order to verify the stability of the 31 screened DRs under actual coastal weathering conditions, the weathered oil samples were used to verify the stability of the 31 selected DRs. These weathered oil samples were collected from an area free from human interference near the oil leakage point after the explosion in Qingdao. The Student's t-test (Fig. 5) and repeatability limit method (Fig. 6) were adopted to investigate the feasibility of the 31 DRs during the coastal weathering process.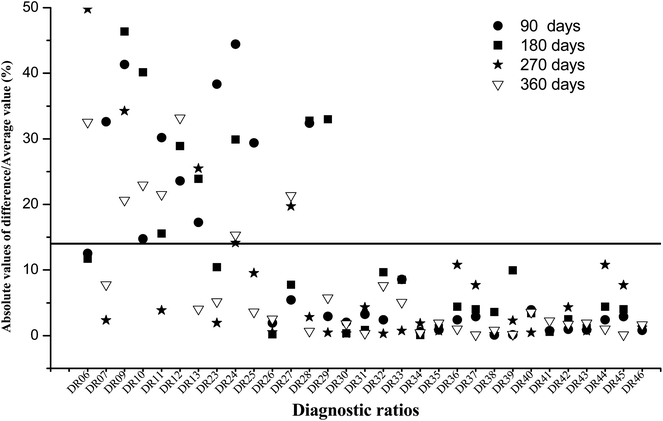 | ||
| Fig. 6 Repeatability limit analysis results of weathered S01 samples during the coastal weathering process. | ||
Fig. 5 shows that most of the DRs remain relatively stable. However, when the confidence level is 95%, certain DRs of the weathered oil sample cannot be completely consistent with those of the original oil sample. When the weathering time is over 180 days, a large deviation is found in the DRs.
Fig. 6 shows that unstable DRs can be clearly identified. After more than 90 days of weathering, some of the 31 selected DRs show instability. These DRs are concentrated in the ratios between phenanthrenes themselves. 10 DRs, namely, DR07, from DR09 to DR13, from DR23 to DR25 and DR28, of the weathered oil display a noticeable difference from those of the original oil sample. After more than 270 days of weathering, the number of such DRs continued to rise. After more than 360 days of weathering, more DRs of weathered oil exhibit a large deviation from those of the original oil samples. There are 18 DRs, namely, DR26 and from DR30 to DR46, which have retained good stability during both the simulated weathering experiment and the coastal weathering experiment. Those DRs are mainly composed of polysubstituted phenanthrenes and chrysenes. They can effectively eliminate the deviation caused by monomer weathering by using the form of a gross class. Therefore, they remained relatively stable during heavy weathering. So, these DRs can be used as an effective supplement to source identification of severely weathered oil.
4 Concluding remarks
Spilled oil samples collected from the catastrophic pipeline explosion in Qingdao were used as the original oil for a simulated weathering experiment. In the same period, weathered samples were also collected on site. Laboratory simulation was conducted synchronously with the coastal weathering. Such an experimental design provides a good scenario for screening and validating new DRs. The 46 selected DRs of phenanthrenes and chrysenes were verified by initial screening, a laboratory weathering test, and an actual coastal weathering test. 18 DRs, namely, DR26 and from DR30 to DR46, retained good stability during both the simulated weathering experiment and the field weathering experiment. So, those 18 DRs, namely, Phe/(Phe + Chr), C1Phe/(C1Phe + Chr), C1Phe/(C1Phe + C1Chr), C1Phe/(C1Phe + C2Chr), C1Phe/(C1Phe + C3Chr), C2Phe/(C2Phe + Chr), C2Phe/(C2Phe + C1Chr), C2Phe/(C2Phe + C2Chr), C2Phe/(C2Phe + C3Chr), C3Phe/(C3Phe + Chr), C3Phe/(C3Phe + C1Chr), C3Phe/(C3Phe + C2Chr), C3Phe/(C3Phe + C3Chr), C4Phe/(C4Phe + Chr), C4Phe/(C4Phe + C1Chr), C4Phe/(C4Phe + C2Chr), C4Phe/(C4Phe + C3Chr), total Phe/(total Phe + total Chr), can maintain good stability under two weathering conditions, especially in complex coastal weathering conditions. This is a good indication of their conservation. Thus, the 18 DRs would be strongly recommended as supplemental differentiating indicators for the source identification of severely weathered oil.Conflicts of interest
The authors declare there is no conflicts of interest regarding the publication of this paper.Acknowledgements
This work was financially supported by China-ASEAN Maritime Cooperation Fund: East Asia Marine Cooperation Platform, Basic Scientific Fund for National Public Research Institutes of China (2017Q05), the National Natural Science Foundation of China-Shandong Joint Funded Project (U1606404) and the project of the National Key Research and Development Program (2016YFC0503602).References
- P. Sun, M. Bao, G. Li, X. Wang, Y. Zhao, Q. Zhou and L. Cao, J. Chromatogr. A, 2009, 1216, 830 CrossRef PubMed.
- T. Fitzgerald and J. Gohlke, Environ. Sci. Technol., 2014, 48, 1993 CrossRef PubMed.
- M. C. Baker, M. A. Steinhoff and G. F. Fricano, Mar. Ecol.: Prog. Ser., 2016, 576, 219 CrossRef.
- E. W. Harville, A. Shankar, L. Zilversmit and P. Buekens, Int. Arch. Occup. Environ. Health, 2017, 27, 1 Search PubMed.
- G. R. Finlayson, B. L. Chilvers, H. Pearson, B. J. White, S. T. Finlayson, K. Sievwright, N. Zyl, K. Morgan and C. Clumpner, Mar. Pollut. Bull., 2018, 126, 137 CrossRef PubMed.
- K. Morgan and C. Clumpner, Mar. Pollut. Bull., 2018, 126, 137 CrossRef PubMed.
- R. R. Wilson, C. Perham, D. P. French-Mccay and R. Balouskus, Environ. Pollut., 2018, 235, 652 CrossRef PubMed.
- H. O. Duarte and E. L. Droguett, Hum. Ecol. Risk Assess., 2015, 22, 350 CrossRef.
- K. Higashi and K. Hagiwara, Waterence Technol., 1988, 20, 55 CrossRef.
- P. Daling, L. Faksness, A. Hansen and S. Stout, Environ. Forensics, 2002, 3, 263 CrossRef.
- J. W. Anderson and R. F. Lee, Hum. Ecol. Risk Assess., 2006, 12, 1192 CrossRef.
- P. Sun, Z. Gao, Y. Zhao, X. Wang, X. Cao and G. Li, Environ. Forensics, 2009, 10, 308 CrossRef.
- M. A. Harwell and J. H. Gentile, Hum. Ecol. Risk Assess., 2014, 20, 889 CrossRef PubMed.
- J. Bayona, C. Domínguez and J. Albaigés, Trends Environ. Anal. Chem., 2015, 5, 26 CrossRef.
- P. L. Adhikari, R. L. Wong and E. B. Overton, Chemosphere, 2017, 184, 939 CrossRef PubMed.
- M. Fingas, Spill Sci. Technol. Bull., 1996, 3, 191 CrossRef.
- R. Nelson, B. Kile, D. Plata, S. Sylva, X. Li and C. Reddy, Environ. Forensics, 2006, 7, 33 CrossRef.
- M. Doval, A. Moroño, Y. Pazos, A. Lopez, M. Madriñán and J. Cabanas, Estuarine, Coastal Shelf Sci., 2006, 67, 205 CrossRef.
- M. Gonnelli, Y. Galletti, E. Marchetti, L. Mercadante, S. R. Brogi and A. Ribotti, Deep Sea Res., Part II, 2016, 133, 88 CrossRef.
- W. J. Lehr and D. Simecek-Beatty, Spill Sci. Technol. Bull., 2000, 6, 247 CrossRef.
- D. Sidiras, F. Batzias, I. Konstantinou and M. Tsapatsis, Chem. Eng. Res. Des., 2014, 92, 1781 CrossRef.
- O. Brakstad, P. Daling, L. Faksness, S. Vang, L. Syslak and F. Leirvik, Mar. Pollut. Bull., 2014, 84, 125 CrossRef PubMed.
- Y. Pi, M. Bao, Y. Li, G. Li, J. Lu and P. Sun, RSC Adv., 2015, 5, 97665 RSC.
- B. Harriman, P. Zito, D. Podgorski, M. A. Tarr and J. Suflita, Environ. Sci. Technol., 2017, 51, 7412 CrossRef PubMed.
- M. Sergejeva, J. Laanearu and K. Tabri, Int. Confer. Mar. Struct., 2017, p. 43 Search PubMed.
- C. Morales-Caselles, J. Kalman, C. Micaelo, A. Ferreira, C. Vale and I. Riba, Chemosphere, 2008, 71, 1207 CrossRef PubMed.
- Z. Wang and M. Fingas, Mar. Pollut. Bull., 2003, 47, 423 CrossRef PubMed.
- Z. Wang, C. Yang, B. Hollebone and M. Fingas, Environ. Sci. Technol., 2006, 40, 5636 CrossRef PubMed.
- B. Pérezcadahía, B. Laffon, E. Pásaro and J. Méndez, Comp. Biochem. Physiol., Part C: Toxicol. Pharmacol., 2004, 138, 453 Search PubMed.
- J. Tronczyński, C. Munschy and K. Héas-Moisan, Aquat. Living Resour., 2004, 17, 243 CrossRef.
- J. Christensen, A. Hansen, T. Giorgio, M. John and O. Andersen, Environ. Sci. Technol., 2004, 38, 2912 CrossRef PubMed.
- M. Ahmed and S. C. George, Org. Geochem., 2004, 35, 137 CrossRef.
- B. Yan, T. A. Abrajano, R. F. Bopp, L. A. Benedict, D. A. Chaky, E. Perry, J. Song and D. P. Keane, Org. Geochem., 2006, 37, 674 CrossRef.
- C. Morales-Caselles, M. B. Yunker and P. S. Ross, Arch. Environ. Contam. Toxicol., 2017, 73, 118 CrossRef PubMed.
- Z. Wang, K. Li, M. Fingas, L. Sigouin and L. Ménard, J. Chromatogr. A, 2002, 971, 173 CrossRef PubMed.
- Z. Wang, M. Fingas and D. Page, J. Chromatogr. A, 1999, 843, 369 CrossRef.
- Z. Wang, C. Yang, Z. Yang, C. Brown, B. P. Hollebone and S. A. Stout, Stand. Handbook Oil Spill Environ. Forensics. 2016, vol. 7, p. 131 Search PubMed.
- P. Sun, Z. Gao and W. Cui, Development and application of oil spill identification techniques, Ocean Publishing House, Beijing, 2007, vol. 105 Search PubMed.
- B. Han, J. H. Chen, L. Zheng, T. Zhou, J. Li and X. R. Wang, J. Sep. Sci., 2015, 38, 3198 CrossRef PubMed.
- S. Mizuguchi, H. Gray, L. Calabrese, G. Haff, W. Sands and M. Ramsey, J. Sports Med. Phys. Fitness, 2014, 54, 417 Search PubMed.
| This journal is © The Royal Society of Chemistry 2018 |

