
 Open Access Article
 This Open Access Article is licensed under a Creative Commons Attribution-Non Commercial 3.0 Unported Licence
Influencing characteristics of short-time aerobic digestion on spatial distribution and adsorption capacity of extracellular polymeric substances in waste activated sludge
Ying Liu abc,
Wenzhou Lvc,
Zhiqiang Zhangab and
Siqing Xia*ab
abc,
Wenzhou Lvc,
Zhiqiang Zhangab and
Siqing Xia*ab
aState Key Laboratory of Pollution Control and Resource Reuse, Key Laboratory of Yangtze River Water Environment, Ministry of Education, College of Environmental Science and Engineering, Tongji University, Shanghai 200092, China. E-mail: siqingxia@tongji.edu.cn
bShanghai Institute of Pollution Control and Ecological Security, Shanghai 200092, China
cFaculty of Architectural, Civil Engineering and the Environment, Ningbo University, Ningbo 315211, China
First published on 18th September 2018
Abstract
The spatial distribution and adsorption capacity of extracellular polymeric substances (EPS) were systematically investigated for waste activated sludge (WAS) treated by a short-time aerobic digestion (STAD) process. During the STAD process, both the slime and the loosely bound EPS (LB-EPS) increased first and then decreased, while the tightly bound EPS (TB-EPS) gradually increased all the way. The variations of the fluorescence intensities at peaks A and B for the slime, the LB-EPS and the TB-EPS were consistent with the above variation of their concentrations. In the initial stage of the STAD process, aeration scour was mainly responsible for the release of LB-EPS and TB-EPS, which further resulted in the increase of slime and LB-EPS. Meanwhile, newly secreted EPS by microorganisms led to the increase of TB-EPS. In the later stage of the STAD process, the biodegradation of soluble organic matter caused the concentration decrease of both slime and LB-EPS. The Pb2+ adsorption capacity by LB-EPS, TB-EPS and total EPS gradually increased with the increasing of STAD time, suggesting that the LB-EPS and TB-EPS played a key role in the adsorption of Pb2+ and the LB-EPS had a higher adsorption capacity. FTIR results further indicated that STAD could improve the amounts of functional groups, especially for –OH, –COOH and –NH2 in both LB-EPS and TB-EPS responsible for the binding of heavy metals, resulting in the increased adsorption capacity of EPS. Disclosing the influencing characteristics of the STAD process on the spatial distribution and the adsorption capacity of EPS in WAS for the first time, this work lays a foundation for the application of the STAD process in the reuse of WAS.
1. Introduction
Extracellular polymeric substances (EPS) are a complex mixture of biomolecules containing proteins, polysaccharides, humic-like substances, nucleic acid, lipids and glycoproteins surrounding the bacterial cells.1 There are abundant binding sites containing carboxyl, hydroxyl, amino, phosphate, and sulfate in EPS, and most of the functional groups are negatively-charged at neutral pH and are able to form organometallic complexes with metal ions. EPS could be used as a biosorbent for the removal and recovery of heavy metals from some kinds of industrial wastewater.2,3 Previously, the biosorbents for heavy metals were always obtained from the microorganism using pure culture cultivation, but it consumed a large amount of medium and the cost is usually pretty high. As a low cost of biosorbent, the EPS extracted from waste activated sludge (WAS) has aroused wide attention all over the world.1,4Containing a significant amount of natural organic macromolecule substances, WAS from municipal wastewater treatment plants (WWTPs) is believed to be a good source of EPS.5 The microorganisms in WAS can excrete EPS during the aerobic biodegradation process of organic pollutants in wastewater.6 Many factors have been reported to affect the production of EPS from activated sludge, e.g., substrate type, nutrient content, growth phase and external conditions.7–10 Sponza7 found that under steady-state conditions the protein content was higher in the EPS from the sludge treating winery and municipal wastewaters than that treating pulp-paper, textile and petrochemical wastewaters. The EPS in activated sludge could be rich in proteins but low in polysaccharides at a carbon to nitrogen ratio of 5![[thin space (1/6-em)]](https://www.rsc.org/images/entities/char_2009.gif) :1, but as the carbon to nitrogen ratio increased to 40:1, the amount of protein decreased sharply whereas the amount of polysaccharides increased.8 The EPS content also could be closely related to the bacterial growth phase. During the exponential growth phase, the EPS content increased with cultivation time, but during the stationary phase it decreased with increasing cultivation time.9 Sheng et al.10 reported that under toxic conditions the increase of the protein content far exceeded that of other components in EPS. As the concentration of toxic substances went over a threshold, its effect on the promotion of EPS production became less significant.
:1, but as the carbon to nitrogen ratio increased to 40:1, the amount of protein decreased sharply whereas the amount of polysaccharides increased.8 The EPS content also could be closely related to the bacterial growth phase. During the exponential growth phase, the EPS content increased with cultivation time, but during the stationary phase it decreased with increasing cultivation time.9 Sheng et al.10 reported that under toxic conditions the increase of the protein content far exceeded that of other components in EPS. As the concentration of toxic substances went over a threshold, its effect on the promotion of EPS production became less significant.
The short-time aerobic digestion (STAD) process of WAS has been confirmed to be an effective method for promoting the EPS production, which is meaningful to both EPS source and WAS stabilization.6 The extracted EPS has also been proved to be an excellent biosorbent for the removal of metal ions from aqueous single-metal solutions.5,11,12 Zhang et al.13 mentioned that the concentrations of proteins (23.9 mg g−1 VSS) and polysaccharides (14.6 mg g−1 VSS) reached peak values after aerobic digested for 9 h, and were 48.3% and 48.5% higher than those from the original WAS, respectively. Zhou et al.11 mentioned that the maximum adsorption capacity of the biopolymers from WAS for Pb2+ reached 793.61 mg g−1, which is markedly higher than those of the reported adsorbents. However, how the STAD process affects the production and adsorption capacity of the EPS with different layers in WAS is rarely studied previously.
In this study, we systematically investigated the influencing features of the STAD process on the spatial distribution and the adsorption capacity of the EPS in WAS, containing the variations of the slime, the loosely bound EPS (LB-EPS), the tightly bound EPS (TB-EPS), and three-dimensional excitation emission matrix (3D-EEM) fluorescence spectra of the different layers of EPS. The extracted total EPS were used to adsorb the Pb2+ from water and the contribution of different layers of EPS on the Pb2+ adsorption capacity was analyzed. The fourier transform infrared (FTIR) spectroscopy spectra of EPS before and after aerobic digestion were also studied.
2. Materials and methods
2.1 Experiment setup
The experiments were carried out in a fermenter (NBS 115, Eppendorf, Germany) with an effective volume of 7.5 liters. The returned activated sludge was collected from a wastewater treatment plant located in Ningbo city, China which dealt with the municipal wastewater using A2/O process. Four liters of activated sludge were filled in the jar of fermenter and aerated by filtered air with the flow rate of 4.0 L min−1. As for the STAD process, the dissolved oxygen (DO) maintained at 2–3 mg L−1 by air aeration. Each process continued for 4 h and every experiment was run in triplicate. All samples were collected every one hour to analyse the distribution and contents of different layers of EPS.2.2 Extraction of different layers of EPS from WAS
Slime-EPS: 25 mL WAS was taken into a centrifugal tube with the effect volume of 50 mL by a syringe equipped on the fermenter. The tube was centrifuged at 550 rpm for 15 min and the supernatant is slime-EPS. Then the excess supernatant was decanted and refilled with 0.01 mol L−1 NaCl solution to 25 mL. The solution and the sediments were shocked thoroughly and sonicated at 120 W for 2 min; then suffered from centrifugation at 12000 rpm for 10 min. The supernatant was the LB-EPS. Similarly, the NaCl solution was added into the tube and re-suspended again. The only difference was that the mixture was sonicated at higher power, 210 W for 4 min followed by the same centrifugation. The supernatant obtained was the TB-EPS.
2.3 Adsorption of Pb2+ by EPS from WAS
5 mL of the different layers of extracted EPS and 1 mL stock solution (1000 mg L−1) of Pb2+ was spiked into a 50 mL centrifugal tube. Add ultrapure water to make up to 20 mL and adjust the initial pH to 4.5 with the solution of 0.1 mol L−1 HNO3 and 0.1 mol L−1 NaOH. Shock at 25 °C and 200 rpm for 2 h followed by 12000 rpm for 10 min. The supernatant was diluted to a proper concentration for the further determination. The supernatant after the adsorption of Pb2+ was diluted 10-fold to make the final concentration of Pb2+ below 5 mg L−1. The content of Pb2+ was determined by an Inductive Coupled Plasma Emission Spectrometer (PQ 9000 Elite, Germany). Pb2+ adsorption capacity was calculated according to eqn (1):| qe = (C0 − Ce)V/W | (1) |
2.4 Analytical methods
:200 (w/w). A Fourier transform-infrared spectrometer (FTIR, Nicolet 5700, USA) was applied to scan the functional groups at a range of 4000–400 cm−1.173. Results and discussion
3.1 Effects of STAD on the spatial concentrations of EPS in WAS
The influencing features of the STAD process on the spatial distribution of EPS in WAS are shown in Fig. 1. For slimes, the concentrations of both protein (PN) and polysaccharides (PS) slightly increased first and then decreased, and reduced about 74% and 50.7% after 4 h, respectively. Aeration scour to the sludge flocs promoted the release of the biopolymers, while some micro-organisms biodegraded the soluble organic matters. Therefore, the variation of the slimes might be resulted from the combined action of aeration scour to the sludge flocs and biodegradation of the released biopolymers.13,18 For LB-EPS, both PN and PS initially increased and then decreased, and the increased proportion for PN and PS reached the maximum value of 36.2% and 20.7% after 2 h and 1 h, respectively. Initially, aeration scour dominantly caused the release of the biopolymers from sludge flocs, which further resulted in the increase of LB-EPS. Later, most of LB-EPS released to the solution, leading to the decreased of LB-EPS concentration by biodegradation.13,18,19 For TB-EPS, PN only showed a slight increased but PS gradually increased with the improved proportion of 23.4% after air aerated for 4 h, which should be resulted from the new secreted biopolymers by the microorganisms.13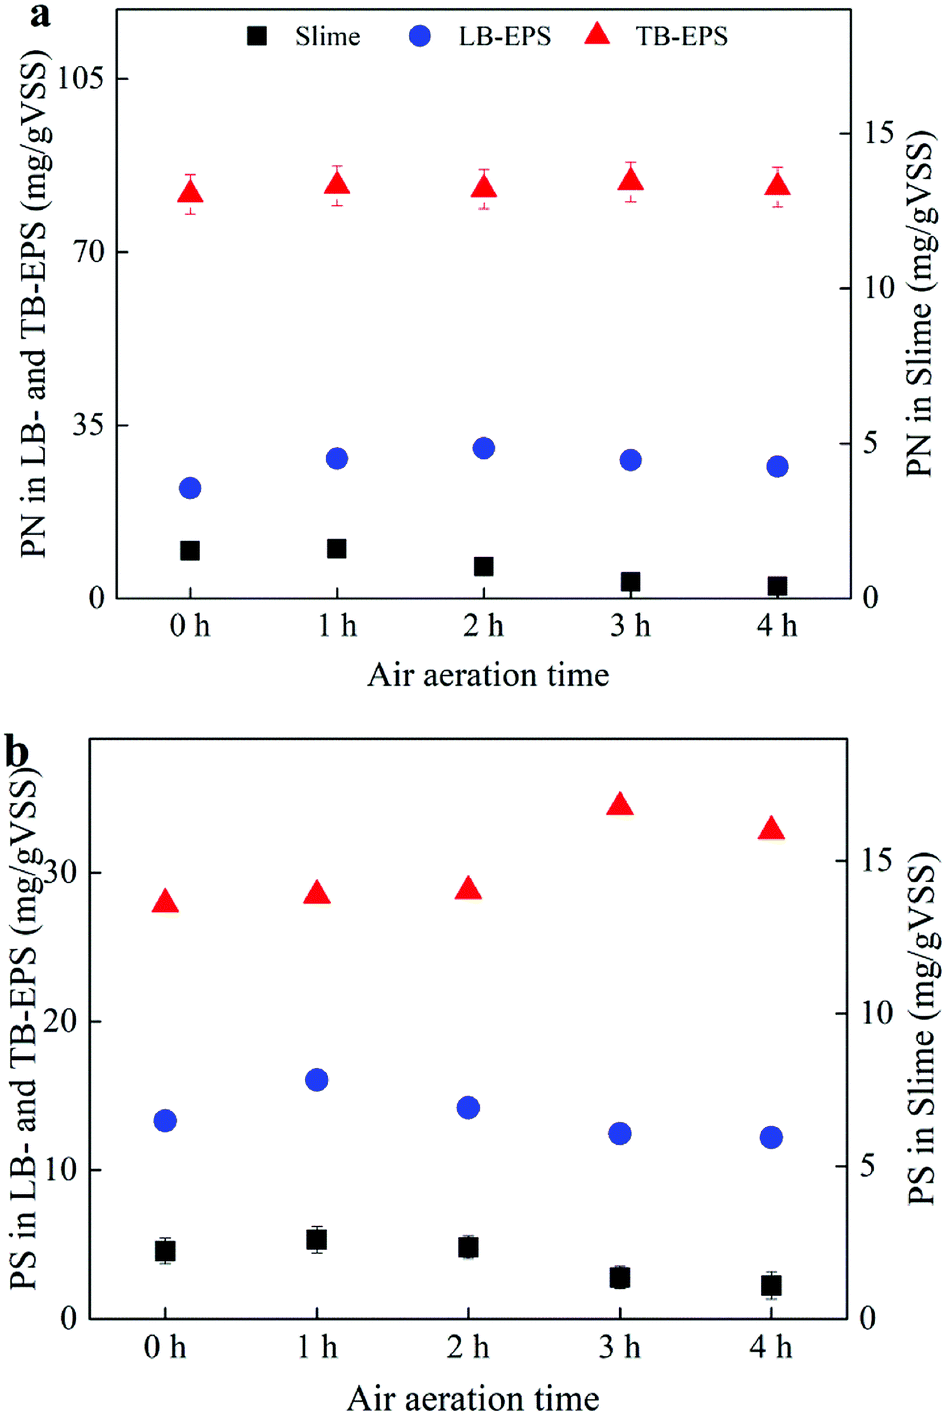 | ||
| Fig. 1 Effects of air aeration on the concentration of proteins (PN) and polysaccharides (PS) in slime, LB-EPS and TB-EPS. | ||
3.2 Effects of STAD on the spatial fluorescence spectra of EPS in WAS
The 3D-EEM fluorescence spectra of TB-EPS from activated sludge after STAD for 0 h and 4 h are shown in Fig. 2. Two main peaks could be identified from the fluorescence spectra. Peak A, with the Ex/Em of 220/330–350 nm, was associated with aromatic protein-like substances, and peak B with the Ex/Em of 280–285/335–355 nm was associated with tryptophan protein-like substances.20–22 The fluorescence intensities (FI) of peaks A and B in slime decreased about 46.7% and 45.5% by using air aeration for 4 h, respectively, which should be resulted from the biodegradation of organic matters by microorganisms in activated sludge.13,18 In LB-EPS, the FI of peaks A and B increased about 23.4% and 48.0% after 1 h of air aeration, respectively, but which gradually decreased latterly. Initially, aeration scour dominantly caused the release of LB-EPS from sludge flocs, leading to the increase of FI for both peaks A and B. Biodegradation of LB-EPS was the dominant latterly as most of LB-EPS released to the solution, leading to the decrease of FI for both peaks A and B.13,18,19 In TB-EPS, the FI of peaks A and B gradually increased during air aeration, and increased about 39.7% and 87.9% after air aerated for 4 h, respectively.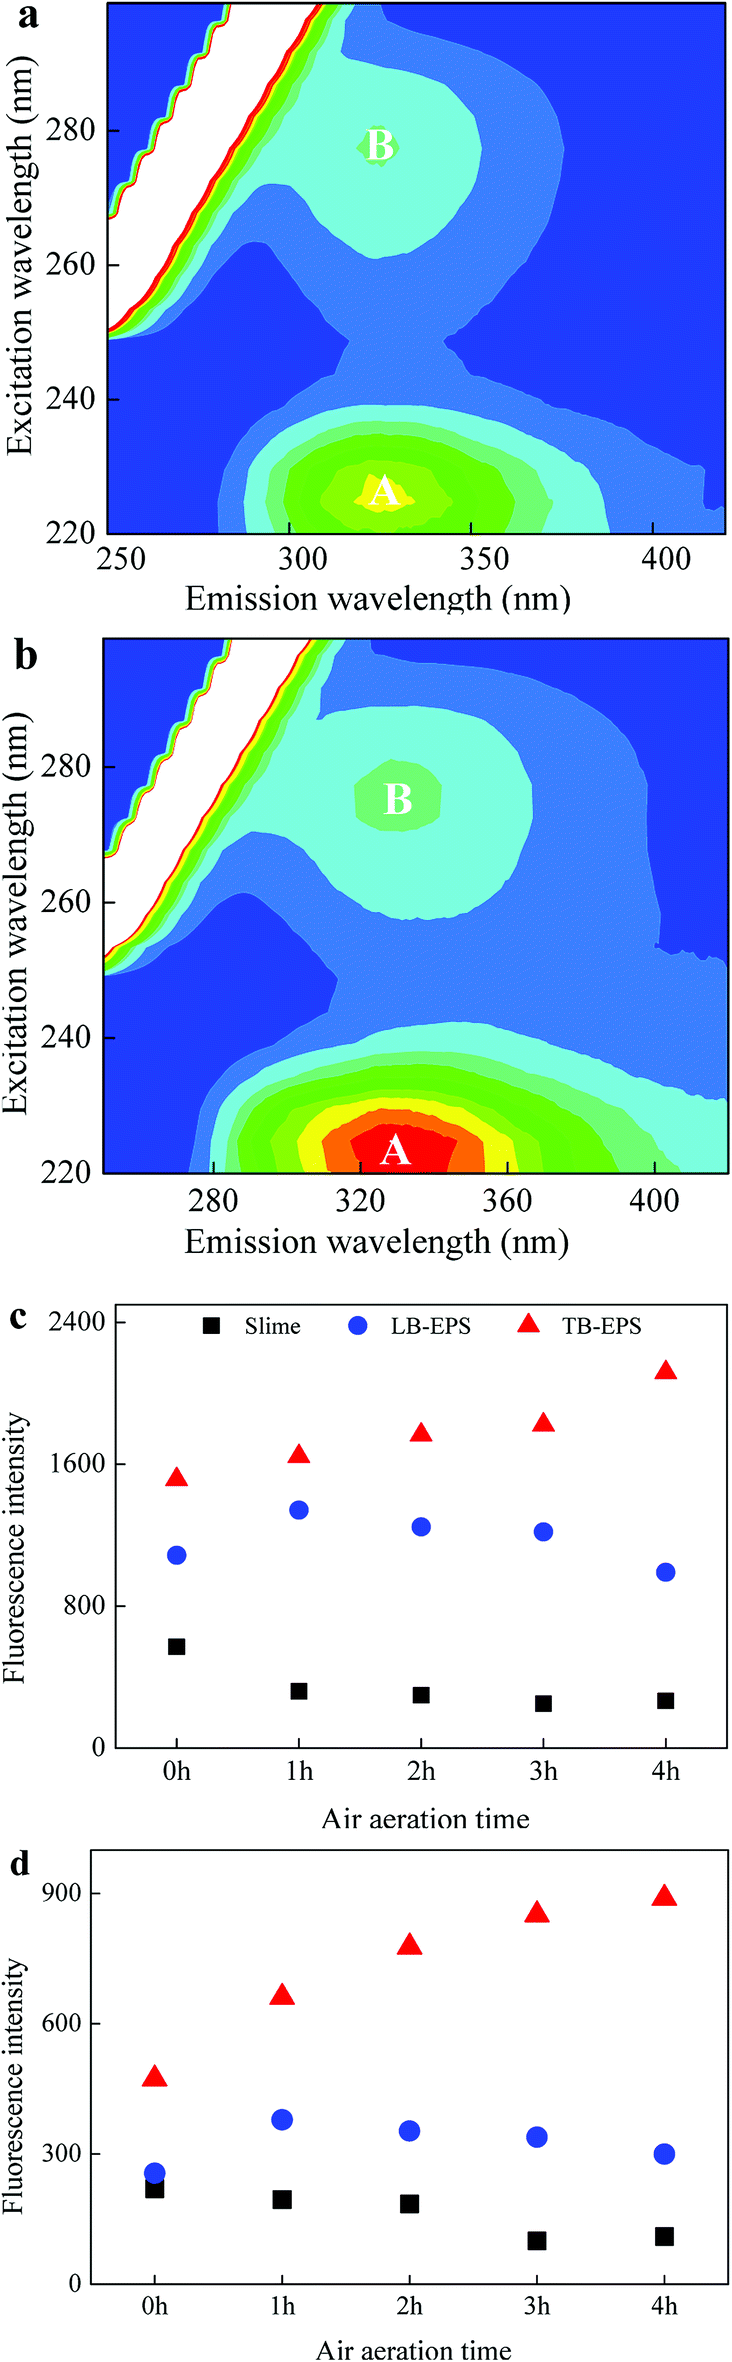 | ||
| Fig. 2 EEM spectra of TB-EPS after air aerated for (a) 0 h and (b) 4 h and the fluorescence intensities of (c) peak A and (d) peak B at the noted air aeration times. | ||
3.3 Effects of STAD on the spatial functional groups of EPS
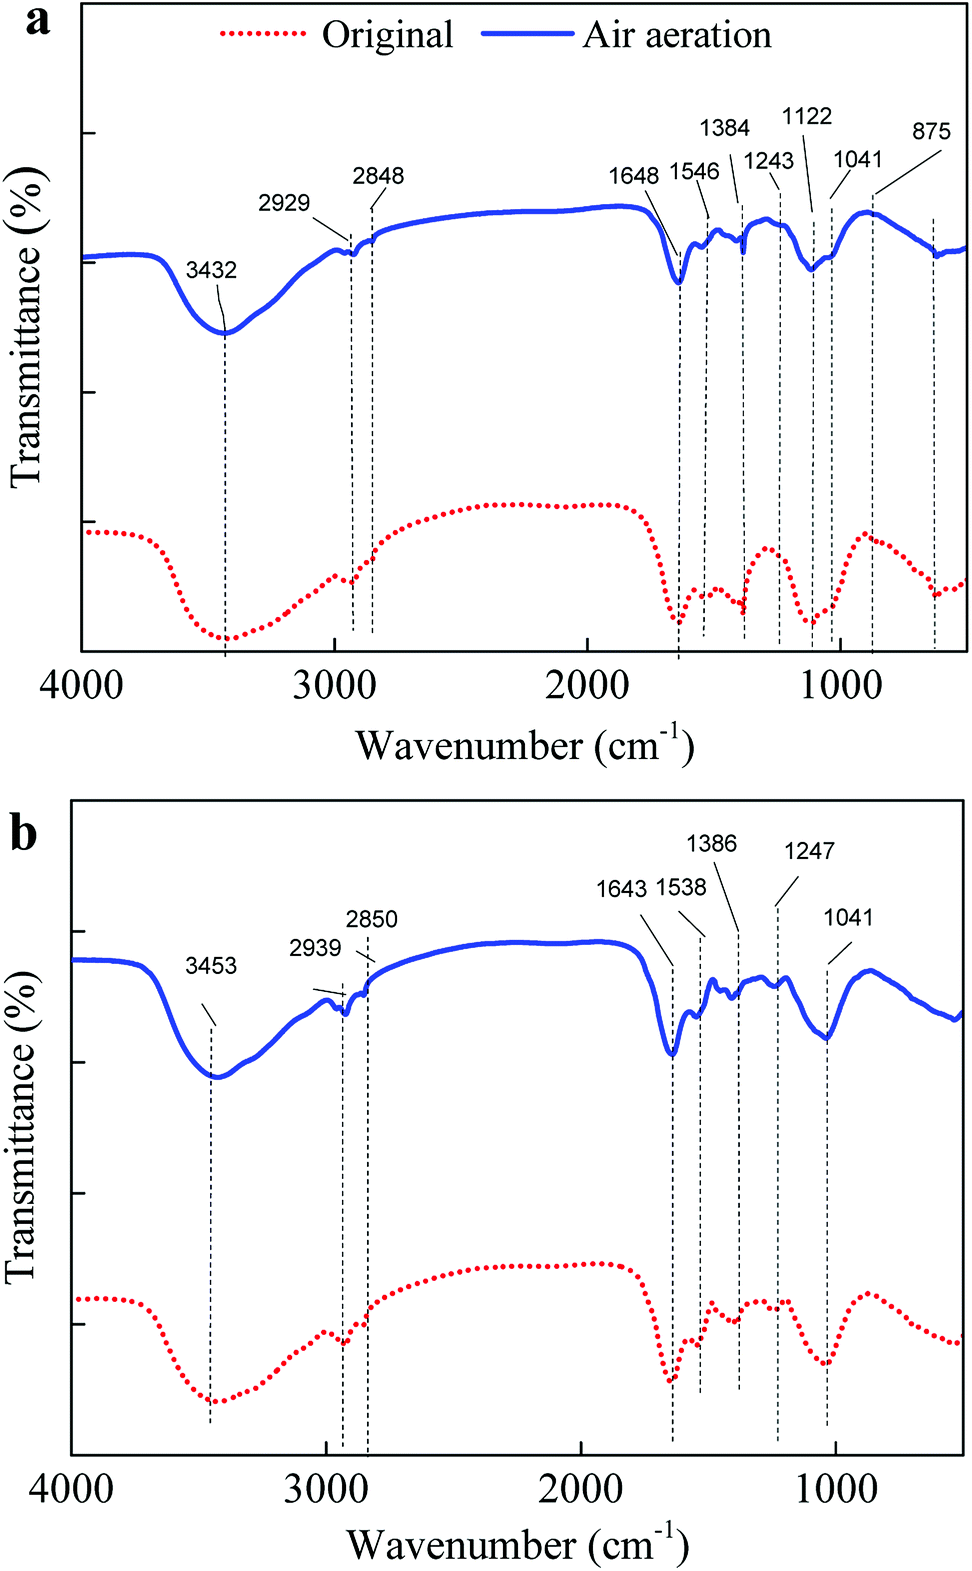
In view of the very small proportion of Slime-EPS in all EPS, LB-EPS and TB-EPS were discussed with emphasis in the following discussion. Fig. 3(a) and (b) shows the functional groups region in FTIR spectra of LB-EPS and TB-EPS from activated sludge before and after the STAD process for 4 h, respectively. All of the samples display a broad stretching intense peak between 3420–3440 cm−1 characteristic for –OH (mainly existing in the phenolic, alcoholic hydroxyl and polysaccharide) and –NH2.22–24 The adsorption peak between 2950 and 2920 cm−1 indicates the asymmetric stretching vibration of –CH2–.11,25 The absorption bands at around 1650 cm−1 characteristic for stretching vibration of –COOH.3,23 The adsorption band at 1542 cm−1 characteristic for stretching vibration of C–N and deformation vibration of N–H of amide II in proteins.3,23 The adsorption band at between 1410–1385 cm−1 characteristic for stretching vibration of C![[double bond, length as m-dash]](https://www.rsc.org/images/entities/char_e001.gif) O and deformation vibration of –OH, which were contained in carboxylates and phenolic hydroxyl, respectively.3,22 The adsorption peak between 1190–1000 cm−1 indicates the stretching vibration of CC and asymmetric stretching vibration of C–O–C.26 The adsorption band at 1243 cm−1 characteristic for stretching vibration of C–O.27
O and deformation vibration of –OH, which were contained in carboxylates and phenolic hydroxyl, respectively.3,22 The adsorption peak between 1190–1000 cm−1 indicates the stretching vibration of CC and asymmetric stretching vibration of C–O–C.26 The adsorption band at 1243 cm−1 characteristic for stretching vibration of C–O.27
 | ||
| Fig. 3 FTIR spectra of (a) LB-EPS and (b) TB-EPS from the activated sludge before and after aerobic digested for 4 h. | ||
After STAD for 4 h, the peaks intensity between 3420–3440 cm−1 indicates for –OH and –NH2, 1410–1385 cm−1 indicates for stretching vibration of CO and deformation vibration of –OH, and 1190–1000 cm−1 indicates for the stretching vibration of CC and asymmetric stretching vibration of C–O–C in both LB-EPS and TB-EPS obviously increased. Previous studies11,12,24 mentioned that the functional groups in biopolymers from activated sludge responsible for the adsorption of Pb2+ majorly consisted of –OH, –NH2, –CH2–, –COOH, C–N, N–H, CO, CC, C–O and C–O–C. Results showed that STAD could improve the contents of functional groups responsible for the binding of heavy metals, resulting in the increased adsorption capacity of EPS for Pb2+.
3.4 Effects of STAD on the adsorption capacity of EPS in WAS
Table 1 shows the adsorption capacity of Pb2+ by slime-EPS, LB-EPS and TB-EPS from the digested activated sludge. The adsorption capacity of Pb2+ by LB-EPS, TB-EPS and total EPS gradually increased with the increasing of STAD time. Especially, LB-EPS shows the highest Pb2+ adsorption capacity compared with TB-EPS, and Pb2+ adsorption capacity by LB-EPS increased by 28.2% after STAD for 4 h.| Samples | Pb2+ adsorption capacity (qe, mg g−1 EPS) | |||
|---|---|---|---|---|
| Slime-EPS | LB-EPS | TB-EPS | Total EPS | |
| WAS | 40.7 ± 0.5 | 396.1 ± 2.9 | 193.4 ± 5.7 | 630.2 ± 6.4 |
| STAD-2 h | 30.2 ± 0.4 | 421.6 ± 6.4 | 240.5 ± 4.7 | 692.3 ± 7.9 |
| STAD-4 h | 19.1 ± 0.2 | 507.7 ± 7.1 | 265.2 ± 10.2 | 792.0 ± 12.4 |
Table 2 shows the linear relationship coefficients between the concentration of EPS fractions and Pb2+ adsorption capacity. Adsorption capacity of Pb2+ is not significantly correlated with the fractions in slime-EPS. In contrast, the fractions in both PS and PN in LB-EPS and TB-EPS show a strong and nearly linear relationship with the adsorption capacity of Pb2+. Liu et al. found high content of protein was the main reason for the excellent adsorption performance of aerobic granular sludge EPS for Pb(II), Cd(II) and Zn(II) removal.28 Previous studies29 also showed that protein in the biopolymers extracted from WAS play a key role in the binding of heavy metals.
| a * means P < 0.05 and ** means P < 0.01. | ||||
|---|---|---|---|---|
| Pb2+ adsorption capacity | Slime-PN | Slime -PS | Slime-Peak A | Slime-Peak B |
| 0.549 | 0.488 | 0.547 | 0.618 | |
| LB-PN | LB-PS | LB-peak A | LB-peak B | |
| 0.844* | 0.780* | 0.587 | 0.811* | |
| TB-PN | TB-PS | TB-peak A | TB-peak B | |
| 0.863* | 0.917** | 0.919** | 0.885** | |
3.5 Mechanisms of EPS spatial distribution and adsorption capacity influenced by STAD
The sludge flocs can be divided into three parts, as illustrated in Fig. 4a. The outer layer is a dispersible part, in which the microbial cells in WAS are attached by the readily extractable EPS, known as slime-EPS. The middle layer is a denser part, where the microbial cells are glued by LB-EPS. The inner layer is a densest and stable one, in which the sludge cells are embedded in the non-readily extractable EPS, i.e., the TB-EPS. With the aeration time increased, the sludge flocs underwent a continuously increasing air scour, which at first exert a powerful mechanic shear on the slime to make the extraction easier. At the same time, the air stir and mechanic shear produced more free cells and provided those cells more opportunities to contact with eluted slime-EPS. As there were limited carbon and nitrogen (phosphorus) sources in WAS and mixed liquid, some bacteria started to degrade the biopolymer secreted by other microbes.30 From Fig. 1b, the polysaccharides in LB-EPS decreased more rapidly than the protein in the later phase of aeration, which was accordance with the literature.31 Meanwhile, plenty of enzymes existed in the WAS which can degrade the biopolymers, such as proteins and polysaccharides.1 The combined actions of elution and biodegradation made the contents of slime-EPS first increase and then decrease.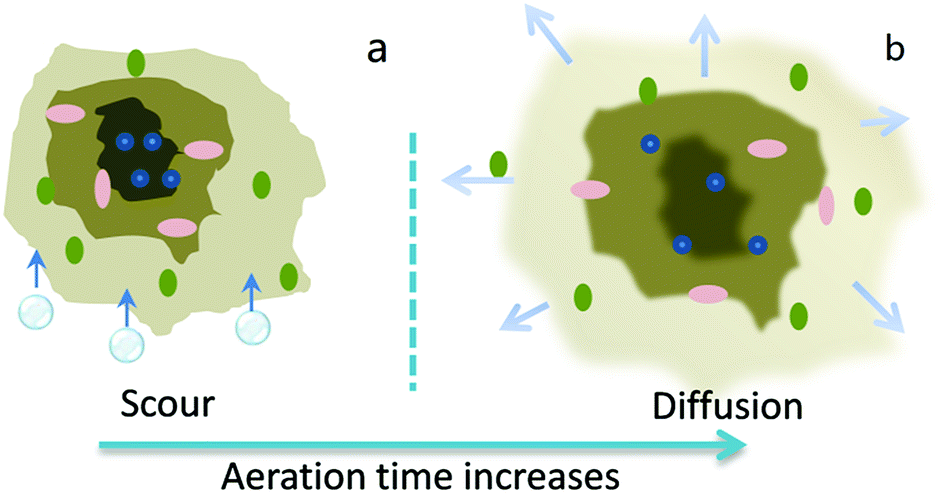 | ||
| Fig. 4 A schematic diagram of roles of aeration on the sludge flocs before (a) and after (b) the aeration. | ||
The components of EPS often contain the hydrophilic and hydrophobic groups in the different layers resulted in the amphoteric attribute of EPS.32 The hydrophobic fraction is made up of proteins and the hydrophilic fraction mainly consisted of carbohydrates. The hydrophilic substances in LB-EPS and TB-EPS, in turn, were steeped in mixed liquid and swelled after imbibing water, some of them even dissolved and diffused into the water (see Fig. 4b), which made the flocs structure vulnerable. Consequently, the sludge flocs undergoing the air scour became porous and permeable and some flocs suffered with the deflocculation. As a result, the oxygen and mass transfer were enhanced to some degree. Shin et al.33 reported that a higher dissolved oxygen favored the increase of carbohydrates with the increase of the aeration time. The microbes in the inner EPS layer were exposed and new EPS components were produced by utilizing the degradation products of outer EPS layer. Therefore, a new biosynthesis occurred in the aeration process and contributed a portion to the increase of LB-EPS and TB-EPS. Actually, a decrease of contents of polysaccharide in LB-EPS was followed by an increase of that in TB-EPS (Fig. 1b), indicating that the biodegradation products of LB-EPS took part in the biosynthesis of the TB-EPS.
In general, the adsorption of metal by EPS can go through with electrostatic interactions and complexation, which depends on the negatively or positively charged functional groups, such as uronic acid group and hydroxyl group in carbohydrates, carboxylic group of amino acids in protein fractions and some negatively charged amino acids in polysaccharides and protein fractions, for example, the aspartic and glutamic acid. Changes in EPS fractions can affect the variety, quantity or ratio of functional groups which participates in metal binding. As a result, the metal binding efficiency will be altered.34 In this study, the hydroxyl group and carboxylic group in LB-EPS and TB-EPS increased after aeration (Fig. 3), which contributed to the increase of adsorption capacity although the contents of LB-EPS had a slight decrease (see Table 1 and Fig. 1). As for TB-EPS, the FI of peak A and peak B strengthened much with the increase of aeration time. However, the contents of protein measured by chemical analysis method just had a slight increase (Fig. 1a), demonstrating that new kinds of protein which had more fluorescent constituents were synthesized accompanying the degradation of original proteins.
4. Conclusions
The present study disclosed the influencing features of the STAD process on the spatial distribution and the adsorption capacity of the EPS in WAS. During the STAD process, the concentrations of both slimes and LB-EPS initially increased and then decreased, while those of TB-EPS gradually increased all the way. The variations for the fluorescence intensities of peaks A and B in slime, LB-EPS and TB-EPS were consistent with the above concentration variations. The adsorption capacity of Pb2+ by LB-EPS, TB-EPS and total EPS gradually increased with the increasing of STAD time, suggesting that the LB-EPS and TB-EPS played a key role in the adsorption of Pb2+ and the LB-EPS had a higher adsorption capacity. FTIR results further indicated that STAD could improve the contents of functional groups, especially for –OH, –COOH and –NH2 in both LB-EPS and TB-EPS responsible for the binding of heavy metals, resulted to the increased adsorption capacity of EPS for Pb2+.Conflicts of interest
There are no conflicts to declare.Acknowledgements
This work was supported by the Foundation of State Key Laboratory of Pollution Control and Resource Reuse (Tongji University), China (No. PCRRE16019); National Key R&D Program of China (No. 2017YFC0403400); the Fundamental Research Funds for the Central Universities; National Natural Science Foundation of China (No. 51678422 and No. 51378368); and the higher school innovative engineering plan (111 Project).References
- G.-P. Sheng, H.-Q. Yu and X.-Y. Li, Biotechnol. Adv., 2010, 28, 882–894 CrossRef PubMed.
- W. W. Li and H. Q. Yu, Bioresour. Technol., 2014, 160, 15–23 CrossRef PubMed.
- G. Guibaud, S. Comte, F. Bordas and M. Baudu, Process Biochem., 2005, 40, 661–668 CrossRef.
- D. Wei, M. Li, X. Wang, F. Han, L. Li, J. Guo, L. Ai, L. Fang, L. Liu and B. Du, J. Hazard. Mater., 2016, 301, 407–415 CrossRef PubMed.
- Z. Zhang, Y. Zhou, J. Zhang and S. Xia, Environ. Sci. Pollut. Res., 2014, 21, 2132–2140 CrossRef PubMed.
- Z. Zhang, J. Zhang, J. Zhao and S. Xia, Environ. Sci. Pollut. Res. Int., 2015, 22, 1812–1818 CrossRef PubMed.
- D. T. Sponza, Process Biochem., 2002, 37, 983–998 CrossRef.
- B. Durmaz and F. D. Sanin, Water Sci. Technol., 2001, 44, 221–229 CrossRef PubMed.
- X. S. Jia, H. Furumai and H. H. P. Fang, Water Res., 1996, 30, 1439–1444 CrossRef.
- G.-P. Sheng, H.-Q. Yu and Z.-B. Yue, Appl. Microbiol. Biotechnol., 2005, 69, 216–222 CrossRef PubMed.
- Y. Zhou, S. Xia, J. Zhang, Z. Zhang and S. W. Hermanowicz, Desalin. Water Treat., 2015, 1–11 Search PubMed.
- Y. Zhou, Z. Zhang, J. Zhang and S. Xia, J. Environ. Sci., 2016, 45, 248–256 CrossRef PubMed.
- Z. Zhang, Y. Zhou, J. Zhang, S. Xia and S. W. Hermanowicz, Chem. Eng. J., 2016, 299, 177–183 CrossRef.
- B. Frølund, T. Griebe and P. H. Nielsen, Appl. Microbiol. Biotechnol., 1995, 43, 755–761 CrossRef.
- A. P. H. Association, and A. W. W. Association, Standard methods for the examination of water and wastewater, American public health association, 1989 Search PubMed.
- N. Li, D. Wei, S. Wang, L. Hu, W. Xu, B. Du and Q. Wei, J. Colloid Interface Sci., 2016, 490, 754–761 CrossRef PubMed.
- W. Hou, Z. Ma, L. Sun, M. Han, J. Lu, Z. Li, O. A. Mohamad and G. Wei, J. Hazard. Mater., 2013, 261, 614–620 CrossRef PubMed.
- S. Xia, Y. Zhou, E. Eustance and Z. Zhang, Sci. Rep., 2017, 7, 13491 CrossRef PubMed.
- Y. Zhou, J. Zhang, Z. Zhang, C. Zhou, Y. S. Lai and S. Xia, Chem. Eng. J., 2017, 320, 494–500 CrossRef.
- Z. Wang, Z. Wu and S. Tang, Water Res., 2009, 43, 1533–1540 CrossRef PubMed.
- W. Chen, P. Westerhoff, J. A. Leenheer and K. Booksh, Environ. Sci. Technol., 2003, 37, 5701–5710 CrossRef PubMed.
- Y. Zhou, S. Xia, J. Zhang, B. T. Nguyen and Z. Zhang, Chem. Eng. J., 2017, 308, 1098–1104 CrossRef.
- G. Guibaud, N. Tixier, A. Bouju and M. Baudu, Chemosphere, 2003, 52, 1701–1710 CrossRef PubMed.
- Y. Zhou, S. Xia, Z. Zhang, J. Zhang and S. W. Hermanowicz, J. Environ. Eng., 2016, 142, 04016032 CrossRef.
- M. Iqbal, A. Saeed and S. I. Zafar, J. Hazard. Mater., 2009, 164, 161–171 CrossRef PubMed.
- G. Guibaud, S. Comte, F. Bordas, S. Dupuy and M. Baudu, Chemosphere, 2005, 59, 629–638 CrossRef PubMed.
- L. Wei, Y. Li, D. R. Noguera, N. Zhao, Y. Song, J. Ding, Q. Zhao and F. Cui, J. Hazard. Mater., 2017, 321, 473–483 CrossRef PubMed.
- W. Liu, J. Zhang, Y. Jin, X. Zhao and Z. Cai, J. Environ. Chem. Eng., 2015, 3, 1223–1232 CrossRef.
- Y. Zhou, Z. Zhang, J. Zhang and S. Xia, Chem. Eng. J., 2016, 304, 527–532 CrossRef.
- A. Pannard, J. Pédrono, M. Bormans, E. Briand, P. Claquin and Y. Lagadeuc, Aquat. Ecol., 2016, 50, 29–44 CrossRef.
- X. Zhang and P. L. Bishop, Chemosphere, 2003, 50, 63–69 CrossRef PubMed.
- F. Jorand, F. Boue-Bigne, J. Block and V. Urbain, Water Sci. Technol., 1998, 37, 307–315 CrossRef.
- H.-S. Shin, S.-T. Kang and S.-Y. Nam, Water Sci. Technol., 2001, 43, 193–196 CrossRef PubMed.
- K. Nouha, R. S. Kumar, S. Balasubramanian and R. D. Tyagi, J. Environ. Sci., 2018, 66, 225–245 CrossRef PubMed.
| This journal is © The Royal Society of Chemistry 2018 |