 Open Access Article
Insight into the significant roles of microstructures and functional groups on carbonaceous surfaces for acetone adsorption†
Xinning Yua,
Shaojun Liuab,
Guoxin Lina,
Xuecheng Zhua,
Shuo Zhanga,
Ruiyang Qua,
Chenghang Zhenga and
Xiang Gao *a
*a
aState Key Laboratory of Clean Energy Utilization, Zhejiang University, Hangzhou 310027, China. E-mail: xgao1@zju.edu.cn
bKey Laboratory of Low-grade Energy Utilization Technologies and Systems (Chongqing University), Ministry of Education of China, Chongqing University, Chongqing 400044, China
First published on 13th June 2018
Abstract
To understand the roles of pore structures and functional groups on acetone adsorption, activated carbons (ACs) with different properties were obtained by surface modification. XRD, SEM, TEM and nitrogen adsorption were used to identify the structural characteristics of the ACs, while TG-DTA, FTIR, XPS and Boehm titration were applied to analyse the surface chemistries. The microporous surface areas showed a positive linear correlation to the acetone adsorption amounts, and increasing the carboxylic groups could improve the uptake of strongly adsorbed acetone. HNO3 modified AC (AC-N) was found to exhibit an excellent adsorption capacity of 5.49 mmol g−1, which might be attributed to the developed microporous structures and abundant carboxylic groups. The desorption activation energies (Ed) of strongly adsorbed acetone on AC-N and AC were both determined to be 81.6 kJ mol−1, indicating the same adsorption sites on different activated carbons, suspected to be carboxylic groups. The possible adsorption mechanism of acetone on carbonaceous surfaces was also proposed.
1. Introduction
Volatile organic compounds (VOCs) are organic compounds whose boiling points range from 50 to 260 °C according to the definition of the World Health Organization (WHO). They are precursors of photochemical oxidants and some can be harmful to the human nervous system and may even cause cancer.1,2 Among them, acetone is a typical compound frequently detected in medicine, pesticide and chemical industries.3,4 Therefore it is critical to control the concentration of acetone in the air.5,6 A number of technologies have been investigated, including gas adsorption,7,8 catalytic oxidation,9,10 plasma-catalytic oxidation,11,12 etc. Adsorption that captures acetone on the surface of adsorbents has been widely used,13 and activated carbon (AC) is considered as an excellent adsorbent owing to its developed pore structure, high surface area, low cost, and high degree of surface reactivity.14–16 However, the structural and surface chemical properties of AC can be quite complicated, which have important effects on the adsorption capacity.17–19 Appropriate pore size distribution provides significant advantages to mass transfer,20 and specific functional groups can enhance the interaction between the carbon surface and adsorbates.21 On the other hand, the strong polarity of acetone molecular can also influence the adsorption procedure.22 Therefore, it's meaningful to give a clear relationship between physicochemical properties and adsorption amount in order to facilitate acetone removal by AC modification.Previous studies have discussed the influences of pore structures and chemistry properties of carbon surface on VOCs adsorption. Gil et al. obtained microporous carbon by modification with alkaline agents and found that the well-developed microporous structure could promote the adsorption of toluene from 27 mg g−1 to 288 mg g−1.23 Shu et al. introduced ultrasonic oscillation to prepare Fe-loaded activated carbon with different texture properties but similar surface functional groups, and results showed that micropores in the range of 0.7–2.0 nm could enhance adsorption significantly.24 Qi et al. synthesized spherical porous carbons with controllable pore structure, and proposed that microporosity played a key role in the adsorption of VOCs for carbon spheres with similar surface chemical properties.13 Research of Almazan et al. found that the presence of micropores with appropriate size to the pollutant molecular played an important role, while the introduction of oxygen containing groups inhibits the adsorption of n-alkanes and benzene.25 However, Ghimbeu et al. reported that oxygen containing groups could enhance the adsorption capacity, owing to a high-energy interaction between groups and ethanol adsorbates.26 Molecular simulation study by Liang et al. also confirmed that acetone adsorption capacity increased after inserting oxygen-containing functional groups.4
The debate around oxygen containing groups implied complexity concerning physico-chemical properties of carbon materials, as well as those of adsorbates.27 In fact, parts of pollutants are physically captured in pore channels which could easily desorbed by purging of gas flow, while others are strongly combined with functional groups as chemically adsorbed ones.28,29 Modification of ACs may change textural and chemical properties at the same time. Li et al. reported that the surface area of AC was increased while the amount of functional groups were reduced after treatment by alkalis.30 Zhou et al. modified AC by MgO and found that increasing of MgO content could greatly enhance the chemical property but suppress the physical property.31 Great efforts have been made to correlate physico-chemical properties and adsorption capacities of VOCs such as toluene, xylene and alkyl halides.32–34 Other than aforementioned VOCs, acetone is a typical strong polar VOC, which may exhibit different adsorption property to nonpolar or weak polar ones. Previous research regarding carbon-based acetone adsorption mainly focused on the micro or molecular mechanism.4,35,36 Few reports have focused on the modification method of ACs for acetone uptake from a practical point of view.
To clearly address above issues, the uniform substrate, namely, activated carbon derived from coconut shell was used and treated with HNO3, H2O2 or high temperature to obtain various pore structures and functional groups. The adsorption of acetone over different samples was performed and total adsorption capacity, purging desorption amount, thermal desorption amount and the residual amount of ACs were calculated separately. Based on the experimental evidence, effects of pore structures and surface functional groups of ACs on the capacities were discussed respectively. Relationships between micropores and acetone adsorption amounts were proposed. To further understand the interactions between acetone and functional groups, various characterization methods such as TG-DTA, FTIR, XPS and Boehm titration were used, combining with calculation of desorption activation energy. Carboxylic groups over carbon surface were tentatively ascribed as active sites, mainly governing the strongly absorbed acetone.
2. Experimental
2.1 Materials preparation
Coconut shell based activated carbon from Lvlin AC Plant in Henan province of China was selected in this study. Nitric acid (65–68 wt%) and hydrogen peroxide (30 wt%) of analytical grade were purchased from Sigma-Aldrich Crop.Before modification, the original activated carbon (denoted as AC) was washed with boiling water to remove fine particles. After dried at 383 K overnight, further treatments were carried out according to the treatment methods listed in Table 1. After modification, AC-N and AC-O were separated from the solution and rinsed with distilled water for several times until pH values reached 7, followed by drying at 383 K for 24 h.
| Treatment | Sample | Treatment method |
|---|---|---|
| HNO3 modification | AC-N | 5 g AC was soaked in 40 ml 30 wt% HNO3 solution under stirring at 333 K for 2 h |
| H2O2 oxidation | AC-O | 5 g AC was soaked in 40 ml 30 wt% H2O2 solution under stirring at 333 K for 2 h |
| Heat treatment | AC-T | 5 g AC was heated in N2 at 1073 K for 2 h with a heating rate of 5 K min−1 |
2.2 Characterization
Field emission scanning electron microscopy (FE-SEM) images were recorded on a Hitachi SU8010 field emission microscope by depositing samples on the specimen-stubs with conductive sticky tapes.
Transmission electron microscopy (TEM) images were obtained using a JEM-2100 microscope operated with an acceleration voltage of 200 kV. The samples were prepared by a suspension in ethanol, followed by evaporating onto a carbon-coated copper grid.
Nitrogen sorption analysis was taken at 77 K using a Micromeritics Instrument Corporation (Norcross, Georgia) ASAP 2020 system. The total specific surface areas were calculated by Brunauer–Emmett–Teller (BET) equation at p/p0 = 0.01–0.09, while the micropore surface areas were measured using the t-plot method. Total pore volume was determined from the amount of adsorbed N2 at p/p0 = 0.95, and the micropore volume was determined by Horvath Kawazoe (HK) methods. The pore size distribution was calculated using the Density Functional Theory (DFT).
Fourier transform infrared spectroscopy (FTIR) was carried out to analyse the surface functional groups using a Nicolet 5700 spectrometer. The samples were mixed with KBr by a mass ratio of 1![[thin space (1/6-em)]](https://www.rsc.org/images/entities/char_2009.gif) :
:![[thin space (1/6-em)]](https://www.rsc.org/images/entities/char_2009.gif) 700 and ground into fine powers in an agate mortar. The background was subtracted automatically and the spectrum was obtained with the frequency ranging from 4000 to 400 cm−1.
700 and ground into fine powers in an agate mortar. The background was subtracted automatically and the spectrum was obtained with the frequency ranging from 4000 to 400 cm−1.
The surface chemical composition was collected by X-ray photoelectron spectroscopy (XPS) with a Thermo ESCALAB 250Xi using Al Kα X-ray source (hν = 1486.6 eV). To compensate for surface charge, the binding energies of C 1s were calculated in reference to the C 1s of hydrocarbon with peak centering at 284.6 eV.
Amount of surface functional groups such as phenolic group (–OH), lactonic group (C![[double bond, length as m-dash]](https://www.rsc.org/images/entities/char_e001.gif) O), carboxylic group (COOH) and basic groups were determined by Boehm titration.37 The bases used were NaOH, Na2CO3, NaHCO3, and the acid used was HCl. Acidic sites number was determined with the assumptions that carboxylic group neutralized by NaOH, Na2CO3, and NaHCO3, lactonic group neutralized by NaOH and Na2CO3, and phenolic group only neutralized by NaOH. Basic sites number was calculated from the amount of neutralized HCl.
O), carboxylic group (COOH) and basic groups were determined by Boehm titration.37 The bases used were NaOH, Na2CO3, NaHCO3, and the acid used was HCl. Acidic sites number was determined with the assumptions that carboxylic group neutralized by NaOH, Na2CO3, and NaHCO3, lactonic group neutralized by NaOH and Na2CO3, and phenolic group only neutralized by NaOH. Basic sites number was calculated from the amount of neutralized HCl.
2.3 Acetone adsorption/desorption test
To study the roles of structural characteristics and surface chemistries on acetone removal, the adsorption/desorption curves were evaluated using a fixed-bed reactor with a quartz flow tube (8 mm inner diameter). For a typical adsorption process, 200 mg of sample (30–60 meshes) was placed in the quartz tube with a reaction temperature of 300 K. The total flow rate was 250 ml min−1, corresponding to a gas hourly space velocity (GHSV) of 30![[thin space (1/6-em)]](https://www.rsc.org/images/entities/char_2009.gif) 000 h−1. The inlet gas mixture was consisted with 500 ppm of acetone and a balance of N2, controlled by mass flow controllers. Before each test, the sample was purged with N2 for 2 h. The outlet flow was continuously analysed with a FTIR gas analyser (Gasmet DX-4000) to obtain the acetone breakthrough curve.
000 h−1. The inlet gas mixture was consisted with 500 ppm of acetone and a balance of N2, controlled by mass flow controllers. Before each test, the sample was purged with N2 for 2 h. The outlet flow was continuously analysed with a FTIR gas analyser (Gasmet DX-4000) to obtain the acetone breakthrough curve.
After the outlet concentration of acetone reached equilibrium, the gas mixture was replaced by N2 until the outlet concentration of acetone reached zero. Then, temperature programmed desorption of acetone was carried out in the temperature range from 300 K to 600 K, with a heating rate of 10 K min−1. In parallel tests, the procedure followed the above protocol except N2 purge.
For a typical temperature programmed process, the relationship between time t (min) and temperature T (K) could be described by eqn (1):
 | (1) |
Accordingly, the total adsorption amount of acetone was calculated by the integration of breakthrough curves, as shown in eqn (2):
 | (2) |
The thermal desorption amount of strongly adsorbed acetone was calculated by the integration of desorption curves after N2 purging, as shown in eqn (3):
 | (3) |
The purging desorption amount of acetone was calculated by the difference between integration of desorption curves with or without N2 purging, as shown in eqn (4):
 | (4) |
The residual amount of acetone in ACs was calculated as eqn (5):
| qres = qtot − qther − qpur | (5) |
3. Results and discussion
3.1 Adsorption properties of acetone
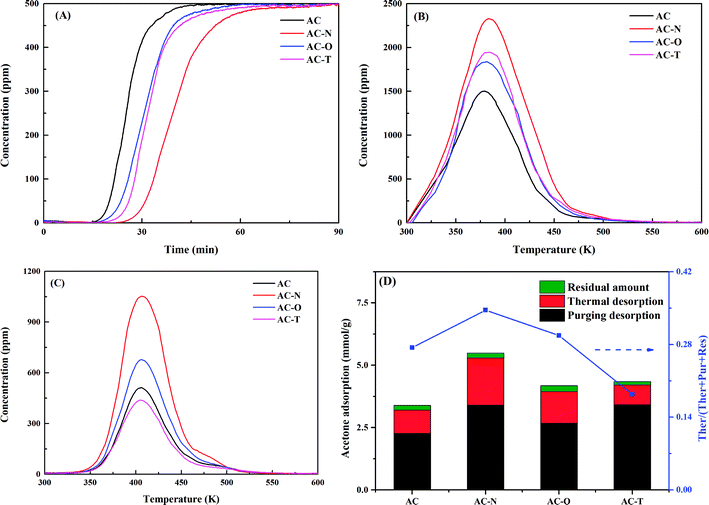
The adsorption and desorption behaviours of acetone were examined on all of the ACs investigated, as shown in Fig. 1A–C. In order to verify the accuracy of adsorption experiment, variation of acetone adsorption amount on AC-N during repetitive tests were further shown in Fig. S1.† It could be noticed that the adsorption amounts were in a small range of 5.484 to 5.495 mmol g−1, so the results were credible. The desorption peaks of total adsorbed acetone in Fig. 1B were around 384 K, which were higher than the boiling point of acetone (329 K). Therefore, it was implied that condensation of acetone was not the only way for its adsorption. The difference of curves in Fig. 1B and C was due to the purging desorption amount of acetone, and thermal desorption curves after N2 purging in Fig. 1C could be mainly ascribed to strongly adsorbed acetone.27 Amounts of purging desorption, thermal desorption and the residual acetone of ACs were further summarized in Fig. 1D and Table 2. Modification by HNO3 increased the total adsorption amount by 62.3% compared with original AC, from 3.39 mmol g−1 to 5.49 mmol g−1. Heat treatment expanded the value to 4.35 mmol g−1, which was larger than 4.18 mmol g−1 stored on H2O2 treated one. Concerning thermal desorption amount of strongly adsorbed acetone, promoting effect was found for HNO3 modification and H2O2 oxidation. However, there was a slight decrease after heat treatment. It was interesting to notice that AC-T showed the lowest thermal desorption amount, while its total adsorption amount was in the second place. The contributions of thermal desorption to total adsorption followed the order AC-N > AC-O > AC > AC-T. The reusability of AC-N was also studied by thermal treatment in N2 after adsorption saturation. As illustrated in Fig. S2,† AC-N could afford 85.4% of the initial adsorption capacity for the second run. Although the adsorption capacity appeared to decrease after the first cycle, the second to fourth cycles showed little effect on the adsorption capacities. Finally, 85% of the initial adsorption capacity could be reached after four cycles.| Samples | AC | AC-N | AC-O | AC-T |
|---|---|---|---|---|
| Total BET surface area (m2 g−1) | 283 | 382 | 301 | 399 |
| Microporous surface area (m2 g−1) | 221 | 329 | 270 | 294 |
| Total pore volume (cm3 g−1) | 0.157 | 0.228 | 0.203 | 0.239 |
| Micropore volume (cm3 g−1) | 0.113 | 0.167 | 0.133 | 0.150 |
| Adsorption amount (mmol g−1) | 3.39 | 5.49 | 4.18 | 4.35 |
| Purging desorption amount (mmol g−1) | 2.27 | 3.4 | 2.68 | 3.41 |
| Thermal desorption amount (mmol g−1) | 0.93 | 1.90 | 1.27 | 0.80 |
| Residual amount (mmol g−1) | 0.19 | 0.19 | 0.23 | 0.14 |
| Adsorption rate constant (min−1) | 0.063 | 0.032 | 0.047 | 0.041 |
Dynamic adsorption curves of acetone were further shown in Fig. S3† to investigate the adsorption kinetics on various activated carbons. The liner driving force (LDF) model was used to fit the adsorption kinetics of acetone, which was the most widely used uptake rate approximation model for activated carbon and other porous materials.38,39 The LDF model could be described as follow:13
 | (6) |
Eqn (6) can be further represented as follow:
 | (7) |
Based on the plot of ln(1 − Mt/Me) and t showed in Fig. S1B,† the rate constant (k) of various activated carbons were summarized in Table 2. All samples presented a good linear relationship with R2 > 0.97. The results showed that AC had the greatest rate constant of 0.063 min−1, while the rate constant of AC-N was only 0.032 min−1. AC-O and AC-T exhibited rate constants of 0.047 and 0.041 min−1, respectively. The adsorption rate constants followed the same order with adsorption amounts, which was in accordance with the breakthrough curves in Fig. 1A. This might be caused by the more complexity of porous structures after surface modification, which might slow down the diffusion and transport of acetone in the pore channels. The relationships between adsorption behaviours and the surface characteristics of ACs would be discussed in the later section.
3.2 Effects of pore structures on acetone adsorption
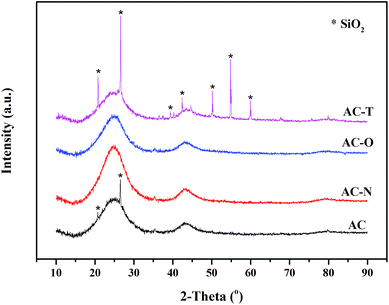
The crystallinity of ACs were characterized by wide-angle XRD patterns as shown in Fig. 2. The diffraction shoulder at 2θ = 20–30° and the broad diffraction peak at around 43° of all samples could be indexed as aromatic layers.40 For AC without treatment, diffraction peaks at 20.8° and 26.6° were corresponding to (1 0 0) and (1 0 1) direction of SiO2 (JCPDS 46-1045), respectively. While for AC-N and AC-O, diffraction peaks of SiO2 disappeared. As HNO3 and H2O2 were commonly used in the demineralization of activated carbons, this might be contributed to the reaction between mineral substance and the chemical reagents.41 It could also be seen that the intensity of diffraction peaks at 20.8° and 26.6° increased after heat treatment for AC-T, and more diffraction peaks representing SiO2 (at 39.5°, 42.5°, 50.1°, 54.9°, 60.0°, JCPDS 46-1045) were found, illustrating the greater crystallinity degree of AC-T than AC.42 Small-angle XRD was also performed to study the order of structure, as shown in Fig. S4.† No obvious peaks were found at 2θ = 1–10° for all samples, indicating that the pore structures of ACs were disordered.The micromorphology of ACs was viewed by SEM and TEM. SEM images at 5 K times were displayed in Fig. 3A–D. It could be seen that the surface of original AC was relatively smooth without large cavities from except for some occasional cracks, while all modified ACs showed external surfaces covered with irregular holes of different sizes and shapes. The cavities on the surface of carbons might be resulted from the reaction between AC and chemical agents or high temperature treatment. TEM images in Fig. 3E–H showed the presence of dense micropores on the surface of activated carbons. Abundant disordered nanopores were observed for all samples. It was also noticed that no lattice fringes of carbon skeletons were found, indicating the amorphous phase of carbon. While for AC after heat treatment, the crystalline particles could be attributed to the SiO2 crystal according to XRD results.
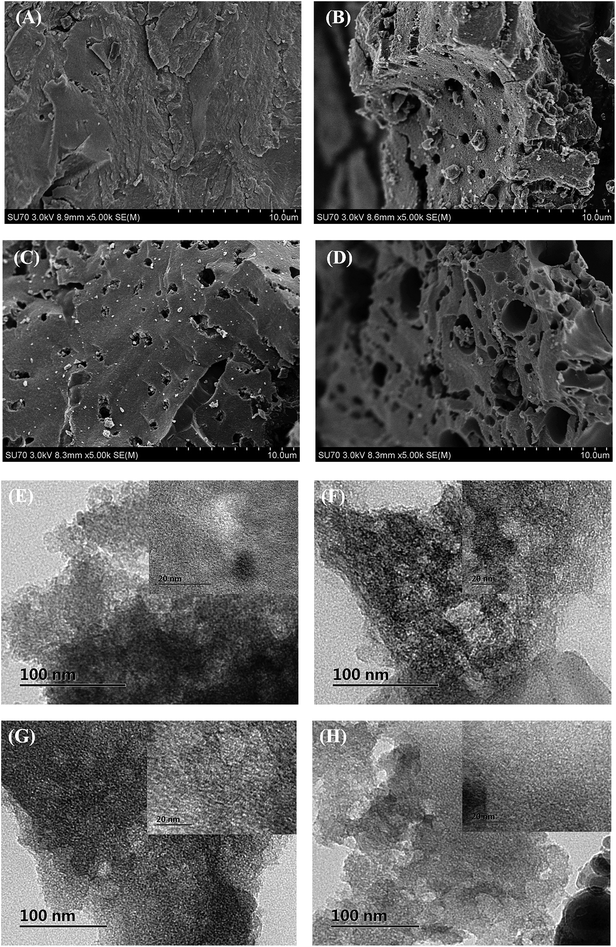 | ||
| Fig. 3 SEM images of (A) AC, (B) AC-N, (C) AC-O, (D) AC-T and TEM images of (E) AC, (F) AC-N, (G) AC-O, and (H) AC-T. | ||
The structural characteristics of ACs were calculated from nitrogen adsorption isotherms at 77 K. Nitrogen adsorption–desorption isotherms and the corresponding DFT pore size distributions were presented in Fig. S5,† and the results were further summarized in Table 2. All of the samples showed typical Type I isotherm according to IUPAC classification, implying the developed microporous texture of ACs. In all cases, the surface areas and pore volumes were increased after modification. AC-T exhibited the largest BET surface area (SBET) of 399 m2 g−1 and total pore volume (Vtot) of 0.239 cm3 g−1, followed by AC-N with 382 m2 g−1 of SBET and 0.228 cm3 g−1 of Vtot. While for microporous parameters, the largest surface area (Smic) of 329 m2 g−1 and micropore volume (Vmic) of 0.167 cm3 g−1 were obtained by AC-N, indicating the well-developed microporous structure after HNO3 treatment. The Smic and Vmic of AC-T were slightly smaller than AC-N.
The roles of structural properties on acetone adsorption were further investigated by correlating pore structure parameters (SBET, Smic, Vtot, and Vmic) with adsorption amounts, as shown in Fig. 4. Both the surface area and pore volume presented linear relationship with adsorption capacity of acetone for all cases. Smic and Vmic had higher linear coefficients (R2) with adsorption amount than those of SBET and Vtot. Based on these evidences, we inferred that micropores might be the crucial factor for acetone adsorption over activated carbons.
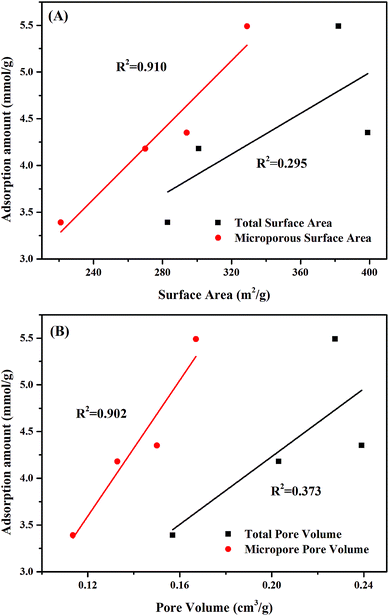 | ||
| Fig. 4 Relationship between the adsorption amount of acetone and the structural properties of ACs with different treatments: (A) surface areas, and (B) pore volumes. | ||
3.3 Effects of functional groups on acetone adsorption
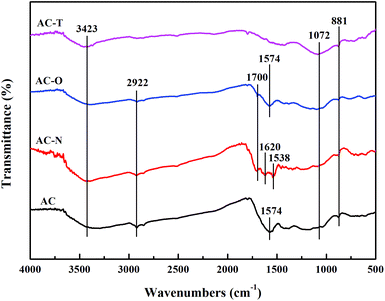
Another factor which may play a significant role for adsorption is the surface chemistry of carbon surface.43 Modifications can introduce or remove functional groups of activated carbon, including carboxylic, lactone, phenolic hydroxyl and so on.44 In view of the pyrolysis of functional groups, thermal weigh losses of ACs were investigated by TG-DTA analysis to illustrate the surface chemistry properties. As shown in Fig. S6,† the initial weight loss of all samples except AC-T occurred at 365 K, which could be due to the loss of free or bound water.45 For AC-N, the maximum weight loss appeared in the range of 473–603 K, corresponding to the decomposition of carboxylic groups.46 Due to the pyrolysis of lactone groups, weight loss at 623–793 K occurred for AC-O and AC.47 While for AC-T, as the functional groups had been removed during the heat treatment, there was no obvious weight loss. Among the samples, AC-N exhibited the largest weight loss, indicating the largest amount of functional groups after HNO3 treatment.FTIR transmission spectra offered further evidence for various contents of oxygen functional groups on ACs with different modification, as shown in Fig. 5. Spectrums of original AC showed bands at 3423 cm−1 and 1574 cm−1, which could be due to C–OH stretch band and C![[double bond, length as m-dash]](https://www.rsc.org/images/entities/char_e001.gif) C group, respectively.48–50 Weak peaks of –CH2 (2922 cm−1), C–O–C (1072 cm−1) and C–H (881 cm−1) were also found.48,51 The band at 1700 cm−1 appeared on AC-N and AC-O, which was due to vibration of C
C group, respectively.48–50 Weak peaks of –CH2 (2922 cm−1), C–O–C (1072 cm−1) and C–H (881 cm−1) were also found.48,51 The band at 1700 cm−1 appeared on AC-N and AC-O, which was due to vibration of C![[double bond, length as m-dash]](https://www.rsc.org/images/entities/char_e001.gif) O from carboxyl or carbonyl group introduced by HNO3 and H2O2.27 AC-N also showed characteristic peaks at 1620 cm−1 and 1538 cm−1, corresponding to bend band of C–OH and –CONH–, respectively.52–54 The AC-T curve shows that after thermal treatment, bands at 2922 cm−1 and 1574 cm−1 decreased as most of the surface groups were removed.
O from carboxyl or carbonyl group introduced by HNO3 and H2O2.27 AC-N also showed characteristic peaks at 1620 cm−1 and 1538 cm−1, corresponding to bend band of C–OH and –CONH–, respectively.52–54 The AC-T curve shows that after thermal treatment, bands at 2922 cm−1 and 1574 cm−1 decreased as most of the surface groups were removed.
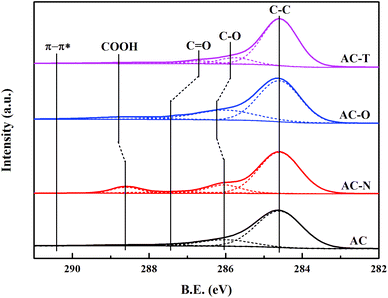
XPS has also shown to be a useful tool for analysing the surface groups of activated carbons,37 which provide valuable information by examining the C 1s core region. The C 1s spectrum could be divided into five single peaks corresponding to C–C (284.6 eV), C–O (285.7–286 eV), C![[double bond, length as m-dash]](https://www.rsc.org/images/entities/char_e001.gif) O (286.6–287.3 eV), –COOH (288.2–288.8 eV), and π–π* (290.4 eV), as shown in Fig. 6.55,56 Classification of the functional groups give –COOH and C–O as acidic, while C
O (286.6–287.3 eV), –COOH (288.2–288.8 eV), and π–π* (290.4 eV), as shown in Fig. 6.55,56 Classification of the functional groups give –COOH and C–O as acidic, while C![[double bond, length as m-dash]](https://www.rsc.org/images/entities/char_e001.gif) O and π–π* as basic.56 The area percentages of different groups were summarized in Table 3. We could found that AC-N had the largest proportion of –COOH and C–O groups which might be caused by the oxidation effect of HNO3. Abundant C
O and π–π* as basic.56 The area percentages of different groups were summarized in Table 3. We could found that AC-N had the largest proportion of –COOH and C–O groups which might be caused by the oxidation effect of HNO3. Abundant C![[double bond, length as m-dash]](https://www.rsc.org/images/entities/char_e001.gif) O groups were introduced to the surface through H2O2 oxidation, together with C–O and COOH groups. AC-T exhibited the lowest content of C–O and COOH groups as a result of pyrolysis at high temperature. These trends for the four samples agree with the FTIR spectra, illustrating the various functional groups on ACs by different modification.
O groups were introduced to the surface through H2O2 oxidation, together with C–O and COOH groups. AC-T exhibited the lowest content of C–O and COOH groups as a result of pyrolysis at high temperature. These trends for the four samples agree with the FTIR spectra, illustrating the various functional groups on ACs by different modification.
| Samples | Relative peak areas (%) | ||||
|---|---|---|---|---|---|
| C–C | C–O | C![[double bond, length as m-dash]](https://www.rsc.org/images/entities/char_e001.gif) O O |
–COOH | π–π* | |
| AC | 78.2 | 15.6 | 1.9 | 2.5 | 1.8 |
| AC-N | 61.1 | 25.1 | 0.6 | 8.3 | 4.9 |
| AC-O | 73.9 | 18.6 | 2.1 | 4.5 | 0.9 |
| AC-T | 80.0 | 6.7 | 1.8 | 0.8 | 9.7 |
| AC-N-A | 72.2 | 18.4 | 5.6 | 2.3 | 1.5 |
To determine the functional groups quantitatively, Boehm titration was carried out. The results of basic groups, phenolic, lactonic, and carboxylic for various activated carbons were shown in Fig. S7† and Table 4. For original AC, the total functional groups were 0.708 mmol g−1 with 38.3% (0.271 mmol g−1) basic groups, 13.4% (0.095 mmol g−1) phenolic, 14.7% (0.104 mmol g−1) lactonic, and 33.6% (0.238 mmol g−1) carboxylic. It should be noticed that the thermal treatment of AC-T reduced the number of all functional groups, whereas the carboxylic and phenolic groups of AC-N and AC-O were significantly increased. The change was consistent with TG-DTA, FTIR and XPS results. As far as carboxylic groups were concerned, AC-N exhibited the highest amount of 0.855 mmol g−1, followed by AC-O of 0.528 mmol g−1. While there only existed 0.005 mmol g−1 on the surface of AC-T. Fig. 7 links thermal desorption amount of strongly adsorbed acetone with surface carboxylic groups. AC-N containing largest carboxylic groups presented highest amount of strongly adsorbed acetone. Therefore, carboxylic group might be the main active site for combination with acetone, which played an important role in acetone adsorption. We also compared thermal desorption amount of acetone with other functional groups, and no clear trend was observed.
| Samples | AC | AC-N | AC-O | AC-T |
|---|---|---|---|---|
| Basic groups (mmol g−1) | 0.271 | 0.057 | 0.133 | 0.244 |
| Phenolic (mmol g−1) | 0.095 | 0.434 | 0.272 | 0.057 |
| Lactonic (mmol g−1) | 0.104 | 0.093 | 0.148 | 0.065 |
| Carboxylic (mmol g−1) | 0.238 | 0.855 | 0.528 | 0.005 |
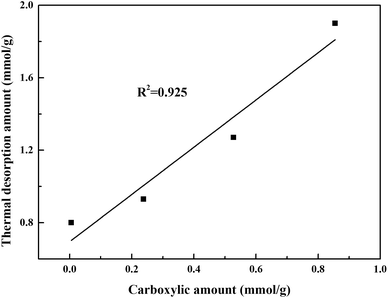 | ||
| Fig. 7 Relationship between thermal desorption amount of strongly adsorbed acetone and the carboxylic amount of ACs with different treatments. | ||
3.4 Identification of active site for strongly adsorbed acetone
TPD after adsorption and purging was carried out at different heating rates, for comparison of active sites on AC-N and original AC. As shown in Fig. 8A, the desorption peaks of both AC-N and AC moved to higher temperature with the increase of heating rate. It could also be noticed that the peak temperatures of AC at different heating rates almost coincide with AC-N, indicating the same desorption mechanism of acetone on AC-N and AC. According to the desorption peak temperatures and the heating rates, the activation energy for acetone desorption was deduced according to eqn (8):57
 | (8) |
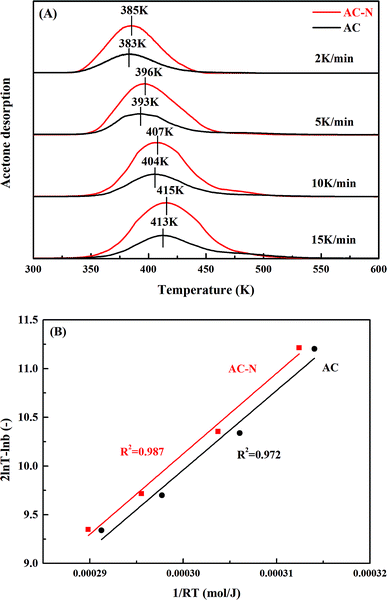 | ||
| Fig. 8 (A) TPD spectra of strongly adsorbed acetone on AC and AC-N at different heating rates, and (B) relationship between desorption peak temperature and heating rate. | ||
Eqn (8) can be further represented as follow:
 | (9) |
Based on the plot of (2![[thin space (1/6-em)]](https://www.rsc.org/images/entities/char_2009.gif) ln
ln![[thin space (1/6-em)]](https://www.rsc.org/images/entities/char_2009.gif) T − ln
T − ln![[thin space (1/6-em)]](https://www.rsc.org/images/entities/char_2009.gif) b) and (1/RT) showed in Fig. 8B, the desorption activation energies (Ed) of acetone on AC-N and AC were both 81.6 kJ mol−1, indicating the same combining energy between acetone and carbon surface. From an energy point of view, the active site for strongly adsorbed acetone on AC-N and AC was of the same kind.
b) and (1/RT) showed in Fig. 8B, the desorption activation energies (Ed) of acetone on AC-N and AC were both 81.6 kJ mol−1, indicating the same combining energy between acetone and carbon surface. From an energy point of view, the active site for strongly adsorbed acetone on AC-N and AC was of the same kind.
To further clarify the interactions between acetone molecules and carbon surface, FTIR and XPS spectra of AC-N after adsorption were studied (denoted as AC-N-A), as shown in Fig. S8.† FTIR peak at 1700 cm−1 of AC-N disappeared after adsorption, indicating the importance of –COOH in acetone adsorption process. While new peaks at 1755 cm−1 and 1437 cm−1 were observed in AC-N-A, which could be ascribed to C![[double bond, length as m-dash]](https://www.rsc.org/images/entities/char_e001.gif) O and –CH3 from acetone, respectively.58,59 Therefore, although part of acetone was strongly adsorbed by –COOH, the molecular structure of acetone might not change during the process. The results of C 1s XPS summarized in Table 3 also proved that the –COOH groups decreased after acetone adsorption for AC-N-A, while C–C and C
O and –CH3 from acetone, respectively.58,59 Therefore, although part of acetone was strongly adsorbed by –COOH, the molecular structure of acetone might not change during the process. The results of C 1s XPS summarized in Table 3 also proved that the –COOH groups decreased after acetone adsorption for AC-N-A, while C–C and C![[double bond, length as m-dash]](https://www.rsc.org/images/entities/char_e001.gif) O groups increased. Similar conclusions were obtained by Dimotakis and Kwon, finding that acetone adsorption was enhanced on oxidized carbonaceous surfaces.60,61
O groups increased. Similar conclusions were obtained by Dimotakis and Kwon, finding that acetone adsorption was enhanced on oxidized carbonaceous surfaces.60,61
The slope of fitting equation between thermal desorption amounts and carboxylic amounts was closing to 1. Combined with molecular simulation study by Liang of hydrogen-oxygen interactions between acetone molecule and neighbouring carboxyl groups,62 the possible adsorption mechanism of acetone on carbonaceous surface was proposed in Fig. 9. As discussed above, carboxyl group could be the main active site which was likely to combine with acetone. The main difference among different samples could be the amount of active sites. Therefore, the excellent thermal desorption amount of AC-N might be contributed to the largest amount of carboxyl groups.
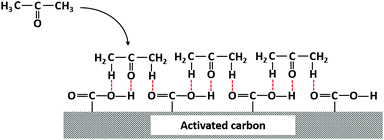 | ||
| Fig. 9 Adsorption mechanism of interaction between acetone and carboxylic groups on activated carbon. | ||
4. Conclusions
Pore structures and functional groups on carbon surface, obtained by different treatments of activated carbon, have been studied to find the crucial factors on acetone adsorption performance. Microporous surface area showed positive linear correlation to the total adsorption amount, and the increasing of carboxylic groups on ACs could favour the strongly adsorbed acetone. Acetone adsorption was enhanced by treatment with HNO3, which exhibited the highest total adsorption amount of 5.49 mmol g−1 with strongly adsorbed one accounting for 38.1%. This might be contributed to the developed microporous structures (329 m2 g−1 of microporous surface area) and the abundant carboxylic groups (0.855 mmol g−1).TPD of strongly adsorbed acetone with different heating rates was carried out, for comparison of active sites on AC-N and original AC. The desorption activation energies (Ed) of AC-N and AC were both determined to be 81.6 kJ mol−1, indicating the same type of active sites on different carbonaceous surface. To further clarify the interactions between acetone molecules and carbon surface, FTIR and XPS spectra of AC-N after adsorption were studied, revealing that –COOH was most likely the active site, and the molecular structure of acetone might not change during the process. The possible adsorption mechanism of acetone on carbonaceous surface was also proposed.
Conflicts of interest
There are no conflicts to declare.Acknowledgements
This work is supported by the National Key Research and Development Program of China (No. 2017ZY01014001), and National Science Foundation of China (No. U1609212 and No. 51306079), and Open Fund of Key Laboratory of Ministry of Education of China (No. LLEUTS-201507).Notes and references
- N. Mohan, G. K. Kannan, S. Upendra, R. Subha and N. S. Kumar, J. Hazard. Mater., 2009, 168, 777–781 CrossRef PubMed.
- T. Dobre, O. C. Parvulescu, G. Iavorschi, M. Stroescu and A. Stoica, Ind. Eng. Chem. Res., 2014, 53, 3622–3628 CrossRef.
- H. Y. Mao, D. G. Zhou, Z. Hashisho, S. G. Wang, H. Chen, H. Y. Wang and M. J. Lashaki, RSC Adv., 2015, 5, 36051–36058 RSC.
- X. Liang, J. Chi and Z. Yang, Microporous Mesoporous Mater., 2018, 262, 77–88 CrossRef.
- Q. H. Trinh, M. S. Gandhi and Y. S. Mok, Jpn. J. Appl. Phys., 2015, 54, 01AG04 CrossRef.
- F. I. Khan and A. K. Ghoshal, J. Loss Prev. Process Ind., 2000, 13, 527–545 CrossRef.
- T. Terencio, F. Di Renzo, D. Berthomieu and P. Trens, J. Phys. Chem. C, 2013, 117, 26156–26165 Search PubMed.
- S. Brosillon, M. H. Manero and J. N. Foussard, Environ. Technol., 2000, 21, 457–465 CrossRef.
- A. Gil, L. M. Gandia and S. A. Korili, Appl. Catal., A, 2004, 274, 229–235 CrossRef.
- R. Qin, J. H. Chen, X. Gao, X. B. Zhu, X. N. Yu and K. F. Cen, RSC Adv., 2014, 4, 43874–43881 RSC.
- X. B. Zhu, X. Tu, D. H. Mei, C. H. Zheng, J. S. Zhou, X. Gao, Z. Y. Luo, M. J. Ni and K. F. Cen, Chemosphere, 2016, 155, 9–17 CrossRef PubMed.
- H. Q. Trinh and Y. S. Mok, Chem. Eng. J., 2014, 251, 199–206 CrossRef.
- J. W. Qi, J. S. Li, Y. Li, X. F. Fang, X. Y. Sun, J. Y. Shen, W. Q. Han and L. J. Wang, Chem. Eng. J., 2017, 307, 989–998 CrossRef.
- Y. C. Chiang, P. C. Chaing and C. P. Huang, Carbon, 2001, 39, 523–534 CrossRef.
- S. Niknaddaf, J. D. Atkinson, P. Shariaty, M. J. Lashaki, Z. Hashisho, J. H. Phillips, J. E. Anderson and M. Nichols, Carbon, 2016, 96, 131–138 CrossRef.
- Y. H. Cao, K. L. Wang, X. M. Wang, Z. R. Gu, W. Gibbons and H. Vu, Appl. Surf. Sci., 2015, 349, 1–7 CrossRef.
- M. A. Lillo-Rodenas, D. Cazorla-Amoros and A. Linares-Solano, Carbon, 2005, 43, 1758–1767 CrossRef.
- H. L. Chiang, C. P. Huang and P. C. Chiang, Chemosphere, 2002, 47, 257–265 CrossRef PubMed.
- X. A. Gao, S. J. Liu, Y. Zhang, Z. Y. Luo and K. F. Cen, J. Hazard. Mater., 2011, 188, 58–66 CrossRef PubMed.
- J. H. Chen, F. F. Cao, S. Z. Chen, M. J. Ni, X. Gao and K. F. Cen, Appl. Surf. Sci., 2014, 317, 26–34 CrossRef.
- X. Liu, F. Sun, Z. B. Qu, J. H. Gao and S. H. Wu, Appl. Surf. Sci., 2016, 369, 552–557 CrossRef.
- M. G. Lee, S. W. Lee and S. H. Lee, Korean J. Chem. Eng., 2006, 23, 773–778 CrossRef.
- R. R. Gil, B. Ruiz, M. S. Lozano, M. J. Martin and E. Fuente, Chem. Eng. J., 2014, 245, 80–88 CrossRef.
- S. Shu, J. X. Guo, X. L. Liu, X. J. Wang, H. Q. Yin and D. M. Luo, Appl. Surf. Sci., 2016, 360, 684–692 CrossRef.
- M. C. Almazan-Almazan, M. Perez-Mendoza, M. Domingo-Garcia, I. Fernandez-Morales, F. del Rey-Bueno, A. Garcia-Rodriguez and F. J. Lopez-Garzon, Carbon, 2007, 45, 1777–1785 CrossRef.
- C. M. Ghimbeu, R. Gadiou, J. Dentzer, D. Schwartz and C. Vix-Guterl, Langmuir, 2010, 26, 18824–18833 CrossRef PubMed.
- Y. Y. Guo, Y. R. Li, J. Wang, T. Y. Zhu and M. Ye, Chem. Eng. J., 2014, 236, 506–512 CrossRef.
- J. G. Bell, X. B. Zhao, Y. Uygur and K. M. Thomas, J. Phys. Chem. C, 2011, 115, 2776–2789 Search PubMed.
- K. J. Kim, C. S. Kang, Y. J. You, M. C. Chung, M. W. Woo, W. J. Jeong, N. C. Park and H. G. Ahn, Catal. Today, 2006, 111, 223–228 CrossRef.
- L. Li, S. Q. Liu and J. X. Liu, J. Hazard. Mater., 2011, 192, 683–690 CrossRef PubMed.
- K. Zhou, L. Li, X. Ma, Y. Mo, R. Chen, H. Li and H. Li, RSC Adv., 2018, 8, 2922–2932 RSC.
- A. J. Romero-Anaya, M. A. Lillo-Rodenas and A. Linares-Solano, Carbon, 2014, 77, 616–626 CrossRef.
- G. J. F. Cruz, L. Kubonova, D. Y. Aguirre, L. Matejova, P. Peikertova, I. Troppova, E. Cegmed, A. Wach, P. Kustrowski, M. M. Gomez and L. Obalova, ACS Sustainable Chem. Eng., 2017, 5, 2368–2374 CrossRef.
- L. A. Jonas and W. J. Svirbely, J. Catal., 1972, 24, 446–459 CrossRef.
- L. Li, L. Tang, X. Liang, Z. Liu and Y. Yang, J. Chem. Eng. Jpn., 2016, 49, 958–966 CrossRef.
- J. H. Tsai, H. M. Chiang, G. Y. Huang and H. L. Chiang, J. Hazard. Mater., 2008, 154, 1183–1191 CrossRef PubMed.
- H. P. Boehm, Carbon, 2002, 40, 145–149 CrossRef.
- N. J. Foley, K. M. Thomas, P. L. Forshaw, A. D. Stanton and P. R. Norman†, Langmuir, 1997, 13, 2083–2089 CrossRef.
- R. Chauveau, G. Grévillot, S. Marsteau and C. Vallières, Chem. Eng. Res. Des., 2013, 91, 955–962 CrossRef.
- F. Cao, J. Chen, C. Lyu, M. Ni, X. Gao and K. Cen, Catal. Sci. Technol., 2015, 5, 1267–1279 Search PubMed.
- P. Hadi, M. H. To, C. W. Hui, C. S. K. Lin and G. Mckay, Water Res., 2015, 73, 37–55 CrossRef PubMed.
- J. Ryu, Y. W. Suh, J. S. Dong and J. A. Dong, Carbon, 2010, 48, 1990–1998 CrossRef.
- T. J. Bandosz, Carbon, 1999, 37, 483–491 CrossRef.
- W. Zhang, H. Y. Liu, Q. B. Xia and Z. Li, Chem. Eng. J., 2012, 209, 597–600 CrossRef.
- J. Cai, S. Bennici, J. Shen and A. Auroux, Microporous Mesoporous Mater., 2015, 212, 156–168 CrossRef.
- E. Gallegos-Suarez, M. Perez-Cadenas, A. Guerrero-Ruiz, I. Rodriguez-Ramos and A. Arcoya, Appl. Surf. Sci., 2013, 287, 108–116 CrossRef.
- S. Tazibet, Y. Boucheffa, R. Lodewyckx, L. F. Velasco and Y. Boutillara, Microporous Mesoporous Mater., 2016, 221, 67–75 CrossRef.
- T. Kuila, P. Khanra, A. K. Mishra, N. H. Kim and J. H. Lee, Polym. Test., 2012, 31, 282–289 CrossRef.
- H. Sun, Y. Cao, L. Y. Feng and Y. G. Chen, Sci. Rep., 2016, 6, 22808 CrossRef PubMed.
- X. P. Hao, S. G. Chen, H. Yu, D. Liu and W. X. Sun, RSC Adv., 2016, 6, 39–43 RSC.
- M. Veerapandian and S. Neethirajan, RSC Adv., 2015, 5, 75015–75024 RSC.
- Z. L. Du, Y. S. Peng, Z. P. Ma, C. Y. Li, J. Yang, X. J. Qin and G. J. Shao, RSC Adv., 2015, 5, 10296–10303 RSC.
- A. M. Akl and A. M. Abou-Elanwar, J. Nanomed. Nanotechnol., 2015, 6, 327–335 Search PubMed.
- J. Xu, N. Cai, W. X. Xu, Y. A. Xue, Z. L. Wang, Q. Dai and F. Q. Yu, Nanotechnology, 2013, 24, 025701 CrossRef PubMed.
- F. F. Cao, J. H. Chen, M. J. Ni, H. Song, G. Xiao, W. H. Wu, X. Gao and K. F. Cen, RSC Adv., 2014, 4, 16281–16289 RSC.
- Y. Y. Guo, Y. R. Li, T. Y. Zhu, M. Ye and X. Wang, Adsorption, 2013, 19, 1109–1116 CrossRef.
- R. Q. Long and R. T. Yang, J. Am. Chem. Soc., 2001, 123, 2058–2059 CrossRef PubMed.
- J. M. Quiroz-Castillo, D. E. Rodriguez-Felix, H. Grijalva-Monteverde, L. L. Lizarraga-Laborin, M. M. Castillo-Ortega, T. del Castillo-Castro, F. Rodriguez-Felix and P. J. Herrera-Franco, Materials, 2015, 8, 137–148 CrossRef PubMed.
- J. Szanyi and J. H. Kwak, J. Mol. Catal. A: Chem., 2015, 406, 213–223 CrossRef.
- E. D. Dimotakis, M. P. Cal, J. Economy, M. J. Rood and S. M. Larson, Environ. Sci. Technol., 1995, 29, 1876–1880 CrossRef PubMed.
- S. Kwon, R. Vidic and E. Borguet, Surf. Sci., 2003, 522, 17–26 CrossRef.
- X. Liang, J. Chi and Z. Yang, Microporous Mesoporous Mater., 2017, 262, 77–88 CrossRef.
Footnote |
| † Electronic supplementary information (ESI) available. See DOI: 10.1039/c8ra03099e |
| This journal is © The Royal Society of Chemistry 2018 |

