
 Open Access Article
 This Open Access Article is licensed under a Creative Commons Attribution-Non Commercial 3.0 Unported Licence
Extracellular polymeric substances (EPS) secreted by Purpureocillium lilacinum strain Y3 promote biosynthesis of jarosite
Peng Bao a,
Mingchen Xiaa,
Ajuan Liua,
Mingwei Wanga,
Li Shenab,
Runlan Yuab,
Yuandong Liuab,
Jiaokun Liab,
Xueling Wuab,
Caoming Fangc,
Miao Chende,
Guanzhou Qiuab and
Weimin Zeng*abc
a,
Mingchen Xiaa,
Ajuan Liua,
Mingwei Wanga,
Li Shenab,
Runlan Yuab,
Yuandong Liuab,
Jiaokun Liab,
Xueling Wuab,
Caoming Fangc,
Miao Chende,
Guanzhou Qiuab and
Weimin Zeng*abc
aSchool of Minerals Processing and Bioengineering, Central South University, Changsha 410083, China. E-mail: zengweimin1024@126.com; Tel: +86-13787288594
bKey Laboratory of Biometallurgy, Ministry of Education, Changsha 410083, China
cChina Nonferrous Metal Mining (Group) Co., Ltd, Beijing, China
dCSIRO Process Science and Engineering, Clayton, Victoria 3168, Australia
eCentre for Advanced Materials and Industrial Chemistry, RMIT University, Melbourne 3000, Australia
First published on 20th June 2018
Abstract
In this study, the biosynthesis of jarosite by Purpureocillium lilacinum was investigated. Firstly, we found when the pH value was lower than 2.50 at 30 °C, the concentration of Fe3+ in the solution significantly dropped about 72% after inoculation and a yellow-ocher precipitate was observed on the mycelium surface. X-ray diffraction analysis revealed the precipitate was jarosite. Thereafter, the characterization of the biomineralization process by scanning electron microscopy showed that mineral precipitates started on the cell surface, and then thoroughly covered it. Furthermore the effect of extracellular polymeric substances (EPS) on the biosynthesis of jarosite was investigated. The results suggested Fe3+ only dropped 5.2% in 2 days when EPS were stripped. Finally, through monitoring the changes of mycelium surface groups by Fourier transform infrared spectroscopy, we found the biomineralization process originated from the existence of free P![[double bond, length as m-dash]](https://www.rsc.org/images/entities/char_e001.gif) O groups in EPS which acted as crystallization nuclei to promote Fe(OH)3 transformation into jarosite by the formation of P–O–Fe bonds.
O groups in EPS which acted as crystallization nuclei to promote Fe(OH)3 transformation into jarosite by the formation of P–O–Fe bonds.
1 Introduction
Biomineralization is the process in which inorganic elements selectively deposit on the surface of special organic matters from the environment with the participation of organisms. The compositions of biominerals are varied and calcium-containing minerals are among the most common forms, making up almost half the total biominerals. Besides, silicon and iron oxide also take a great percentage.1,2 Among them, the naturally occurring jarosite is usually connected with microbial action. The general formula of jarosite is KFe3(SO4)2(OH)6, which is a hydrated iron-potassium sulfate and is stabilized at low pH value.3,4 Only at a pH value lower than 4 can jarosite be formed.5 The typical method of jarosite generation is the reaction of Fe-rich rocks with acid oxidized fluids or the oxidation of pyrite-rich rocks.6 Besides, jarosite has been found on sediments at Mawrth Vallis and Meriadiani Planum on the surface of Mars.7,8Acid mine drainages (AMD) with high concentration of ferric ions and sulfates is one of the most typical pollutants in the mine environment. The process of biosynthesis of jarosite can contribute to shape and control the geochemical properties of this environment by removing ferric ions more efficiently.9 Furthermore, biological nanoparticles of jarosite possess the advantage of milder process condition and absence of toxic chemicals, and showed the good performance for pigment in the painting and adsorbing material in the treatment of waste water.10,11
Biomineralization can be classified to biologically induced mineralization (BIM) and biologically controlled mineralization (BCM).12 In BIM process, mineralization happens when the organism modifies its local microenvironments by cellular components just like EPS, cytoderm and some spores, which possess charged surface, which can serve as adsorption sites to interact with metal ions bringing about growth and nucleation of minerals. In this case, the organism does not exert any control over the mineralization process. In BCM process, the mineralization is not influenced by various environmental factors, and the deposition process of mineral is tightly regulated by organism. The mineral formed by this method contains a large number organic matter, and the shape of mineral is homogeneous. But in BCM process the biomass inflicts a high level of control over the nucleation and growth of minerals, and this process usually takes place inside the cell.13 Besides, the ratio of Fe2+/Fe3+, the concentration of Fe3+ and the pH value are essential elements of the biomineralization of jarosite despite the nucleation sites by themselves are enough to facilitate jarosite formation.14
Biomineralization in artificial and natural environments by prokaryotic microorganism has been widely investigated.15,16 For example, Bontognali et al. reported that bacteria D. brasiliensis can intervene in chaotic Ca-dolomite and Mg-calcite mineralization through metabolic activity mediating this process in artificial environment, and the mechanism is independent and induces supersaturation and the following mineralization of carbonate.17 As the study of the environment of acid mine drainages (AMD) progressed, we find out that the eukaryotes also play an important role to keep the stability of the ecosystem.18 Oggerin et al. reported that an acidic fungus Purpureocillium lilacinum was separated from the banks of the Río Tinto basin, which may play a significant role in specifically precipitating jarosite in natural extreme acidic ecosystems, the ability is limited to specific species and not universal to all fungi isolated from this acidic surroundings.19
Extracellular polymeric substances (EPS) of microorganism play an important influence on biofilm formation, bacteria transport and adhesion, heavy metal ions accumulation and biomineralization.20–22 The role of EPS on biomineralization usually be classified to electrostatic interaction and charge accumulation, geometric matching of crystal, and complementary structure in space.23–25 For example, the sulphate-reducing bacteria (SRB) may induce mineral precipitation by mediating the pH value or affect the composition of mineral by generating a fundamental organic matrix. The existence of EPS generated by specific microorganisms is obviously of crucial significance for incorporating Mg2+ into the mineral lattice.17 Besides, it is reported that the EPS constituting the microbial mats developed along the coastal sabkhas of Abu Dhabi are indispensable components for the formation of dolomite.26 Moreover, the formation of Fe–O–P bonds between goethite surface and phosphoryl groups is the way of EPS-goethite specific interaction, which offers a forceful bonding method and contributes to microorganisms conglutination leading to biofilm formation and cell immobilization in the near-surface ecosystem.27 Even though the significance of microorganisms for mineralization is generally admitted, the exact mechanism in the formation process remains unclear.
In the present study, the eukaryotes P. lilacinum strain Y3 was used to investigate the biosynthesis ability of jarosite. Then the EPS of microorganism was stripped by several methods to analyze the effect of EPS deficiency on biomineralization. Finally, Fourier transform infrared spectroscopy (FTIR) analysis during biomineralization process was conducted to reveal the mechanism of biosynthesis of jarosite by P. lilacinum strain Y3.
2 Materials and methods
2.1 Fungal strain and growth conditions
P. lilacinum strain Y3, an acidic fungus, was obtained from Key Laboratory of Biometallurgy of Ministry of Education (Central South University, China). The fungus was cultured on potato dextrose agar (PDA, 3.9% (w/v)) slant and incubated for 7 days at 30 °C. Then sterilized water was used to wash the mature conidia from the surface of PDA slant. The number of spores was counted using a Neubauer counting chamber under an optical microscope and the spore suspension was adjusted to a final concentration of 107 spores per mL.To culture in liquid medium, 1 mL of spore suspension was inoculated into 250 mL Erlenmeyer flasks containing 100 mL medium comprised of 5 g L−1 sucrose, 5 g L−1 yeast extract and 5 g L−1 malt extract. The flasks were incubated in a rotary shaker at 30 °C and 120 rpm.
2.2 Biomineralization experiments
The fungus was cultured in Erlenmeyer flasks at 30 °C for 2 days and enough mycelium pellets formed. The biomass was collected by centrifugation at 3000 rpm for 10 min. Then 10 g of wet fungal biomass was added to 100 mL of metal-containing solution (0.5 M L−1 ferric sulfate stock solution and 1 M L−1 potassium sulfate stock solution were added until the initial concentrations of Fe3+ and K+ were adjusted to 0.02 and 0.1 M L−1, respectively). Control experiments were conducted without fungal biomass. Incubation was continued for 11 days at 30 °C and 120 rpm in the rotary shaker, until the concentration of metal ions in solution remained stable. The 5 M L−1 potassium hydroxide solution was used to adjust the pH value of the solutions. Experiments were carried out in triplicate.2.3 EPS extraction with different methods
At present, few studies concerning with extraction methods of fungal EPS have been reported, so different methods of extracting EPS from P. lilacinum were carried out to investigate the importance of fungal EPS in biomineralization process. The detail experimental procedures are illustrated in Fig. 1. The results indicated that a comprehensive method of vibration combining with formaldehyde and NaOH could achieve the highest EPS yield, followed by ultrasonic method, and autoclaved method was the worst (data not shown). Then 10 g of wet fungal biomass, which the EPS have been stripped, was added to 100 mL of metal-containing (0.02 M L−1 Fe3+ and 0.1 M L−1 K+) solution (pH 2.5). Then the solution was cultured for 11 days at 30 °C and 120 rpm, in the rotary shaker.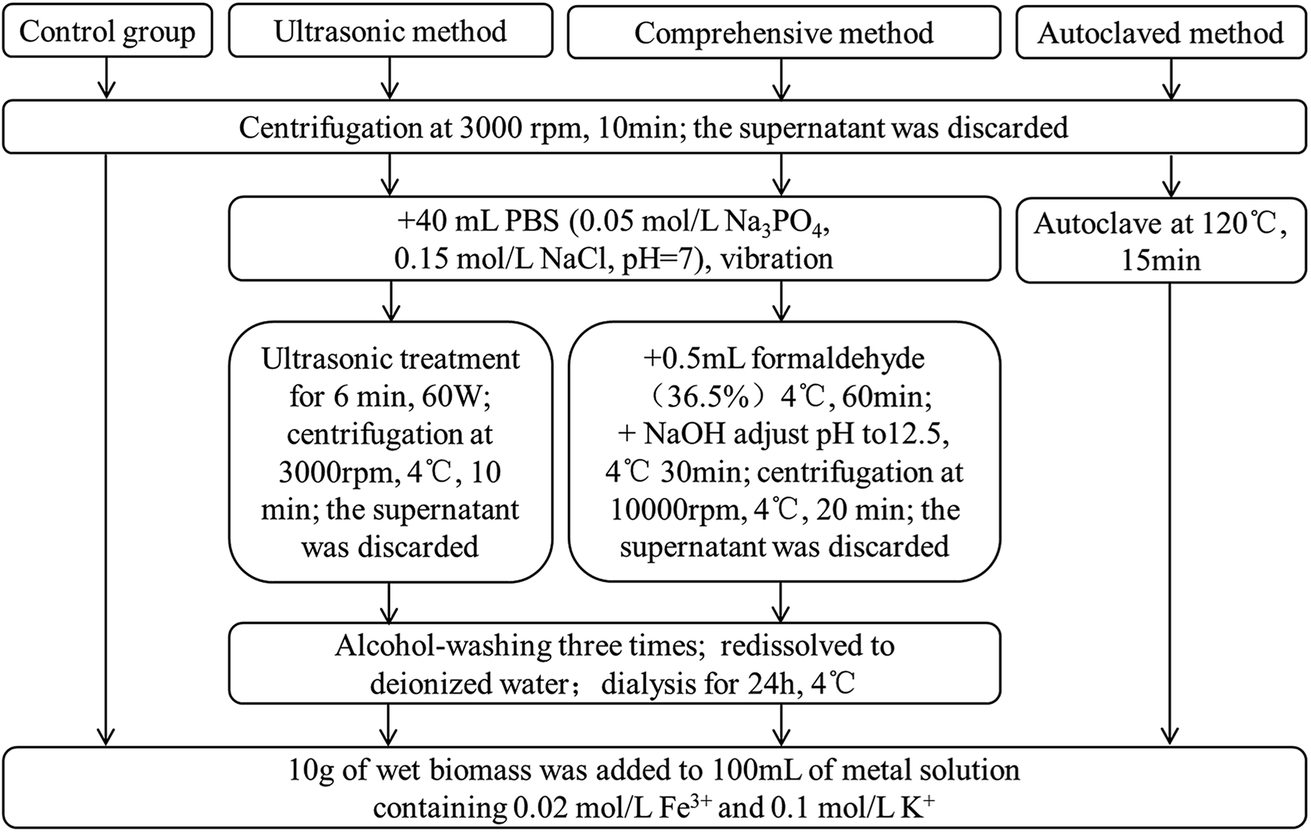 | ||
| Fig. 1 Flow chart of EPS extraction with different methods. | ||
2.4 Analysis methods
Ferric iron concentration in solution was assayed by 1,10-phenanthroline spectrophotometry.28 Polysaccharide content in EPS was measured by the phenol-sulfuric acid method with glucose as the standard.29 The amount of proteins was determined by the BCA Protein Assay Kit using bovine serum albumin as the standard.30 The pH value was determined by pH S-3C acid meter after calibrating with standard buffer solution. The micromorphology of fungal mycelium pellets during biomineralization process was observed by scanning electron microscope (SEM) (Tescan Vega3) and the composition of elements was characterized by Energy Dispersive X-ray Detector (EDX). The crystal phases of biomineral were assayed by X-ray diffraction (XRD) (Leco CS744). The functional groups of P. lilacinum before and after biomineralization were examined by Fourier transform infrared spectroscopy (FTIR) (NEXUS 670), the spectra range were 4000–400 cm−1 and the samples were prepared as KBr discs.3 Results and discussion
3.1 Effect of P. lilacinum on biomineralization
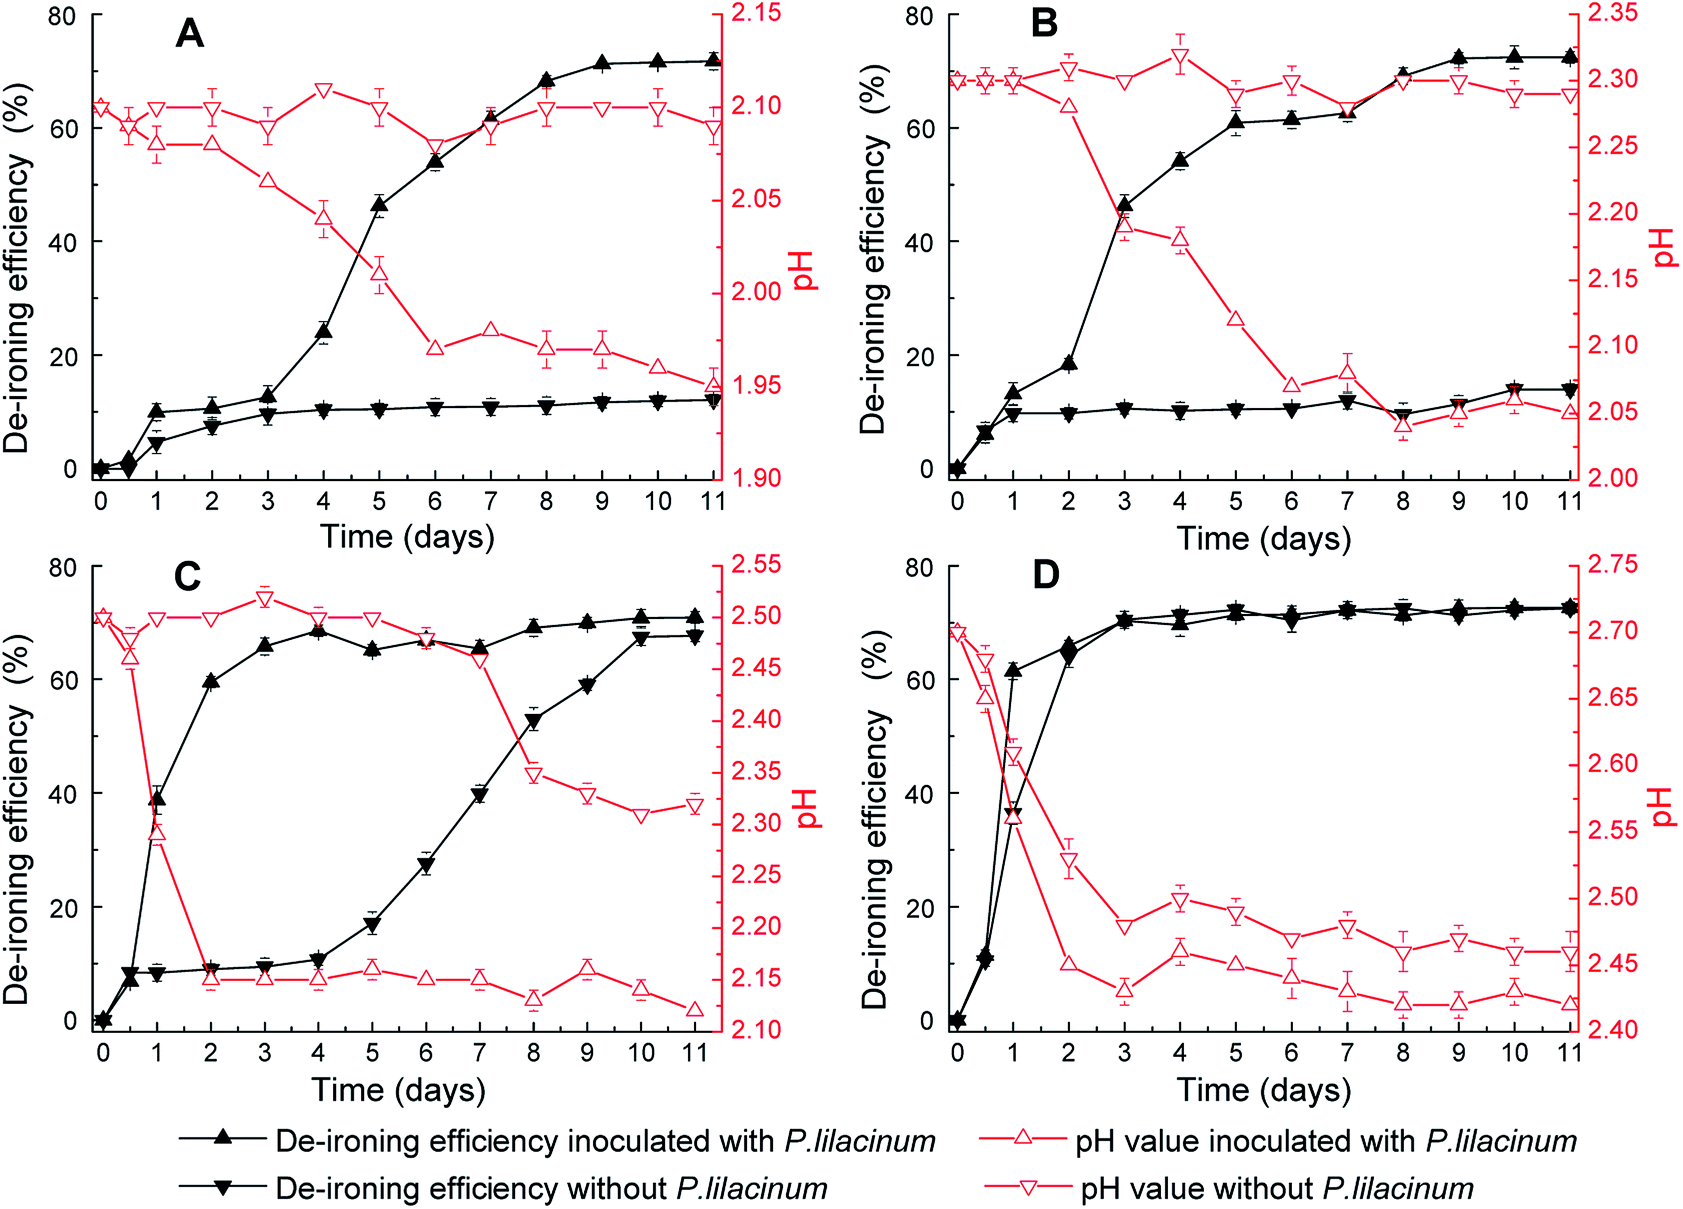 | ||
| Fig. 2 The variation of setting efficiency of Fe3+ and pH value over time during biomineralization process induced P. lilacinum at different initial pH: (A) pH 2.1; (B) pH 2.3; (C) pH 2.5; (D) pH 2.7. | ||
The yellow-ocher colored precipitate in mycelium surface was analyzed by XRD as jarosite (Fig. 2A–C), and the precipitate on the bottom of flasks was analyzed as Fe(OH)3 (Fig. 2D). Fig. 3 showed the XRD patterns of jarosite induced by P. lilacinum. The XRD analysis undisputedly verified that the yellow-ocher coloured precipitate on the mycelium surface belonged to jarosite. But the crystallinity of the precipitates which obtained by different methods differed on the basis of diffraction peaks of the crystal plane.31 The well-recognized and forceful peaks of the precipitate got by control experiments (without cells) indicated that they accord with well-crystallized phases (Fig. 3B). But the precipitate got by biomineralization process showed an obvious amorphous noise in the background (Fig. 3C). What is more, the decrease of pH occurred in experiments with or without inoculation, the variation tendency was exactly consistent to the variation of the concentration of Fe3+. The decrease of pH could be due to H+ was generated in the hydrolysis and mineralization step.32
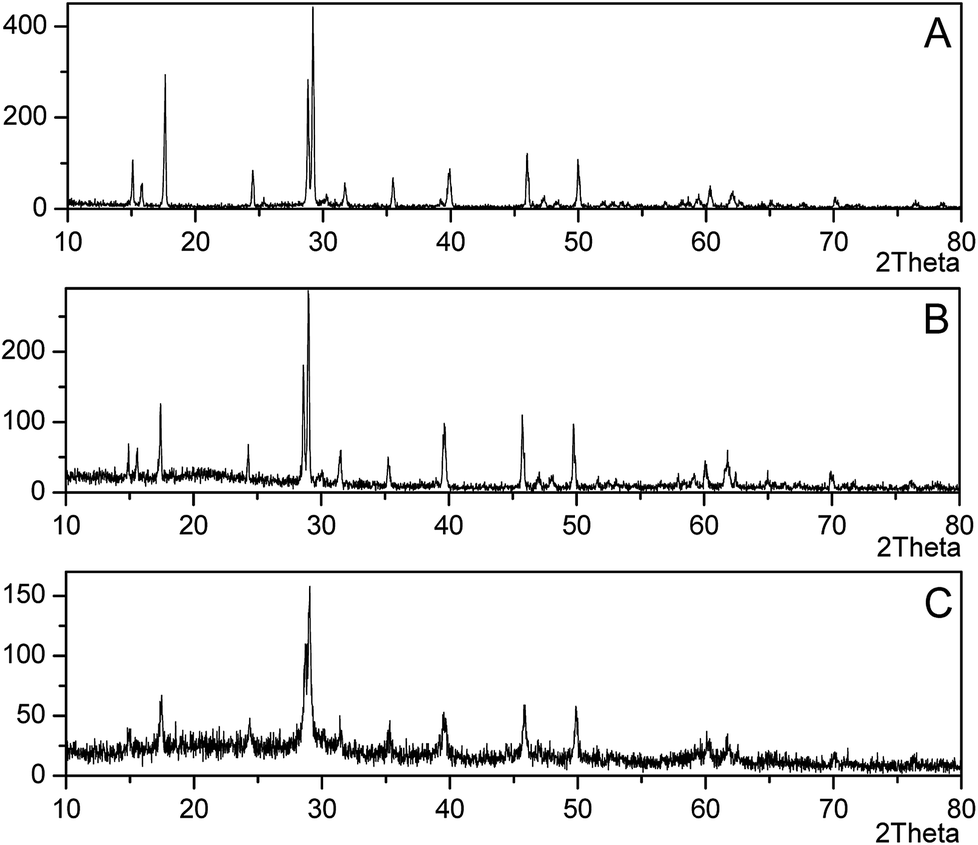 | ||
| Fig. 3 XRD patterns of jarosite and fungal induced mineral (pH 2.5, 11th day): (A) Jarosite XRD standard pattern (PDF#22–0827); (B) XRD pattern of mineral formed in control experiments without cells; (C) XRD pattern of mineral induced by P. lilacinum Y3. | ||
The mineralization process was obviously restrained by acidity. It was clearly observed from Fig. 2 that pH value in the solution played a crucial part in the balance of mineral precipitate and dissolution, and high energy was necessary for activating the new phase.33 As could be seen in the Fig. 2A, the de-ironing efficiency without P. lilacinum was significantly restrained at lower pH value. This change rule was alike to the patterns in Fig. 2B and C. Furthermore, setting efficiency of Fe3+ significantly increased when inoculated with P. lilacinum in all four experimental groups. These results proved that inoculating with P. lilacinum could reduce the dependence of mineralization process upon pH value and could facilitate mineral growth. What's more, as Fig. 2D showed higher setting efficiency of Fe3+ was got with improving pH value. While at higher initial pH values, the change of concentration of Fe3+ due to biomineralization cannot be distinguished from hydrolysis because the Fe3+ hydrolyzes more rapidly.34 Besides, Fig. 2C showed no obvious change in eventual efficiency at the same equilibrated pH value. So, the discrepancy of iron-removal efficiency in Fig. 2 was attributed to the different synthetic rate of mineral. But, when the initial pH value was adjusted to 2.50, the effect of P. lilacinum in setting efficiency of Fe3+ was most obvious.
 | ||
| Fig. 4 SEM micrographs analysis showing the biomineralization process in different time (pH 2.5): (A) 12th hour; (B) 1st day; (C) 2nd day; (D) 11th day. And the precipitation of control experiments without cells: (E) 11th day. | ||
3.2 The effect of EPS from P. lilacinum on the biomineralization
Fig. 5 shows the efficiency of jarosite formation on fungal hyphae surface at pH 2.5 with original and stripped EPS. In the control experiments, the mycelium pellets without treated and the mineral precipitate formed apparently on the surface of mycelium pellets. The concentration of Fe3+ dropped about 71.7% after 2 days and the decrease tendency is exponential. While no visible precipitate was observed in the experimental groups with stripped EPS after 2 days. By comprehensive method, the EPS removed most thoroughly and the concentration of Fe3+ nearly did not change after 2 days. The subdued variation in slopes of the curves demonstrated that the inductive phase of jarosite formation without EPS was lengthened. These results confirmed that the more complete EPS separation, the lower biomineralization efficiency. What is more, the variation tendency of pH was also consistent to the variation of Fe3+.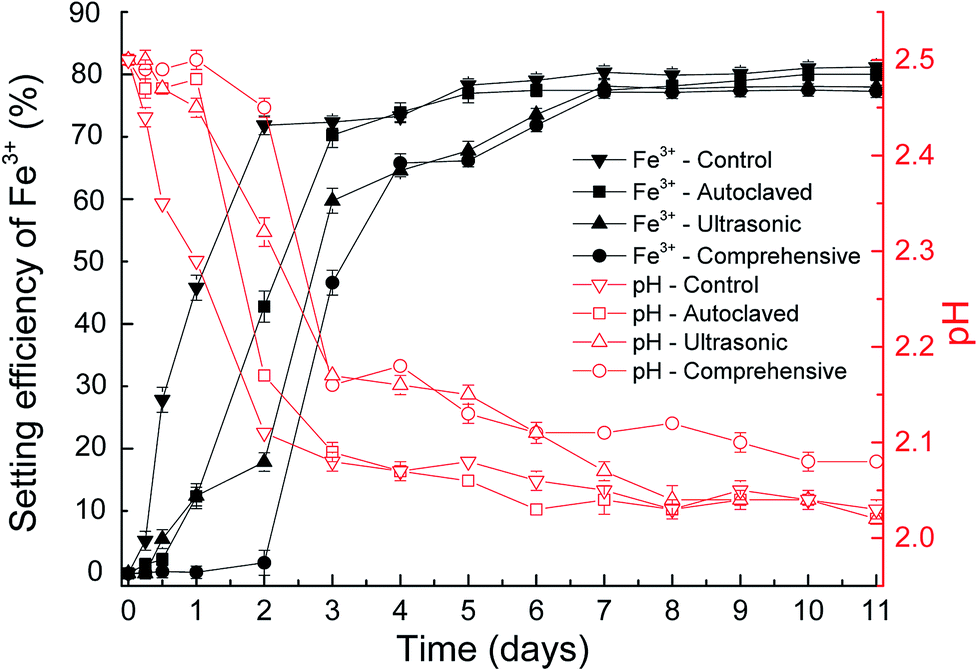 | ||
| Fig. 5 The variation of pH value and biomineralization efficiency during biosynthesis of jarosite by P. lilacinum with and without EPS at pH 2.5. | ||
In the above discussion, we has known that the efficiency holds steady when the equilibrated pH value and original Fe3+ concentration are same, nucleation sites decide the balanced reflection time. As the curves of time and setting efficiency of Fe3+ showed, the existence of EPS could shorten induction period and bring the reaction to equilibrium more rapidly. It is apparent that the EPS is significantly important for jarosite formation.
After standing for 2 days, the mineralized mycelium pellets were obtained after filtering of the solutions and identified by SEM. Fig. 6A–C showed the SEM images of biomineralization by different methods to strip EPS. Stripping EPS by autoclaved method was shown in Fig. 6A, the precipitate of jarosite covered all the biomass. The stoichiometric proportion of the mineral globular aggregates matched those of jarosite (Spectrum 1). But the trace of EPS was not prominent, and no platelike crystals grew. Stripping EPS by ultrasonic method was shown in Fig. 6B. Unformed pellets with uneven size and some emplastic substances were observed on the surface of mycelium. The EDX analysis result showed that the atom ratio of S to Fe was about 1![[thin space (1/6-em)]](https://www.rsc.org/images/entities/char_2009.gif) :1, indicating that only a part of Fe(OH)3 transformed into mineral precipitate (Spectrum 2).33 Stripping EPS by comprehensive method was shown in Fig. 6C. The EPS removed most thoroughly in this method and the mycelium surface was smooth, no viscous substance and amorphous grains could be detected in this condition.
:1, indicating that only a part of Fe(OH)3 transformed into mineral precipitate (Spectrum 2).33 Stripping EPS by comprehensive method was shown in Fig. 6C. The EPS removed most thoroughly in this method and the mycelium surface was smooth, no viscous substance and amorphous grains could be detected in this condition.
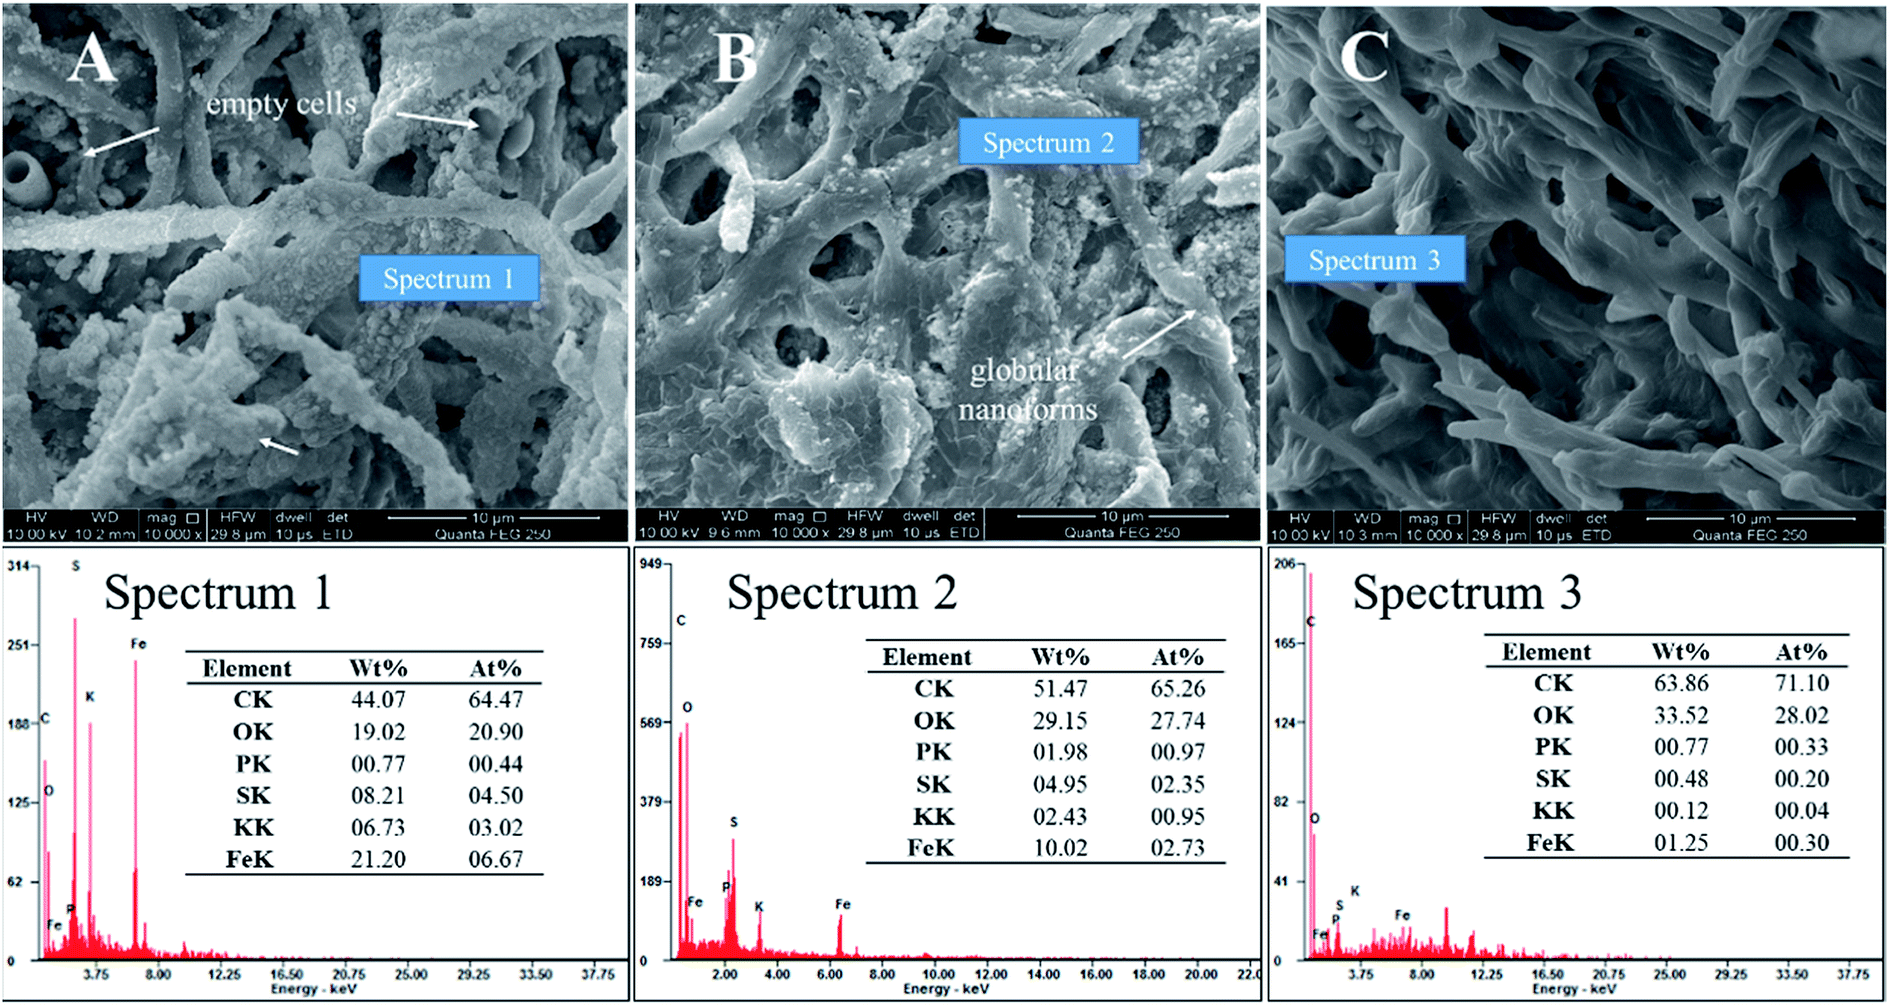 | ||
| Fig. 6 SEM micrographs showed the effect of EPS on biomineralization (pH 2.5, 2nd day): (A) autoclaved method; (B) ultrasonic method; (C) comprehensive method. | ||
In our experiments, we found the efficiency of jarosite formation was noticeably retarded when EPS were stripped. The capacity of EPS to immobilize ions has been extensively reported.36,37 The reacting assembly of EPS supplies active sites to anchor and accumulate the dissolved aqueous ions, facilitating the precipitation and nucleation of minerals by reducing the activation energy barriers.38,39 All these facts indicate that the EPS plays a key role in providing nucleation sites to bind metal ions and facilitating the generation of larger mineral aggregates. Besides, the process was impacted by the pH value obviously in this study, the unformed pellets with uneven size of biomineral were observed and the process takes place outside the cell. There is an independent process of metal ions to bind fungal surface. This is a passive formation process that could be implemented by different morphological cell surface and is on the basis of the ability of cell walls.40 These results all indicated that the process of P. lilacinum promote biosynthesis of jarosite belongs to BIM. Thus, BIM plays a key role in biomineralization process in this article.
3.3 Comparison of FTIR spectrum in different biomineralization periods
The FTIR spectra presented in Fig. 7 revealed the changes of the fungal cell surfaces groups over the eleven-day biomineralization period. At twelve-hour period of biomineralization (Spectrum A), no obvious mineral precipitate could be observed. The peak allocations of EPS are as follows: the bands at 2925 and 2855 cm−1 vest in the asymmetric stretching of –CH2– and symmetric stretching of –CH2–, respectively; the band at 1654 cm−1 vests in the CO stretching in amide I group; near 1556 cm−1 is assigned to the C–N stretching and N–H bending in amide II group.41,42 In the 900–1300 cm−1 spectral range are assigned to the phosphorylated proteins or phosphodiester group.43 Besides, the bands at 811 and 894 cm−1 are assigned to Fe–OH out of-plane and in plane bending vibrations.44 At one day period (Spectrum B), the 2855 cm−1 and 1745 cm−1 bands which were from free EPS had lost most of its intensity, indicating the existence of conformational changes. At two days period of biomineralization (Spectrum C), biomineral grown within the EPS could be observed. The appearance of new band at 1014 cm−1 is due to the stretching vibration of P–O–Fe bonds.45–47 Near 1084 cm−1 vest in the symmetric stretching of O–P–C.48 At four days period (spectrum D), there are well separated bands at 474 and 515 cm−1 are assigned to the vibration of the FeO6 octahedron, the band at 630 cm−1 vest in the stretching vibration of SO42−.49,50
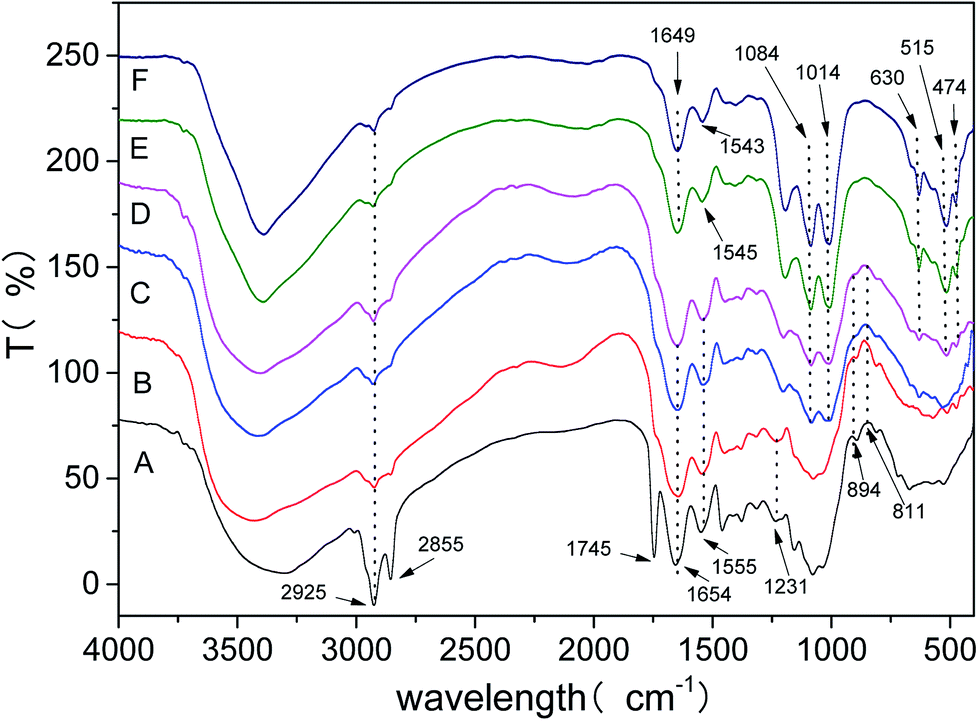 | ||
| Fig. 7 FTIR spectra of different biomineralization periods (pH 2.5). Spectra A–F are at 12th hours and 1st, 2nd, 4th, 6th, 11th day, respectively. | ||
In this experiment, by monitoring the FTIR marker bands insight was obtained in the role of the EPS to jarosite formation. We found that the FTIR spectra of the fungal cell surface groups changed with the biomineralization process, and the variation in frequency and intensity of the biofilm market bands indicated the existence of compositional and structural changes. The EPS spectrum of amide I group (1654 cm−1) and amide II group (1556 cm−1) turned into 1649 cm−1 and 1543 cm−1 (Spectrum F) for the EPS-jarosite complex, respectively. In the surface of attached microorganisms, the variation in intensity and frequency of amide I group has been observed and the characteristic absorption peak of biofilm formation have been observed.43 The transform indicated that the proteins of EPS were drawn into the EPS mineralization and absorption on jarosite.27 Besides, the band at 1231 cm−1 was due to the stretching vibration of PO, which in the spectrum of bulk EPS was gradually disappeared with the mineral precipitate process (Spectrum A and B). This phenomenon also manifested that the electron concentration of the phosphorous atoms was weakened and the free PO2− was missing47 Most significantly was the appearance of stretching vibrations of P–O–Fe bonds (Spectrum C–F) and the vanishment of bending vibrations of Fe–OH band (Spectrum A–D), the phenomenon was associated with the process of Fe(OH)3 transformed into jarosite at the last step of de-ironing. Finally, the vibration bands of the FeO6 octahedron and SO42− were gradually separated with time (Spectrum D–F) that were consistent with the evolution process of the crystal structure of mineral precipitate. All of these results showed that the biomineralization might result of the existence of free PO group acted as nuclei sites for the process of jarosite formation, possibly promoting Fe(OH)3 transformed into jarosite by the formation of P–O–Fe bonds between jarosite Fe metal centers and phosphoryl groups.
4 Conclusion
Our results showed that P. lilacinum could obviously improve the initial rate of jarosite formation by secreting EPS and reduce dependence of biomineralization upon pH value. The free group of PO in EPS serving as nucleation sites promoted the transformation of Fe(OH)3 into KFe3(SO4)2(OH)6 by forming P–O–Fe bonds between phosphoryl groups and Fe3+ metal centers in jarosite. The information got in this research is of important significance for understanding the mechanisms of biomineralization mediated by fungi in acid environment. In the near future, we will look deeper into the role of key components of EPS in the biomineralization process.
Conflicts of interest
There are no conflicts to declare.Acknowledgements
This work was supported by the National Natural Science Foundation of China (No. 31470230, 51320105006, 51604308), the Youth Talent Foundation of Hunan province of China (2017RS3003), Natural Science Foundation of Hunan Province of China (No.2018JJ2486).References
- J. R. Young, S. A. Davis, P. R. Bown and S. Mann, J. Struct. Biol., 1999, 126, 195 CrossRef PubMed
.
- I. A. Aksay, M. Trau, S. Manne, I. I. Honma, N. Yao, L. Zhou, P. Fenter, P. M. Eisenberger and S. M. Gruner, Science, 1996, 273, 892–898 CrossRef PubMed
- K. W. Bladh, Econ. Geol., 1982, 77, 176–184 CrossRef
- M.-C. Xia, P. Bao, A. J. Liu, S.-S. Zhang, T.-J. Peng, L. Shen, R.-L. Yu, X.-L. Wu, J.-K. Li, Y.-D. Liu, M. Chen, G.-Z. Qiu and W.-M. Zeng, J. Biosci. Bioeng., 2018, 126(1), 78–87 CrossRef PubMed
- J. M. Bigham, U. Schwertmann, S. J. Traina, R. L. Winland and M. Wolf, Geochim. Cosmochim. Acta, 1996, 60, 2111–2121 CrossRef
- D. Craw, Miner. Deposita, 2006, 41, 357–368 CrossRef
- G. Klingelhöfer, R. V. Morris, B. Bernhardt, C. Schröder, D. S. Rodionov, P. A. de Souza Jr, A. Yen, R. Gellert, E. N. Evlanov and B. Zubkov, Science, 2004, 306, 1740–1745 CrossRef PubMed
- W. H. Farrand, T. D. Glotch, J. W. Rice Jr, J. A. Hurowitz and G. A. Swayze, Icarus, 2009, 204, 478–488 CrossRef
- M. Oggerin, F. Tornos, N. Rodriguez, C. del Moral, M. Sanchez-Roman and R. Amils, Environ. Microbiol., 2013, 15, 2228–2237 CrossRef PubMed
- S. K. Das, J. Liang, M. Schmidt, F. Laffir and E. Marsili, ACS Nano, 2012, 6, 6165–6173 CrossRef PubMed
- B. Ouyang, X. Lu, H. Liu, J. Li, T. Zhu, X. Zhu, J. Lu and R. Wang, Geochim. Cosmochim. Acta, 2014, 124, 54–71 CrossRef
- G. M. Gadd, Microbiology, 2010, 156, 609–643 CrossRef PubMed
- T. J. Beveridge, Annu. Rev. Microbiol., 1989, 43, 147 CrossRef PubMed
- M. Oggerin, N. Rodríguez, M. C. Del and R. Amils, Res. Microbiol., 2014, 165, 719 CrossRef PubMed
- S. Ziegler, S. Ackermann, J. Majzlan and J. Gescher, Environ. Microbiol., 2009, 11, 2329–2338 CrossRef PubMed
- N. Lazaroff, W. Sigal and A. Wasserman, J. Appl. Environ. Microbiol., 1982, 43, 924 Search PubMed
- T. R. R. Bontognali, J. A. Mckenzie, R. J. Warthmann and C. Vasconcelos, Terra Nova, 2014, 26, 72–77 CrossRef
- A.-M. P. Louis, H. Yu, S. L. Shumlas, B. Van Aken, M. A. A. Schoonen and D. R. Strongin, Environ. Sci. Technol., 2015, 49, 7701–7708 CrossRef PubMed
- M. Oggerin, F. Tornos, N. Rodríguez, C. D. Moral, M. Sánchez-Román and R. Amils, Environ. Microbiol., 2013, 15, 2228–2237 CrossRef PubMed
- C. S. Chan, G. D. Stasio, S. A. Welch, M. Girasole, B. H. Frazer, M. V. Nesterova, S. Fakra and J. F. Banfield, Science, 2004, 303, 1656–1658 CrossRef PubMed
- L. Fang, Q. Huang, X. Wei, W. Liang, X. Rong, W. Chen and P. Cai, Bioresour. Technol., 2010, 101, 5774–5779 CrossRef PubMed
- R. Yu, C. Hou, A. Liu, T. Peng, M. Xia, X. Wu, L. Shen, Y. Liu, J. Li, F. Yang, G. Qiu, M. Chen and W. Zeng, Hydrometallurgy, 2018, 176, 97–103 CrossRef
- K. M. McGrath, Adv. Mater., 2001, 13, 989–992 CrossRef
- D. Couchourel, C. Escoffier, R. Rohanizadeh, S. Bohic, G. Daculsi, Y. Fortun and M. Padrines, J. Inorg. Biochem., 1999, 73, 129–136 CrossRef PubMed
- C. A. Andrew, E. Khor and G. W. Hastings, Biomaterials, 1998, 19, 1309–1316 CrossRef PubMed
- T. R. R. Bontognali, C. Vasconcelos, R. J. Warthmann, S. M. Bernasconi, C. Dupraz, C. J. Strohmenger and J. A. Mckenzie, Sedimentology, 2010, 57, 824–844 CrossRef
- L. Fang, Y. Cao, Q. Huang, S. L. Walker and P. Cai, Water Res., 2012, 46, 5613 CrossRef PubMed
- H. Tamura, K. Goto, T. Yotsuyanagi and M. Nagayama, Talanta, 1974, 21, 314–318 CrossRef PubMed
- A. S. Gong, C. H. Bolster, M. Benavides and S. L. Walker, Environ. Eng. Sci., 2009, 26, 1523–1532 CrossRef
- J. E. Jablonski, T. J. Fu, L. S. Jackson and S. M. Gendel, J. AOAC Int., 2010, 93, 213–220 Search PubMed
- H.-j. Li, H.-y. Yang and G.-b. Chen, Trans. Nonferrous Met. Soc. China, 2016, 26, 557–564 CrossRef
- U. Schwertmann and R. M. Cornell, The Iron Oxides, Wiley-CH Verlag GmbH, 2007 Search PubMed
- L. I. Hai-Jun, H. Y. Yang and G. B. Chen, Trans. Nonferrous Met. Soc. China, 2016, 26, 557–564 CrossRef
- D. K. Nordstrom, D. W. Blowes and C. J. Ptacek, Appl. Geochem., 2015, 57, 3–16 CrossRef
- M. Yadav, S. Kumar, R. R. Sinha, I. Bahadur and E. E. Ebenso, J. Mol. Liq., 2015, 211, 135–145 CrossRef
- A. M. Marqués, R. Bonet, M. D. Simon-Pujol, M. C. Fusté and F. Congregado, Appl. Microbiol. Biotechnol., 1990, 34, 429–431 CrossRef
- J. A. Scott and S. J. Palmer, Biotechnol. Lett., 1988, 10, 21–24 CrossRef
- K. O. Konhauser, Earth-Sci. Rev., 1998, 43, 91–121 CrossRef
- S. Mann, Nature, 1988, 332, 119–124 CrossRef
- M. U. Mera, M. Kemper, R. Doyle and T. J. Beveridge, J. Appl. Environ. Microbiol., 1992, 58, 3837 Search PubMed
- B. Cao, B. Ahmed, D. W. Kennedy, Z. Wang, L. Shi, M. J. Marshall, J. K. Fredrickson, N. G. Isern, P. D. Majors and H. Beyenal, Environ. Sci. Technol., 2011, 45, 5483–5490 CrossRef PubMed
- J. Wei, A. Saxena, B. Song, B. B. Ward, T. J. Beveridge and S. C. B. Myneni, Langmuir, 2004, 20, 11433–11442 CrossRef PubMed
- A. Adamou, G. Manos, N. Messios, L. Georgiou, C. Xydas and C. Varotsis, Bioresour. Technol., 2016, 214, 852–855 CrossRef PubMed
- H. D. Ruan, R. L. Frost and J. T. Kloprogge, Spectrochim. Acta, Part A, 2001, 57, 2575–2586 CrossRef
- A. Omoike, J. Chorover, K. D. Kwon and J. D. Kubicki, Langmuir, 2004, 20, 11108–11114 CrossRef PubMed
- J. Sheals, A. Staffan Sjöberg and P. Persson, Environ. Sci. Technol., 2002, 36, 3090 CrossRef PubMed
- B. C. Barja, a. M. Isabel TejedorTejedor and M. A. Anderson, Langmuir, 1999, 15, 2316–2321 CrossRef
- M. Cagnasso, V. Boero and J. Chorover, Colloids Surf., B, 2010, 76, 456–467 CrossRef PubMed
- N. Lazaroff, L. Melanson, E. Lewis, N. Santoro and C. Pueschel, Geomicrobiol. J., 1985, 4, 231–268 CrossRef
- D. Baron and C. D. Palmer, Geochim. Cosmochim. Acta, 1996, 60, 185–195 CrossRef
| This journal is © The Royal Society of Chemistry 2018 |