
 Open Access Article
 This Open Access Article is licensed under a
 Creative Commons Attribution 3.0 Unported Licence
Remarkable colorimetric sensing behavior of pyrazole-based chemosensor towards Cu(II) ion detection: synthesis, characterization and theoretical investigations†
Nagaraj Nayaka,
Kollur Shiva Prasad *a,
Renjith Raveendran Pillaib,
Stevan Armakovićc and
Sanja J. Armakovićd
*a,
Renjith Raveendran Pillaib,
Stevan Armakovićc and
Sanja J. Armakovićd
aChemistry Group, Manipal Centre for Natural Sciences, Manipal Academy of Higher Education (MAHE), Manipal, Karnataka – 576 104, India. E-mail: shivachemist@gmail.com
bDepartment of Physics, TKM College of Arts and Science, Karicode, Kollam, Kerala, India
cUniversity of Novi Sad, Faculty of Sciences, Department of Physics, Trg D. Obradovića 4, 21000 Novi Sad, Serbia
dUniversity of Novi Sad, Faculty of Sciences, Department of Chemistry, Biochemistry and Environmental Protection, Trg D. Obradovića 3, 21000 Novi Sad, Serbia
First published on 17th May 2018
Abstract
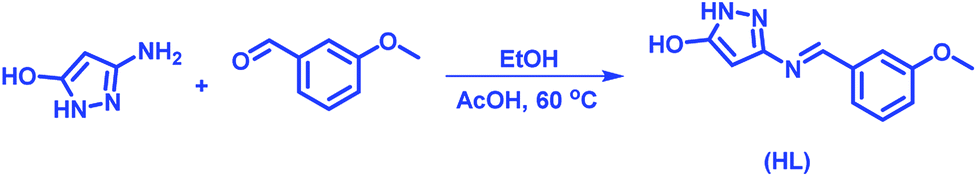
We report the synthesis of a new imine based ligand, 3-((3-methoxybenzylidene)amino)-1H-pyrazol-5-ol (HL) and its Cu(II) complexes in 2![[thin space (1/6-em)]](https://www.rsc.org/images/entities/char_2009.gif) :1 (HL:metal) and 1:1:1 (HL:metal:HQ) stoichiometric ratio using 8-hydroxyquinoline (HQ) as an additional bidentate ligand. The synthesized ligand (HL) and its Cu(II) complexes (1 and 2) are structurally characterized using FT-IR, electronic absorption and emission, NMR and MS techniques. Furthermore, the complexation of Cu2+ with HL leads to the immediate formation of brown colour solution which indicates that HL can act as simple colorimetric sensor for Cu2+ ions. We further investigated that the sensor could selectively bind to the Cu2+ ions even in the presence of competitive ions such as Mn2+, Fe2+, Co2+, Ni2+, Zn2+, Ag+ and Na+ ions in aqueous solutions which was studied by electronic absorption spectroscopy. The HL ligand has been investigated for its reactive properties by density functional theory (DFT) calculations. Quantum molecular descriptors describing local reactive properties have been calculated in order to identify the most reactive molecule sites of title compounds. DFT calculations encompassed molecular electrostatic potential (MEP), local average ionization energies (ALIE), Fukui functions and bond dissociation energies for hydrogen abstraction (H-BDE).
:1 (HL:metal) and 1:1:1 (HL:metal:HQ) stoichiometric ratio using 8-hydroxyquinoline (HQ) as an additional bidentate ligand. The synthesized ligand (HL) and its Cu(II) complexes (1 and 2) are structurally characterized using FT-IR, electronic absorption and emission, NMR and MS techniques. Furthermore, the complexation of Cu2+ with HL leads to the immediate formation of brown colour solution which indicates that HL can act as simple colorimetric sensor for Cu2+ ions. We further investigated that the sensor could selectively bind to the Cu2+ ions even in the presence of competitive ions such as Mn2+, Fe2+, Co2+, Ni2+, Zn2+, Ag+ and Na+ ions in aqueous solutions which was studied by electronic absorption spectroscopy. The HL ligand has been investigated for its reactive properties by density functional theory (DFT) calculations. Quantum molecular descriptors describing local reactive properties have been calculated in order to identify the most reactive molecule sites of title compounds. DFT calculations encompassed molecular electrostatic potential (MEP), local average ionization energies (ALIE), Fukui functions and bond dissociation energies for hydrogen abstraction (H-BDE).
Introduction
Cost effective colorimetric chemical sensors with simple design have attracted a tremendous interest in monitoring many environmental and biologically relevant species such as metal ions over the past few years.1–4 When compared with electrochemical and fluorescent chemosensors, the colorimetric methods are more promising for the detection of metal ions especially in the field because of naked eye detection. The Cu2+ ion is one of the most important divalent metal ions in the human body.5 The pivotal role of Cu2+ ion in most living organisms includes its key role in metabolism and immune system.6 On the other hand, the presence of excess of Cu2+ ion concentration in the organisms may cause lethal issues.7,8 Several methods such as atomic absorption spectroscopy,9 inductively coupled plasma mass spectrometry (ICP-MS),10 inductively coupled plasma atomic emission spectrometry (ICP-AES)11 are available for the determination of metal ions with some major disadvantages like sample destruction, high cost, necessary pretreatment procedures etc. Furthermore, there are many reports about the synthesis and use of chemosensors as metal ion probes with low to moderate detection ability.12–15 For instance, Goswami et al., reported a highly selective colorimetric as well as fluorimetric sensor which could detect Cu2+ ions at a concentration as low as 5 μM.16 Kim et al., have recently shown a naked eye chemosensor for the simultaneous detection of copper and iron ions,17 with Cu2+ ions detection limit 2.9 μM, which is well below the recommended value (31.5 μM) of the World Health Organization in drinking water. Duraisamy et al., have developed a thiophene-based ligand for the detection of heavy metal ions and reported their computational studies and application in living cells.18 In addition, there are several recent reports on graphene oxide and silica-based materials used as probes for the detection of ions/organic molecules.19–21 Hence, the design and synthesis of low cost, non-natural sensors for Cu2+ ion detection is important and being continuous interest for researchers as it is a challenging task in terms of obtaining selective and specific sensor.Even though there are many reports available in the area of colorimetric as well as fluorescent sensors for sensing Cu2+ ions,22,23 those colorimetric sensors which are prepared by cost effective synthetic methods are relatively seldom.24 Further, those colorimetric sensors which can respond at extremely low concentration of analyte are in high demand in the analytical and scientific areas, since, such low concentration of analyte(s) can be presently detected by expensive instrumentations and synthetically complex molecular systems, like porphyrins.25 Schiff base ligands have been proven to be the best ligands for coordination complexes because of their directionality towards metal coordination and the strength of such bond. Moreover, several of the previously reported sensors for Cu2+ ions simultaneously sense other competitive ions.17 Thus, design and construction of a cost-effective, simple and highly specific chemosensor that can be used as a colorimetric sensor for metal ion detection is of prime interest and greatest challenge as well.
Considerable attention has been extended over a decade to the heterocycles containing more than one hetero-atom, namely, imidazole, pyrazole, pyrazine, pyrimidine etc. with potential donor sites to form various metal coordination complexes. In these type of interaction, the π-electrons on the heteroatom actively participate in the formation of stable metal–ligand (M–L) bonds during metallation.26 Since, pyrazole and its derivatives act as stronger π-donor and weaker π-acceptor than the six membered heterocyclic analogues they behave as hard donors during complexation with metal ion. The multidimensional applications of pyrazole derivatives and their coordination compounds have witnessed in diverse disciplines of sciences.27–30 The electronic behaviour of pyrazole based ligands and their metal complexes are of prime interest because of typical behaviour of pyrazole backbone in stabilizing the electronic and optical properties of metal complexes.31–33 DFT calculations have been widely accepted as indispensable computational tools for prediction of reactive properties of new molecules, complexes and nanomaterials.34–41
In the present study, we have synthesized and characterized HL and its Cu(II) complexes (1 and 2). Further, the HL is used as colorimetric sensor for the detection of Cu2+ ion in the presence of various competing ions. We also report the sensitivity of HL in Cu2+ ion detection, and is found to be 1.6 μM which is much lower than the recommended value (31.5 μM) of the World Health Organization for drinking water. We also performed the calculations of quantum-molecular descriptors that describe local reactivity included molecular electrostatic potential (MEP) and local average ionization energies (ALIE) obtained by mapping of their values to the electron density surface. In order to better understand fundamental properties of HL ligand, additionally Fukui functions and bond dissociation energies for hydrogen abstraction (H-BDE) have been investigated as well.
Experimental section
Materials and methods
3-Amino-5-hydroxypyrazole and m-anisaldehyde were purchased from Sigma Aldrich and were used as received. The solvents were purchased from Merck and used without further purification. The completion of reaction was monitored by thin layer chromatography (TLC) performed on pre-coated silica-gel plates (Merck, India) and spots were visualized by UV irradiation. FT-IR spectral measurements were recorded on Perkin-Elmer spectrometer version 10.03.09 (KBr pellet technique). 1H and 13C NMR were obtained using a 500 MHz Bruker Avance DPX spectrometer with TMS as internal standard. HR-ESI-MS analysis was performed on a Thermo Scientific Exactive mass spectrometer by electrospray ionization technique. The electronic absorption spectra were recorded using UV1800 spectrophotometer (Shimadzu). Steady-state fluorescence experiments were performed with a SPEX Fluorolog F112X spectrofluorometer by using optically dilute solutions.Computational details
DFT calculations on HL ligand and its corresponding Cu(II) complexes have been performed with Jaguar42–44 program. Prior to DFT calculations all possible conformers of HL were generated with MacroModel38 program using OPLS3 (ref. 45–47) force field. Obtained conformers were then geometrically optimized within the framework of DFT with B3LYP48 exchange-correlation functional. The lowest energy conformation was checked for its ground state by vibrational analysis which yielded only positive frequencies. For all DFT calculations a LACVP(d,p) basis set was employed. Maestro49 program was used for preparation of input files and visualization of results. Maestro, MacroModel and Jaguar programs were used as incorporated in Schrödinger Materials Science Suite 2017-4.50Chemical synthesis
 | ||
| Scheme 1 Synthesis of 3-((3-methoxybenzylidene)amino)-1H-pyrazol-5-ol (HL). | ||
Yield: 197 mg (91%). FT-IR (KBr pellet, cm−1) 3164–3325 (broad, –OH and –NH), 2991 (aromatic –CH), 2836 (–OCH3), 1592 (C![[double bond, length as m-dash]](https://www.rsc.org/images/entities/char_e001.gif) N), 1269 (C–O), 1039 (C–N). 1H NMR (DMSO-d6): δ 9.1 (s, 1H), 9.09 (s, 2H), 7.2 (t, 1H, J = 5 Hz), 7.06 (t, 2H, J = 5 Hz), 6.9 (d, 1H, J = 5 Hz), 6.8 (d, 1H, J = 5 Hz), 6.7 (t, 1H, J = 5 Hz), 6.6 (d, 1H); 5.3 (s, 1H), 6.9 (d, 1H, J = 5 Hz), 4.5 (s, 1H), 4.1 (s, 1H), 3.7 (s, 3H), 3.6 (s, 3H). 13C NMR (DMSO-d6, ppm): δ 171.6, 158.1, 157.2, 156.2, 136.8, 128.2, 126.9, 120.8, 120.4, 114.3, 113.4, 112.2, 110.9, 81.6, 60, 56.3, 54.3 and 43.06 (ESI).† ESI-MS calculated for C11H11N3O2 [M + H]+: 218.09 and found is 218.09 (monomer mass) and calculated is 435.17 and found is 435.177 (dimer mass).
N), 1269 (C–O), 1039 (C–N). 1H NMR (DMSO-d6): δ 9.1 (s, 1H), 9.09 (s, 2H), 7.2 (t, 1H, J = 5 Hz), 7.06 (t, 2H, J = 5 Hz), 6.9 (d, 1H, J = 5 Hz), 6.8 (d, 1H, J = 5 Hz), 6.7 (t, 1H, J = 5 Hz), 6.6 (d, 1H); 5.3 (s, 1H), 6.9 (d, 1H, J = 5 Hz), 4.5 (s, 1H), 4.1 (s, 1H), 3.7 (s, 3H), 3.6 (s, 3H). 13C NMR (DMSO-d6, ppm): δ 171.6, 158.1, 157.2, 156.2, 136.8, 128.2, 126.9, 120.8, 120.4, 114.3, 113.4, 112.2, 110.9, 81.6, 60, 56.3, 54.3 and 43.06 (ESI).† ESI-MS calculated for C11H11N3O2 [M + H]+: 218.09 and found is 218.09 (monomer mass) and calculated is 435.17 and found is 435.177 (dimer mass).
N), 1258 (C–O) and 1039 (C–N). ESI-MS calculated for C22H22N6O4Cu [M]+: 497.17 and found is 497.100 (ESI).†N), 1597, 1482, 1378 (C–O) and 1114 (C–N). ESI-MS calculated for C20H16N4O3Cu [M]+: 423.05 and found is [M + K]+: 462.81 (ESI).†Results and discussion
The ligand (HL) was obtained according to the synthetic route showed in Scheme 1. The spectroscopic data provided information in deducing molecular structure of compounds. The proposed structures of 1 and 2 are showed in Fig. 1.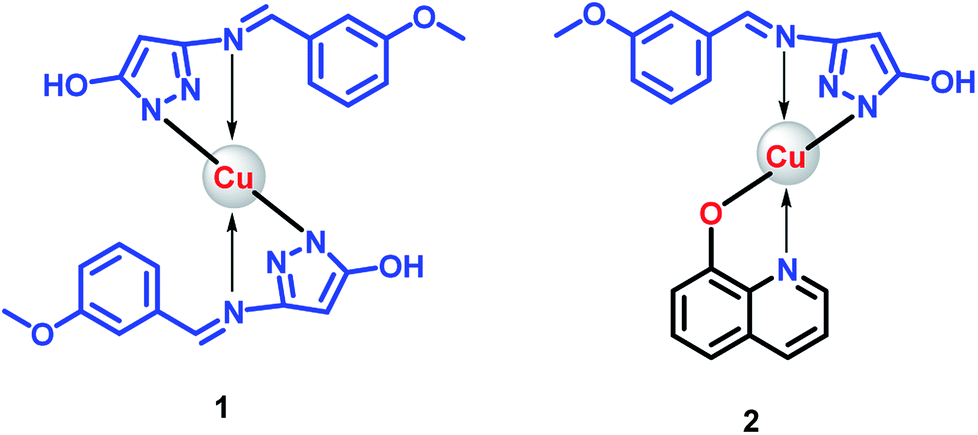 | ||
| Fig. 1 Proposed structures for Cu(II) complexes. | ||
One of the surprising observations is that the ligand existed in dimeric state which is evident from its 1H NMR and ESI-MS spectra. (The repeated purification of the ligand resulted in similar NMR). The formation of stable 6 membered ring structures because of hydrogen bonding interaction between pyrazole moieties may be the reason for dimer formation. A clear evidence for the dimer formation could be seen by analysing the NMR spectra of HL and proposed structure of dimer is shown along with NMR spectra in Fig. 2.
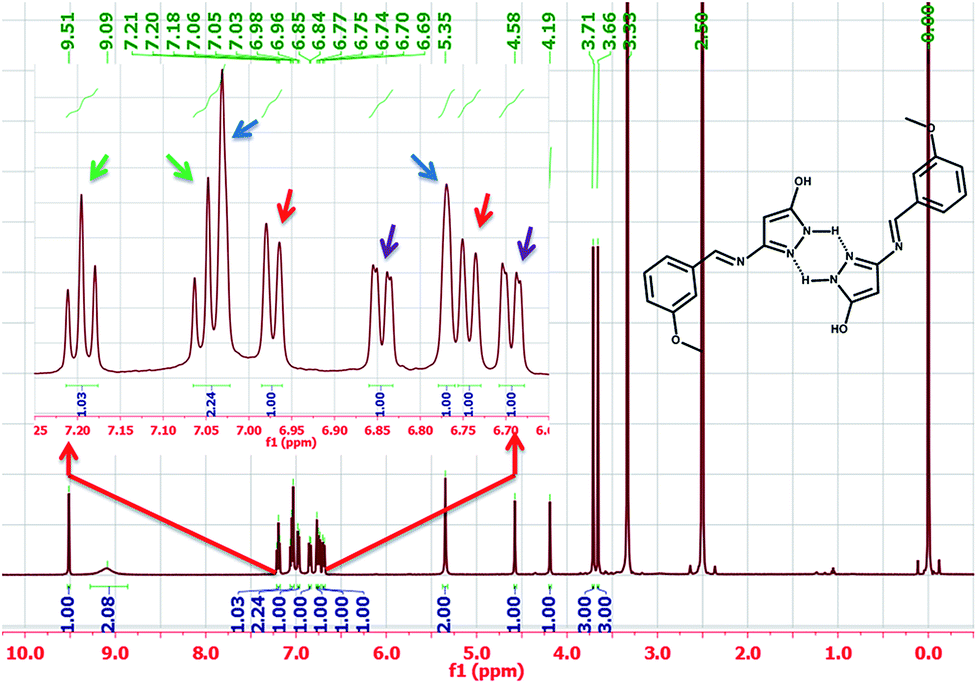 | ||
| Fig. 2 The proton NMR spectrum of HL ligand. | ||
The aromatic peaks of the HL are shown as inset which consists of four pairs of peaks with similar integration and similar splitting nature. Surprisingly, all these peaks had an integration of one proton, suggesting that each pair of these peaks belong to same kind of protons from two different parts of dimer. The picture was more clear when we recorded the mass spectra of the HL, which even in dilute solution showed two prominent mass peaks which corresponds to monomeric and dimeric species (Fig. 3).
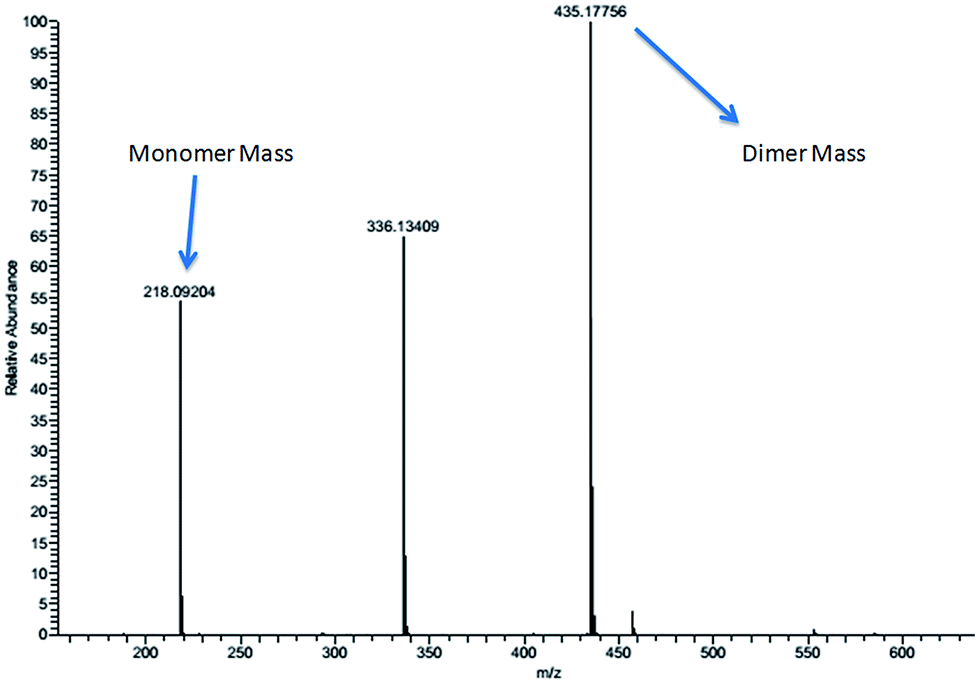 | ||
| Fig. 3 The ESI-MS spectrum of compound HL showing monomeric and dimeric species. | ||
The IR spectra for both ligand and its copper complexes are shown in ESI.† The IR band which appeared at 1592 cm−1 for the free ligand (HL) is due to CHN group, showed a considerable shift towards higher wave numbers (1609 cm−1 in 1 and 1693 cm−1 in 2) which suggests that the azomethine group is involved in the coordination to copper ion in both the complexes. Further, the peak around 3200 cm−1 due to –OH and –NH of ligand became further broad possibly due to the involvement of –NH group in the coordination of copper center.
In order to evaluate the photophysical properties of ligand and metal complexes, the electronic absorption and emission spectra were recorded using their DMSO solution. As shown in Fig. 4, the HL showed characteristic absorption around 250 nm to 290 nm with emission extending up to 400 nm. Further, the absorption spectrum of complex 1 showed a broad peak extending upto 450 nm while the complex 2 showed a small new band near 420 nm. The emission profile of the two complexes were similar to parent ligand but the presence of metal has essentially quenched the ligands emission.
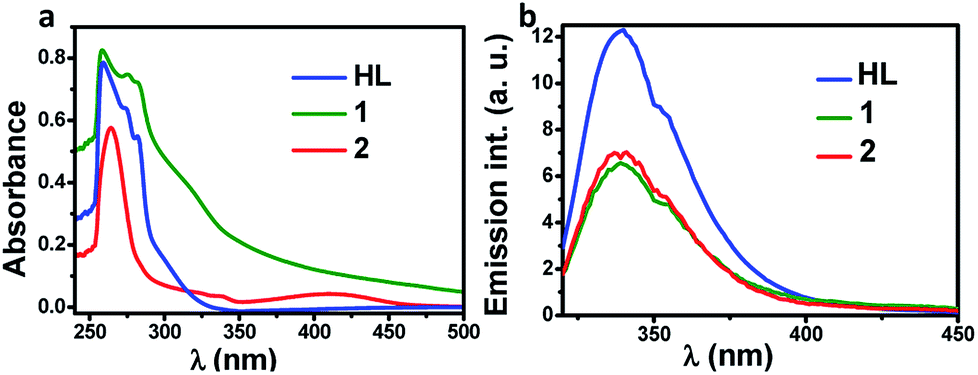 | ||
| Fig. 4 The absorption (a) and emission (b) spectra of HL and its complexes, 1 and 2 recorded in DMSO. | ||
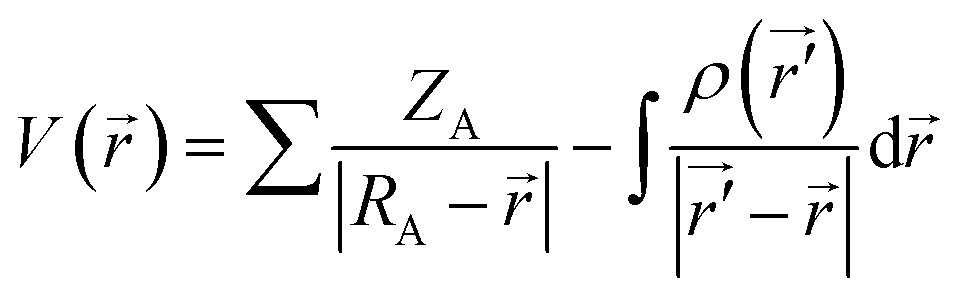
MEP surfaces are frequently used descriptors for description of local reactivity properties. This descriptor is visualized by mapping of its values to the electron density surface and is regarded as a fundamental quantity describing reactivity of molecules. MEP, V(r), is defined according to the next equation:
 | (1) |
Neglecting polarization and nuclear rearrangement effects due to the presence of a unit test charge at distance r. In eqn (1) ρ(r′) denotes molecule's electron density, while summation is performed over all nuclei A with charge ZA and coordinate RA. V(r) is interpreted as potential exerted at coordinate r by nuclei and electrons, whereas the sign of this descriptor at any point indicates whether the effects of electron or nuclei is dominant.51,52 Molecule sites with the lowest/highest values of MEP indicate areas where electrostatic interactions with other molecules might occur. Taking everything into account, it can be concluded that MEP surface is very useful descriptor for identification of molecule sites prone to electrophilic attacks.
However, identification of molecule sites prone to electrophilic attacks might be better performed employing the ALIE descriptor. ALIE gives the information about the energy required to remove an electron from molecule and having said that the locations of its lowest values indicate sites sensitive towards electrophilic attacks. Same as MEP, this descriptor is visualized by mapping of its values to the electron density surface. ALIE was defined as a sum of orbital energies weighted by the orbital densities,53,54 according to the following equation:
 | (2) |
![[r with combining right harpoon above (vector)]](https://www.rsc.org/images/entities/i_char_0072_20d1.gif) ) in eqn (2) represents the electronic density of the i-th molecular orbital at the point ,εi represents the orbital energy, while ρ() is the total electronic density function.
) in eqn (2) represents the electronic density of the i-th molecular orbital at the point ,εi represents the orbital energy, while ρ() is the total electronic density function.
The identification of the molecule sites prone to electrophilic attacks is certainly the most efficient if both MEP and ALIE surfaces are employed, which has been provided in Fig. 5 for HL ligand.
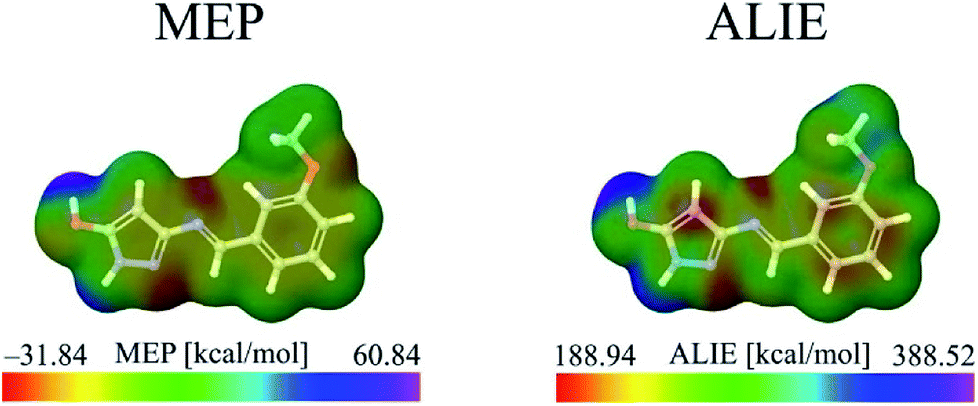 | ||
| Fig. 5 MEP and ALIE surfaces of HL ligand. | ||
Both MEP and ALIE surfaces recognize near vicinity of nitrogen atoms N10 and N15 to be sensitive towards the electrophilic attacks. MEP surface also recognizes near vicinity of oxygen atom O7 to be sensitive to electrophilic attacks. Aside of nitrogen atoms N10 and N15, ALIE surface recognizes several locations within five membered and six membered rings also sensitive towards electrophilic attacks. These locations are near vicinity of carbon atoms C1, C4, C5 and C12.
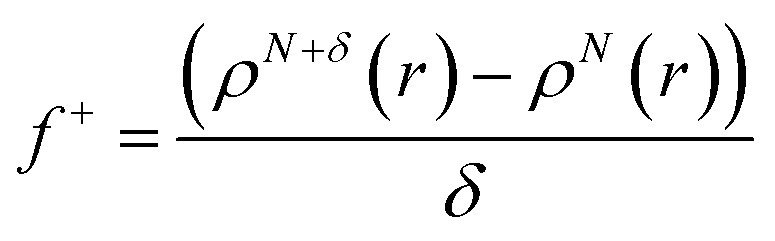
Additionally, local reactive properties of HL ligand were investigated employing the Fukui functions as well. In Jaguar program for DFT calculations, Fukui functions are calculated in finite difference approximation according to the following equations:
 | (3) |
 | (4) |
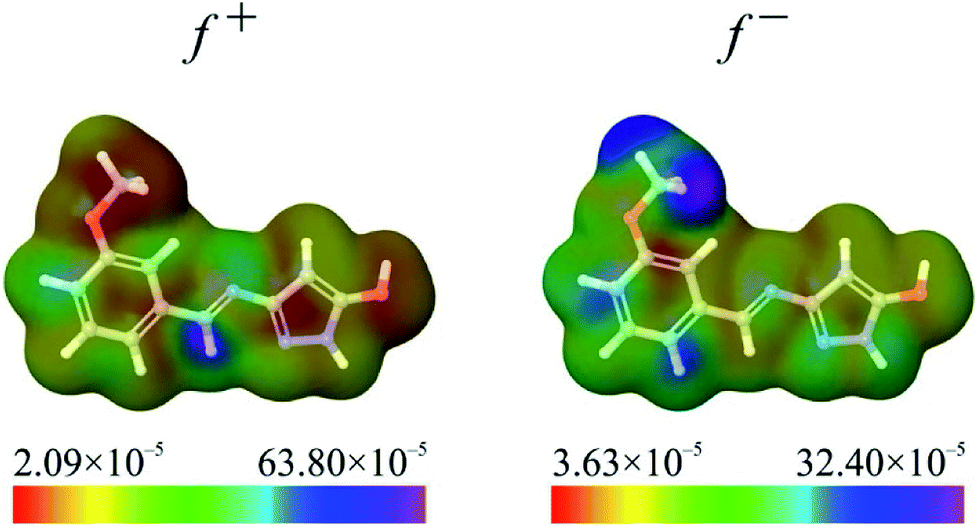 | ||
| Fig. 6 Representative Fukui functions of HL ligand. | ||
Fukui functions indicate how electron density changes with changes of the overall charge. Maximal values of Fukui f+ function, marked with purple colour in left panel of Fig. 6, indicate molecular areas where electron density increased and therefore electrophilic parts of molecule. According to these results, near vicinity of C9–H17 bond is characterized by the increase of electron density as a consequence of charge addition. Minimal values of Fukui f− function, marked with red colour in right panel of Fig. 6, indicate molecular areas where electron density decreased, and therefore nucleophilic parts of molecule. In case of Fukui f− function, results in Fig. 6 indicate that near vicinity of bond C1–C2 are characterized by the electron density decrease as a consequence of charge removal.
Taking into account the importance of oxidative reactions, in this work we have also used DFT calculations to locate molecular sites of HL ligand possible sensitive towards the autoxidation mechanism. Autoxidation mechanism is of great industrial importance and the ability to predict sensitivity of molecular structure towards it is very significant. Autoxidation is correlated with bond dissociation energies for hydrogen abstraction (H-BDE), a parameter which can be used for prediction of sensitivity of molecule towards this mechanism. Molecular sites where H-BDE takes values between 70 kcal mol−1 to 85 kcal mol−1 are considered to be highly sensitive towards autoxidation,55,56 while H-BDE values between 85 kcal mol−1 to 90 kcal mol−1 might indicate certain sensitivity towards autoxidation, but other influences might prevent the autoxidation.57 It should also be mentioned that H-BDE values lower than 70 kcal mol−1 are not indicating sensitivity towards autoxidation mechanism.58,59 H-BDE values for HL ligand have been summarized in Fig. 7.
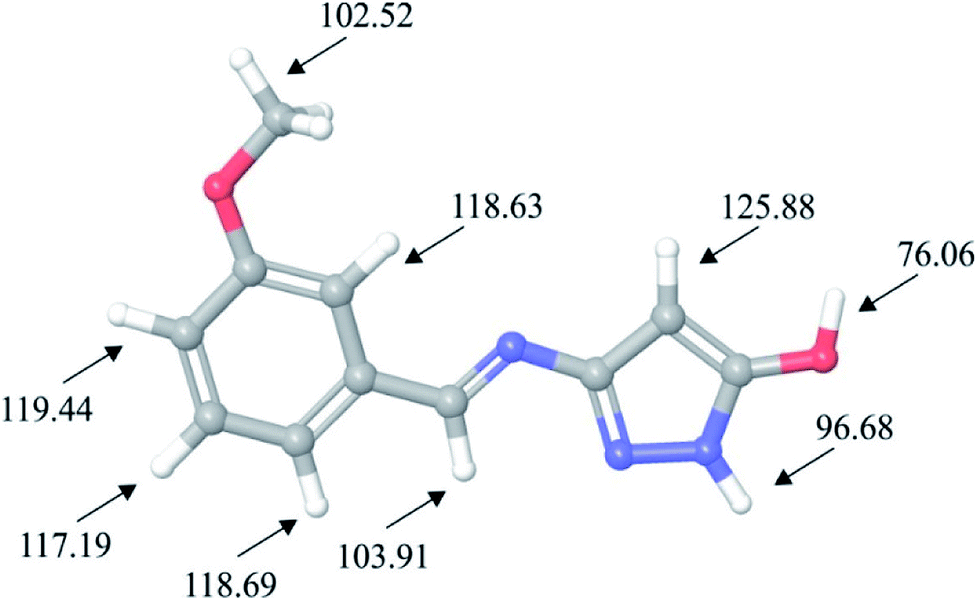 | ||
| Fig. 7 H-BDE values of HL ligand. | ||
H-BDE values provided in Fig. 7 indicate that HL ligand is highly sensitive towards autoxidation mechanism due to the fact that BDE for hydrogen abstraction of hydrogen atom H27 is 76 kcal mol−1. Other H-BDE values are much higher than the desired upper border level of 90 kcal mol−1. Second lowest H-BDE value has been calculated for hydrogen atom of pyrazole ring, but this value is almost 7 kcal mol−1 higher than the upper border level.
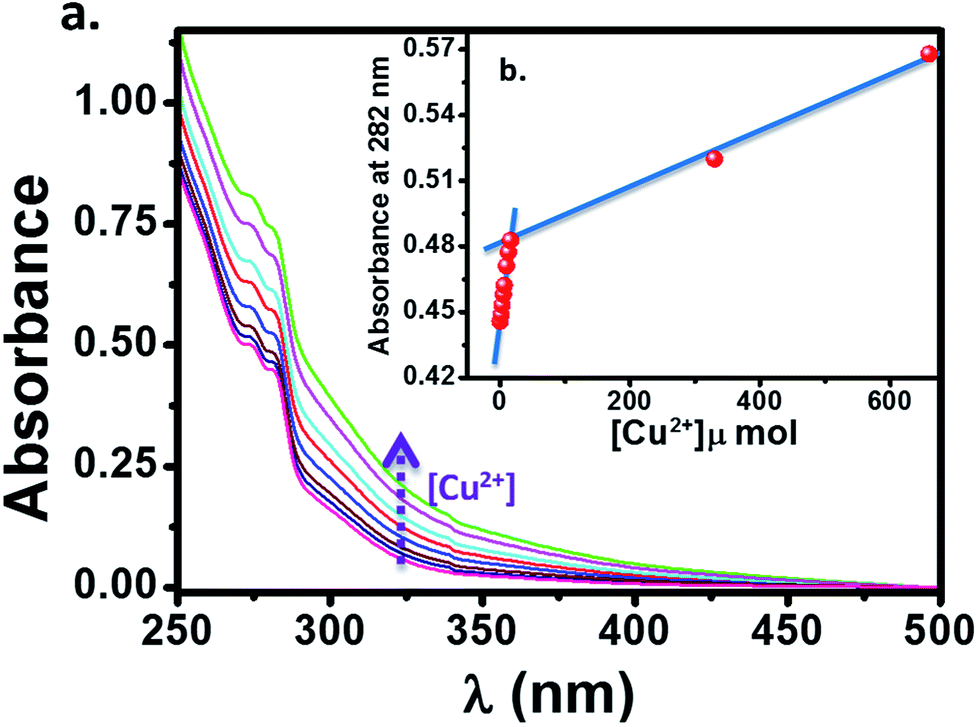
The cation sensing of the chemosensor HL was studied by UV-visible spectroscopy in their water/DMSO (9:1, v/v) solutions. The HL shows two characteristic absorption bands located near 275 and 282 nm in its water/DMSO (9:1, v/v) solution. The change in the absorption spectrum of HL (10 μM) upon addition of aqueous Cu2+ solution is showed in Fig. 8. We observed an enhancement in the absorption peaks of ligand upon addition of Cu2+ solution with simultaneous change in color from colorless to brown. This suggests that, the ligand HL can serve as a potential candidate for “naked eye” Cu2+ sensor. It is to be noted that, there is a linear behaviour (Fig. 8b) in this mole ratio plot until the ratio of ligand to metal concentration is 1:2, after which absorption showed a sharp dip with further increase in the concentration of metal ions (Fig. 9b). This behaviour at lower concentration of Cu2+ can be attributed to the reaction of added Cu2+ with the free HL molecules which otherwise exist largely in dimeric state and thus system follows Beer–Lambert law. On the other hand, as the concentration of Cu2+ is increased, the dimeric state of HL needs to be broken and the formed monomeric species then react with Cu2+ because of which there is a deviation from Beer–Lamberts law in the system. Further, the results from mass spectrometry suggested that the stoichiometry of the complex formed is by refluxing the reactants in appropriate ratios (2:1, ligand:metal). Also, we have tried to plot the Jobs plot for the system which was suggesting that the complex formed in the system is not 1:1, further supporting the mass spectrometric data.
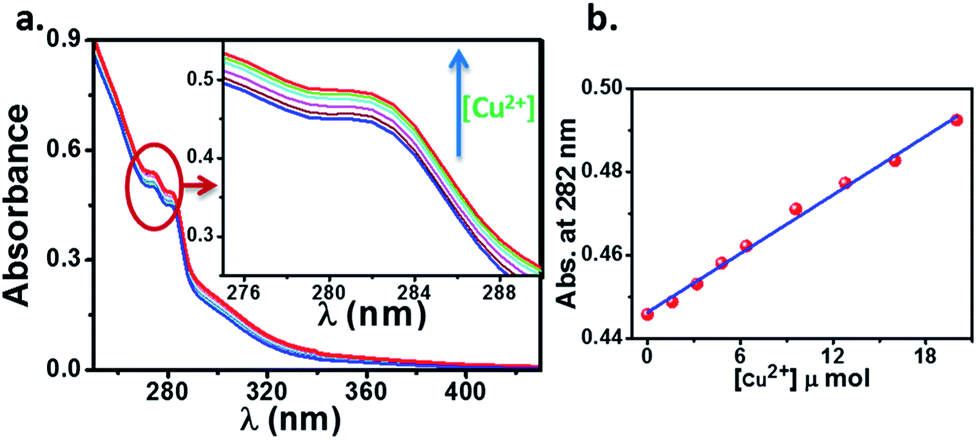 | ||
| Fig. 8 (a) The change in absorption spectrum of HL (10 μM) upon addition of aqueous Cu2+ solution (1.6 μM each time). (b) The concentration dependence of absorption of HL to Cu2+ at lower concentrations (up to 1:2, ligand:metal ratio). | ||
 | ||
| Fig. 9 (a) The change in absorption spectrum of HL (10 μM) upon addition of aqueous Cu2+ solution. (b) The concentration dependence of absorption of HL to Cu2+ at lower concentrations (up to 1:2, ligand:metal ratio) and at higher concentrations (1:150, ligand:metal ratio). | ||
The selectivity of HL towards Cu2+ ions (red trace) and no such distinguishable changes could be observed during the reaction of HL with other tested metal ions (Fig. 10). The phenomenon is more evident from the picture taken from the solutions of HL and target metal ions. We could see immediate brown colorization of the solution only in case of Cu2+ ions. We also estimated by UV-visible studies, the detection limit of HL for Cu2+ was found to be 1.6 μM, which is much lower than the recommended value (31.5 μM) of the World Health Organization (WHO) in drinking water.
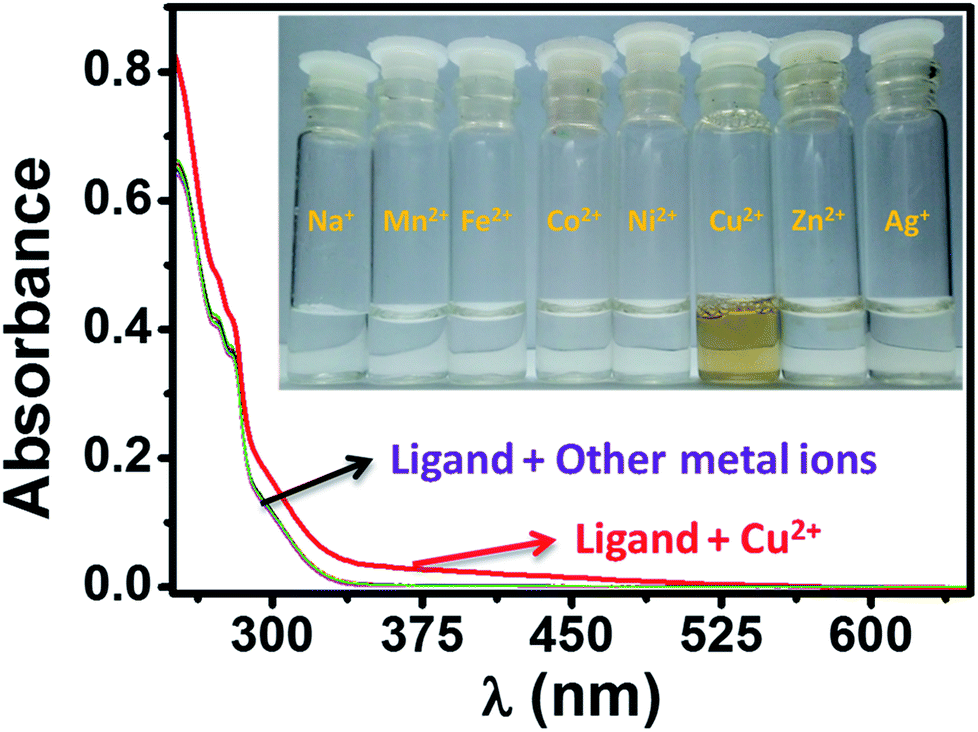 | ||
| Fig. 10 The UV-visible spectra of HL in the presence of two equivalents of Cu2+ (red trace) and in the presence of other metal ions. The inset picture showing the color change during reaction of HL with Cu2+ ion. | ||
Conclusions
To sum up, a Schiff base ligand, 3-((3-methoxybenzylidene)amino)-1H-pyrazol-5-ol, HL and its Cu(II) complexes, 1 and 2 were synthesized and characterized. This study has presented a colorimetric sensor for Cu2+ ion detection. The electronic absorption studies shown that the detection limit of novel ligand, HL for Cu2+ ion was found to be 1.6 μM, which is much lower than the recommended value (31.5 μM) of the World Health Organization in drinking water, thus, can find significant application in the field work as a promising probe. According to MEP and ALIE surfaces HL has several important reactive molecular sites sensitive to electrophilic attacks. The lowest ALIE values were ∼188 kcal mol−1 and this descriptor predicted more reactive sites. Fukui f+ function of HL indicates that electron density increases in the near vicinity of C9–H17 bond, while Fukui f− function indicates that electron density decreases in the near vicinity of C1–C2 bond. H-BDE descriptor indicates very high sensitivity of HL to autoxidation mechanism.Conflicts of interest
The authors have no conflicts to declare.Acknowledgements
NN and KSP are grateful to the Director, Central Instrumentation Facility, Innovation Centre, Manipal Institute of Technology, Manipal Academy of Higher Education, for analytical facilities and to the Director, Manipal Centre for Natural Sciences, Manipal Academy of Higher Education for providing financial support. Part of this work has been performed thanks to the support received from Schrödinger Inc. Part of this study was conducted within the projects supported by the Ministry of Education, Science and Technological Development of Serbia, grant III41017.Notes and references
- M. Ishida, Y. Naruta and F. Tani, Angew. Chem., Int. Ed., 2010, 49, 91–94 CrossRef PubMed.
- J. W. Lee and J. D. Helmann, J. Biol. Chem., 2006, 281, 23567–23578 CrossRef PubMed.
- K. P. Carter, A. M. Young and A. E. Palmer, Chem. Rev., 2014, 114, 4564–4601 CrossRef PubMed.
- S. Yang, B. Yin, L. Xu, B. Gao, H. Sun, L. Du, Y. Tang, W. Jiang and F. Cao, Anal. Methods, 2015, 7, 4546–4551 RSC.
- R. Uauy, M. Olivares and M. Gonzalez, Am. J. Clin. Nutr., 1998, 67, 952S–959S CrossRef PubMed.
- T. W. Sunga and Y. L. Lo, Sens. Actuators, B, 2012, 165, 119–125 CrossRef.
- H. Kozlowski, M. Luczkowski, M. Remelli and D. Valensin, Coord. Chem. Rev., 2012, 256, 2129–2141 CrossRef.
- P. G. Georgopoulos, A. Roy, M. J. Yonone-Lioy, R. E. Opiekun and P. J. Lioy, J. Toxicol. Environ. Health, Part B, 2001, 4, 341–394 Search PubMed.
- A. P. S. Gonzales, M. A. Firmino, C. S. Nomura, F. R. P. Rocha, P. V. Oliveira and I. Gaubeur, Anal. Chim. Acta, 2009, 636, 198–204 CrossRef PubMed.
- J. S. Becker, A. Matusch, C. Depboylu, J. Dobrowolska and M. V. Zoriy, Anal. Chem., 2007, 79, 6047–6080 CrossRef PubMed.
- Y. Liu, P. Liang and L. Guo, Talanta, 2005, 68, 25–30 CrossRef PubMed.
- X. Wang, J. Tao, X. Chen and H. Yang, Sens. Actuators, B, 2017, 244, 709–716 CrossRef.
- S. Thavornpradit, J. Sirirak and N. Wanichacheva, J. Photochem. Photobiol., A, 2016, 330, 55–63 CrossRef.
- Y. B. Wagh, A. Kuwar, S. K. Sahoo, J. Gallucci and D. S. Dalal, RSC Adv., 2015, 5, 45528–45534 RSC.
- J. Kumar, P. K. Bhattacharyya and D. K. Das, Spectrochim. Acta, Part A, 2015, 138, 99–104 CrossRef PubMed.
- S. Goswami, S. Maity, A. K. Das and A. Maity, Tetrahedron Lett., 2013, 54, 6631–6634 CrossRef.
- G. J. Park, G. You, Y. Choi and C. Kim, Sens. Actuators, B, 2016, 229, 257–271 CrossRef.
- U. Duraisamy, S. Sivalingam, V. Sivan and M. Davoodbasha, J. Mol. Recognit., 2014, 27, 151–159 CrossRef PubMed.
- L. Zhang, C. Jiang and Z. Zhang, Nanoscale, 2013, 5, 3773–3779 RSC.
- X. Chen, S. Yu, L. Yang, J. Wang and C. Jiang, Nanoscale, 2016, 8, 13669–13677 RSC.
- J. Zhang, L. He, P. Chen, C. Tian, J. Wang, B. Liu, C. Jiang and Z. Zhang, Nanoscale, 2017, 9, 1599–1606 RSC.
- H. Tavallali, G. Deilamy-Rad, A. Moaddeli and K. Asghari, Sens. Actuators, B, 2016, 244, 1121–1128 CrossRef.
- K. Shanmugaraj and M. Ilanchelian, RSC Adv., 2016, 6, 54518–54524 RSC.
- M. S. Kim, J. Jung, H. Mi Ahn and C. Kim, J. Coord. Chem., 2018, 71, 355–370 CrossRef.
- L. Li, S. Shen, R. Lin, Y. Bai and H. Liu, Chem. Commun., 2017, 53, 9986–9989 RSC.
- C. Pettinari and R. Pettinari, Coord. Chem. Rev., 2005, 249, 663–691 CrossRef.
- M. V. Chumillas, S. Tanase, L. J. de Jongh and J. Reedijk, Eur. J. Inorg. Chem., 2010, 2010, 3403–3418 CrossRef.
- T. Harit, F. Malek, B. El Bali, A. Khan, K. Dalvandi, B. P. Marasini, S. Noreen, R. Malik, S. Khan and M. I. Choudhary, Med. Chem. Res., 2012, 21, 2772–2778 CrossRef.
- M. Sobiesiak, I. P. Lorenz, P. Mayer, M. Wozniczka, A. Kufelnicki, U. Krajewska, M. Rozalski and E. Budzisz, Eur. J. Med. Chem., 2011, 46, 5917–5926 CrossRef PubMed.
- M. Sobiesiak, K. Sobiesiak, A. Mrozek, P. Mayer, I. P. Lorenz, M. Rozalski, U. Krajewska and E. Budzisz, Inorg. Chim. Acta, 2010, 363, 2171–2179 CrossRef.
- M. Daoudi, N. B. Larbi, A. Kerbal, B. Bennani, J. P. Launay, J. Bonvoisin, T. B. Hadda and P. H. Dixneuf, Tetrahedron, 2006, 62, 3123–3127 CrossRef.
- I. N. Stepanenko, B. Cebrián-Losantos, V. B. Arion, A. A. Krokhin, A. A. Nazarov and B. K. Keppler, Eur. J. Inorg. Chem., 2007, 3, 400–411 CrossRef.
- I. A. Guzei, K. Li, G. A. Bikzhanova, J. Darkwa and S. F. Mapolie, Dalton Trans., 2003, 715–722 RSC.
- T. Andersson, A. Broo and E. Evertsson, J. Pharm. Sci., 2014, 103, 1949–1955 CrossRef PubMed.
- S. Armaković, S. J. Armaković and S. Koziel, Carbon, 2017, 111, 371–379 CrossRef.
- S. Armaković, S. J. Armaković, M. Vraneš, A. Tot and S. Gadžurić, J. Mol. Liq., 2016, 222, 796–803 CrossRef.
- P. Lienard, J. Gavartin, G. Boccardi and M. Meunier, Pharm. Res., 2015, 32, 300–310 CrossRef PubMed.
- Y. S. Mary, V. Aswathy, C. Y. Panicker, A. Bielenica, P. Brzózka, O. Savczenko, S. Armaković, S. J. Armaković and C. Van Alsenoy, RSC Adv., 2016, 6, 111997–112015 RSC.
- M. M. Radanović, M. V. Rodić, S. Armaković, S. J. Armaković, L. S. Vojinović-Ješić and V. M. Leovac, J. Coord. Chem., 2017, 70, 2870–2887 CrossRef.
- M. M. Radanović, M. V. Rodić, L. S. Vojinović-Ješić, S. Armaković, S. J. Armaković and V. M. Leovac, Inorg. Chim. Acta, 2018, 473, 160–168 CrossRef.
- B. B. Holló, J. Magyari, S. Armaković, G. A. Bogdanović, M. V. Rodić, S. J. Armaković, J. Molnár, G. Spengler, V. M. Leovac and K. M. Szécsényi, New J. Chem., 2016, 40, 5885–5895 RSC.
- A. D. Bochevarov, E. Harder, T. F. Hughes, J. R. Greenwood, D. A. Braden, D. M. Philipp, D. Rinaldo, M. D. Halls, J. Zhang and R. A. Friesner, Int. J. Quantum Chem., 2013, 113, 2110–2142 CrossRef.
- Schrödinger, Release 2017-4: Jaguar, Schrödinger, LLC, New York, NY, 2017, vol. 2017 Search PubMed.
- L. D. Jacobson, A. D. Bochevarov, M. A. Watson, T. F. Hughes, D. Rinaldo, S. Ehrlich, T. B. Steinbrecher, S. Vaitheeswaran, D. M. Philipp and M. D. Halls, J. Chem. Theory Comput., 2017, 13, 5780–5797 CrossRef PubMed.
- Schrödinger, Release 2017-4: MacroModel, Schrödinger, LLC, New York, NY, 2017, vol. 2017 Search PubMed.
- E. Harder, W. Damm, J. Maple, C. Wu, M. Reboul, J. Y. Xiang, L. Wang, D. Lupyan, M. K. Dahlgren and J. L. Knight, J. Chem. Theory Comput., 2015, 12, 281–296 CrossRef PubMed.
- D. Shiva Kumar, J. Williams, Y. Wu, W. Damm, J. Shelley and W. Sherman, J. Chem. Theory Comput., 2010, 6, 1509–1519 CrossRef PubMed.
- W. L. Jorgensen, D. S. Maxwell and J. Tirado-Rives, J. Am. Chem. Soc., 1996, 118, 11225–11236 CrossRef.
- W. L. Jorgensen and J. Tirado-Rives, J. Am. Chem. Soc., 1988, 110, 1657–1666 CrossRef PubMed.
- A. D. Becke, J. Chem. Phys., 1993, 98, 5648–5652 CrossRef.
- Schrödinger, Release 2017-4: Maestro, Schrödinger, LLC, New York, NY, 2017 Search PubMed.
- Materials Science Suite 2017-4, Schrödinger, LLC, New York, NY, 2017 Search PubMed.
- N. Özdemir, B. Eren, M. Dincer and Y. Bekdemir, Mol. Phys., 2010, 108, 13–24 CrossRef.
- P. Politzer and J. S. Murray, Theor. Chem. Acc., 2002, 108, 134–142 CrossRef.
- P. Sjoberg, J. S. Murray, T. Brinck and P. Politzer, Can. J. Chem., 1990, 68, 1440–1443 CrossRef.
- P. Politzer, F. Abu-Awwad and J. S. Murray, Int. J. Quantum Chem., 1998, 69, 607–613 CrossRef.
- A. Michalak, F. De Proft, P. Geerlings and R. Nalewajski, J. Phys. Chem. A, 1999, 103, 762–771 CrossRef.
- J. S. Wright, H. Shadnia and L. L. Chepelev, J. Comput. Chem., 2009, 30, 1016–1026 CrossRef PubMed.
- G. Gryn'ova, J. L. Hodgson and M. L. Coote, Org. Biomol. Chem., 2011, 9, 480–490 Search PubMed.
Footnote |
| † Electronic supplementary information (ESI) available. See DOI: 10.1039/c8ra02905a |
| This journal is © The Royal Society of Chemistry 2018 |