 Open Access Article
Hematite iron oxide nanoparticles: apoptosis of myoblast cancer cells and their arithmetical assessment†
Rizwan Wahab *ab,
Farheen Khan*c and
Abdulaziz A. Al-Khedhairya
aZoology Department, College of Science, King Saud University, P. O. Box 2455, Riyadh 11451, Saudi Arabia. E-mail: rwahab05@gmail.com; Tel: +966-536023284
bAl-Jeraisy, chair for DNA research, Zoology Department, College of Science, King Saud University, Riyadh 11451, Saudi Arabia
cChemistry Department, Faculty of Science, Taibah University, Yanbu, Saudi Arabia. E-mail: khanfarheenchem@gmail.com; Tel: +966-571603069
First published on 9th July 2018
Abstract
Hematite (α-Fe2O3) forms iron oxide nanoparticles (NPs) which are thermally stable and have various electrochemical and optochemical applications. Due to their wide applicability, the present work was designed to form the hematite phase of iron oxide (αFe2O3NPs) NPs prepared via a solution process. Their cytological performance was checked with C2C12 cells. The crystalline property of the NPs was examined with X-ray diffraction patterns (XRD) and it was found that the size of the particles formed ranged from 12 to 15 nm. Structural information was also identified via field emission scanning electron microscopy (FESEM) and transmission electron microscopy (TEM), which again confirmed that the size of each NP is about 12–15 nm. Surface topographical analysis was done via atomic force microscopy (AFM), which reveals that the size of the distance between two particles is in the range of 12 ± 3 nm. The C2C12 cells were cultured in a humidified environment with 5% CO2 and were checked via a microscope. The αFe2O3NPs were used for cytotoxic evaluation against C2C12 cells. A MTT (3-(4,5-dimethyl thiazol-2-yl)-2,5-diphenyltetrazolium bromide) assay was utilized to check the viability of cells in a dose-dependent (100 ng mL−1, 500 ng mL−1 or 1000 ng mL−1) manner. The morphology of the cells under the influence of αFe2O3NPs for live and dead cells in a wet environment was confirmed via confocal laser scanning microscopy (CLSM). The apoptosis caused due to the αFe2O3NPs was evaluated in presence of caspases 3/7 with GAPDH genes, which confirmed the upregulation that is responsible in caspase 3/7 genes, with treatment of C2C12 at low (500 ng mL−1) and high (1000 ng mL−1) doses of αFe2O3NPs. Analytical studies were also performed to authenticate the obtained data for αFe2O3NPs using parameters such as precision, accuracy, linearity, limits of detection (LOD) and limit of quantitation (LOQ), quantitative recoveries and relative standard deviation (RSD). The analyses play a significant role in investigating the large effect of αFe2O3NPs on C2C12 cells.
Introduction
Magnetic oxide nanoparticles (NPs) have unique physicochemical properties, and have attracted great interest in recent years. Among the different forms of iron oxide are maghemite (γ-Fe2O3), magnetite (Fe3O4) and goethite (α-FeOOH) etc.1–3 The hematite (α-Fe2O3) form of iron oxide is thermodynamically stable and has n-type semi-conductor properties.4 The low-cost processing and auspicious band-gap (2.1–2.2 eV) of α-Fe2O3 make it an excellent material and it can be utilized in various fields, such as catalysis,5,6 pigments,7 electrocatalysis,8 photocatalysis,9 electrochemical sensors,10 gas sensors,11 solar cells,12 sorbants,13 electrode materials,14 lithium ion battery electrodes,15 and storage materials.16 The low band gap enables greater possibility for the absorption of light in the visible range compared to TiO2NPs.17 Various ways have been adopted to prepare different types of iron oxide NPs, such as sol–gel,18 surfactant assisted,19 hydrothermal,20 thermal oxidation,21 microwave,22 mechanical milling etc.23 Hematite nanostructures can be synthesised with various physicochemical parameters by changing their size, precursor concentration, the pH of the solution, surface properties etc24. Several researchers have drawn attention to this direction, such as Lassoued et al. who described the effect of a change in concentration of the precursor solution on the formation of hematite nanoparticles, checking the size of the nanoparticles, their morphology and optical properties,25 whereas in another report, the sizes of the nanoparticles were varied by heating, when they formed different phases of iron, (γ-Fe2O3) or (α-Fe2O3).26 Hematite nanoparticles (α-Fe2O3) can also be synthesised via controlled precipitation methods with variation in the precursor's precipitation methods using inorganic metal salts or washing the material, and calcination also affected the size of the nanostructures. This is dependent upon the synthetic method adopted and their processes can be optimized to develop high-quality nanoparticles.27 The size distribution also changes with a variation in pH and has the property of forming α-Fe2O3 NPs.28 Preparation at low cost, with good quality, via a facile approach is a challenging task that can be met via a solution process. Considering the physical, optical and chemical applications of hematite (α-Fe2O3) NPs, they have been utilized as biomedical materials in drug delivery, chemotherapy, MRI, antibacterial agents etc. The magnetic nanoparticles can be functionalized with various biological molecules, such as proteins or nucleic acids, via physicochemical conjugations.29,30 The magnetic NPs (α-Fe2O3) have an excellent biocompatibility and thus could be used in many in vitro and in vivo imaging studies.31For various physicochemical applications of hematite (α-Fe2O3) NPs, very limited information is available about using nanostructures as anticancer agents. To control the proliferation rate of cancer cells and to understand their role, researchers have utilized nanostructures against cancer cells. For example, 30 nm size NPs were exploited as an anticancer agent against lung cancer cells (HepG2) in a dose-dependent manner.32 In another report, magnetic NPs work in long-term corresponding imaging, in modalities and transplanted cells which could be used in MRI or CT in preclinical animal models.33 Among these NPs, the core–shell shaped nanostructures of hematite (thickness ∼ 10–20 nm, diameter ∼ 80–100 nm) embedded with plate-like structures exhibit low cytotoxicity levels on human lung fibroblast (MRC5) cell lines for biomedical applications.34 The hematite (α-Fe2O3) nanoparticles were utilized on the Madin-Darby Canine Kidney (MDCK) cell line to find out the degree of internalization into the cells, generating free radical species which influence the cytotoxic effects.35 The α-Fe2O3 nanoparticles were also utilized to check their cytotoxic influence on human breast cancer MCF-7 cells.36 Recent advances demonstrate that magnetic nanoparticles have the ability to work as drug delivery systems, and to deliver the NPs to the cells and specified organs. Rat stem cells were magnetized and the iron oxide NPs were used on the upper hemisphere of a rodent retina.37
The present work demonstrates the utilization of chemically synthesized hematite (α-Fe2O3) for its potential cytological effect on myoblast (C2C12) cancer cells, which has not yet been explored under in vitro conditions. The crystalline character of the NPs was examined by looking at the XRD pattern, whereas the morphology of the NPs was evaluated via FESEM and TEM. The topographical evaluation was completed with AFM. The % cell viability was examined with an MTT assay in a dose-dependent manner and the morphological changes in cells were studied via inverted microscopy. Cell death with a dose-dependent incorporation of hematite (α-Fe2O3) NPs in a wet environment was also checked with CLSM. Apoptosis in cells with NPs and their genetic study were performed with caspases 3 and 7 with GAPDH genes. The acquired data was validated with statistical analytical parameters such as precision, accuracy, linearity, limits of detection (LOD) and limit of quantitation (LOQ), quantitative recoveries and relative standard deviation (RSD).
Materials and methods
Experimental
Characterization
The prepared NPs were analysed in terms of their morphological, chemical and topographical properties. The morphological observations of the prepared nanopowders were made by FE-SEM (Hitachi S-4700, Japan) and TEM (JEOL JEM JSM 2010, Japan). Apart from these characterizations, AFM was also utilized to check the surface topographical behaviour (horizontal, vertical and lateral size of grown NPs). For AFM (Veeco, USA) observations, the sample was prepared on the silicon substrate by dropping an liquid dispersion of NPs and dried at room temperature for about 30 min. The crystallinity, phases and size of the prepared powder was characterized by XRD with CuKα radiation (λ = 1.54178 Å, Rigaku, Japan) in the range of 20–80° with a 6° min−1 scanning speed with 40 kV and 30 mA current. Fourier transform infrared spectroscopy (FTIR, PerkinElmer GX spectrophoto meter) measurements were analysed in the range 4000–400 cm−1.Cell culture
The cancer cells (C2C12) were purchased from the American Type Culture collection (ATCC-CRL 1772; Bethesda, MD) and cultured in growth medium (Dulbecco's Modified Eagle's Medium, DM EM), which contains 10% fetal bovine serum (FBS), 100 IU mL−1 penicillin, and 100 μg mL−1 streptomycin and incubated in a humidified incubator at 37 °C with 5% CO2. The medium was changed every alternate day and the cells were subcultured with trypsin after they had passed 50–70% confluence.Cell viability by MTT assay
The viability of the cells was checked with cell proliferation kit I (MTT (3-(4,5-dimethylthiazol-2-yl)-2,5-diphenyltetrazolium bromide), a tetrazole, provided by ROCHE, Ltd, U.S.A.) according to the manufacturer's instructions. Briefly, the cell line was seeded into 96-well plates at 5 × 10³ cells per well and the plate incubated overnight at 37 °C in a humidified incubator with 5% CO2. The C2C12 cells were incubated with different concentration (100 ng mL−1, 500 ng mL−1 and 1000 ng mL−1) of αFe2O3NPs and returned to the incubator for 24 h, 48 h and 72 h. The cytotoxic assessment or mitochondrial dysfunction was evaluated by the use of MTT (∼10–20 μL added to each well and kept for ∼3 h) salt/assays. The MTT salt reduces to form a purple formazan salt in the mitochondria of living cells. The stored stock MTT solution was added to the control and treated with NPs, and the cell samples were again incubated at 37 °C for 4 h. After the incubation, the samples were removed from the incubator and mixed with solublizing buffer (DMSO, 100 μL per well) solution. A purple color was visible at this stage, which deepened with pipetting. The control and treated samples were again incubated overnight to ensure that the formazan precipitate had dissolved. The measurement of the MTT assay was analyzed with an Elisa Reader (Bio Rad) at 570 nm. The UV-irradiation was provided by a deuterium and xenon lamp. The absorbances of the colored solutions were recorded at 570 nm by a spectrophotometer. The percentage (%) viability was calculated as follows:| % Viability = OD (optical densities) in sample well/OD in control well × 100 |
Confocal scanning laser microscopy (CSLM) measurement
To find the dose-dependent cell deaths in a wet environment with prepared NPs, the cells (C2C12) were cultured and seeded (5 × 10³ cell per well) into a confocal disk. The cells with αFe2O3NPs were incubated (24 h) at 37 °C in a humidified environment with 5% CO2. When the cells passed 50–70% confluence, the medium was removed from the confocal disk and PBS was added, gently but well shaken, and the buffer removed from the confocal disk. The cells were fixed using ethanol (70%, 200 μL) and the solution retained for 10 min for complete fixation. The incubated cells were again washed using PBS, shaken gently, and the medium completely removed from the confocal disk. For the staining, the cells were mounted with propidium iodide (PI) with buffer solution and again incubated at 37 °C for 30 min in an incubator and again washed with buffer. The stained cells were covered with a cover slip.mRNA extraction from C2C12 cells
Total RNA was extracted from the C2C12 cells after various treatments for set periods of time using Trizol (Sigma) according to the manufacturer's protocol. The purity of the total RNA was assessed by the ratio of optical density at 260 nm to that at 280 nm (acceptable values being between 1.6 and 2.1). First, strand cDNA was synthesized from 1 μg of the total RNA using M-MLV Reverse Transcriptase with Anchored Oligo d(T)12-18 Primer. Real-time PCR was performed using a cDNA equivalent of 10 ng of total RNA from each sample with primers specific for caspase 3/7 genes with a housekeeping gene GAPDH. The reaction was carried out in 10 μL samples using SsoFastTM EvaGreen® Supermix (Bio-Rad) according to the manufacturers' instructions. Relative ratios were calculated based on the 2−ΔΔCT method. PCR was monitored using the CFX96TM Real-Time PCR Detection Systems (Bio-Rad).Analytical determination
A concentration of αFe2O3NPs of 1 μg mL−1 was employed against suspended solutions of cancer cells (C2C12), and the quantity determined by the analytical method. The recorded absorption spectra of αFe2O3NPs, C2C12 and αFe2O3NPs were measured at λmax 230 and 440, 290, 350 nm, determined by a UV-visible spectrophotometer.Statistical analysis
The obtained data is expressed as mean ± SD. Statistical analysis was performed by Student T-tests. Results were considered significant when P < 0.05.Result and discussion
X-ray diffraction pattern of αFe2O3 NPs
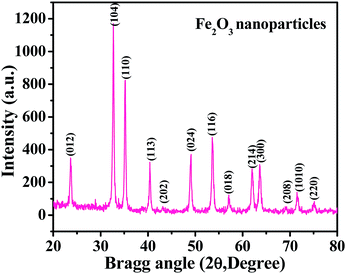
The XRD spectrum shows a picture of the material crystallinity, phase and size of the prepared nanopowder. From a detailed observation of the obtained spectrum, it is evident from Fig. 1 that the prepared material is the hematite phase (αFe2O3) of iron oxide NPs with the exact phases being compared with the available phase identification JCPDS card no. 39-1346. The peak positions, such as 23.70 〈012〉, 32.70 〈104〉, 35.10 〈110〉, 40.40 〈113〉, 43.35 〈202〉, 49.05 〈024〉, 53.60 〈116〉, 57.1 〈018〉, 62.0 〈214〉, 63.70 〈300〉, 69.02 〈208〉, 71.65 〈1010〉 and 75.10 〈220〉, are clearly indexed with the phase of hematite (αFe2O3) iron oxide. The average particle size of the prepared NPs is ∼12 ± 3 nm, as calculated by the Scherrer formula.38 From the spectrum, it is evident that no hydroxide peaks were observed, which again indicates that the transformation of hydroxide to hematite phase was complete.Structural, morphological and topographical descriptions of the prepared αFe2O3 NPs (FE-SEM and TEM results)
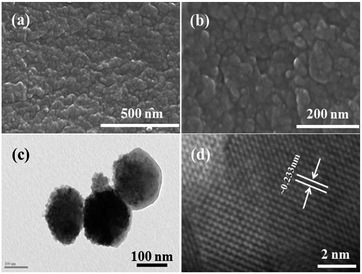
The morphology of the prepared nanopowder was observed with FE-SEM and TEM. Fig. 2(a) and (b) show the low and high magnification images of the prepared αFe2O3NPs. Several tiny NPs can be seen in the images in an agglomerated form (Fig. 2(b)). The high magnification image shows that the average size of each crystallite is about 12–15 nm. To gain more detailed information about the morphology of the prepared NPs, TEM observation was performed at room temperature with an accelerating voltage of 200 kV. The low magnification image (Fig. 2(c)) shows the morphology of the prepared αFe2O3NPs. The image shows that the NPs are very small and fine with an agglomerated form. Several tiny particles are in a clustered form; the clusters are made from very small hematite nanoparticles, which are about ∼12–15 nm in size in spherical dot-like structures. The obtained morphological observations of the NPs are in good agreement with the FESEM and XRD data. The size of each particle is about 12–15 nm with a spherical shape. Fig. 2(d) shows the high magnification TEM image of the prepared NPs, which illustrates that the lattice distance between two fringes is ∼0.233 nm, which corresponds to the pure phase of αFe2O3 hematite NPs. We have also analyzed the dynamic light scattering (DLS) of the prepared NPs and this shows the size of the particulate matter to be about 110.2 nm (data not shown). We assume that several factors were influential, such as refluxing, precipitation time, concentration of salt etc. The size of the NPs increases with interaction with other molecules. Our findings also corroborate the findings of previous literature.39Atomic force microscopy (AFM results)
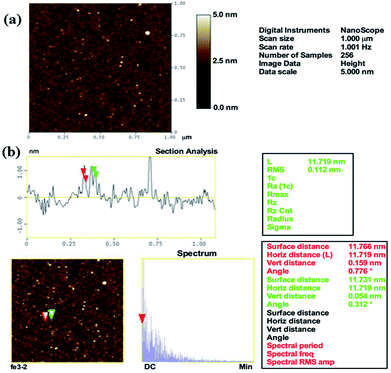
The surface topography of the prepared αFe2O3NPs was observed from the AFM, which defines the size and surface image of the prepared NPs. The obtained image shows that the particles are very small in diameter (∼12–15 nm), which provides clear and consistent data analogous to the XRD, FE-SEM and TEM results. The AFM image of αFe2O3NPs (Fig. 3(a)) shows that several spherical shaped nanostructures can be seen on the surface of the silicon sheet which are in the size range of ∼12 nm.From the analysis in this section, it can easily be confirmed that the particles are ∼12 nm in size (Fig. 3(b)), which is in good agreement with the TEM observation (Fig. 2(c)). The surface and horizontal distance also confirm that the average size of each NP is in the range of about ∼12 nm.
FTIR spectroscopy results
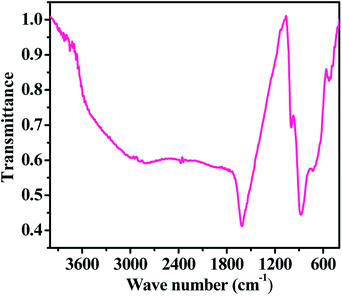
Information about the chemical functional bonding was obtained by Fourier transform infrared spectroscopic (FTIR) measurements using KBr (potassium bromide) pellets in the range of 4000–400 cm−1. In our experiment, a very small amount of hematite NPs powder was mixed with KBr, which must be strictly controlled to produce good spectra. Consequently, the obtained mixture was compressed in the form of a pellet under high-pressure (∼4 tons). The pellet was used for the FT-IR measurement. The FTIR spectrum shows the fingerprints of iron nitrate (Fe(NO3)3·9H2O), sodium hydroxide (NaOH) and n-propylamine, which were used for the formation of the hematite NPs. In the obtained spectrum (Fig. 4), we found that the broad peak between 3450 and 3250 cm−1 corresponding to the primary aliphatic amine (n-propyl amine) shows broad band intensity in a liquid medium, whereas the asymmetric stretching of alcohol moisture molecules was centred at 1611 cm−1. The shifted stretching frequency of the primary amine at 998 cm−1 (–NH2) contributed hydrogen strength, and alters in shape and position due to presence of hydrogen bonding in an alcoholic medium. A sharp peak centred at 876 cm−1 is associated with the stretching mode of the nitrate (NO3−1) group from iron nitrate.25–28 A curved and flattened peak around 541 cm−1 in the FTIR spectrum represents the formation of Fe–O and shows the metal oxide peak. The obtained functional information from FTIR justifies that the prepared nanostructures have a good chemical property and this is consistent with the XRD pattern data. We have not found any other residues because they were washed out during the washing of the prepared product with alcohol and acetone.Anticipated chemical reaction mechanism for αFe2O3NPs
On the basis of the chemical reaction used and observations such as the XRD, FE-SEM, TEM, AFM and FTIR findings, a chemical reaction mechanism is proposed for the formation of αFe2O3NPs. In this experiment, when the iron(III) nitrate nonahydrate (Fe(NO3)3·9H2O) was dissolved in MeOH under continuous stirring and n-propylamine and NaOH were added to this suspension, it forms a clear solution without a precipitate at a pH of 12.06. At the desired refluxing temperature of ∼90 °C, a precipitate started to form in the refluxing pot. And it was completed in 60 min. As for the chemical reactions, it is assumed that the nitrate (–NO3)2 group from iron(III) nitrate nonahydrate (Fe(NO3)3·9H2O) reacted with sodium (Na+) ions due to the strong electro-negativity factor. The amine (–NH2) chain from n-propylamine reacted with the iron (Fe3+) ions and formed a long chain with the amine complex (FeN–(CH2)2–CH3), which may be due to the decomposition of the hydrogen bond in the solution. As the reaction temperature rises, the hydroxyl (OH−) ions from sodium react with the iron complex (FeN–(CH2)2–CH3), and the (Fe3+) ions react with the hydroxyl (ions), forming iron hydroxide (Fe(OH)3). This hydroxide (Fe(OH)3) molecule was further changed into iron oxide (Fe2O3) due to refluxing and drying with MeOH from the compound. The mechanism was also justified with the available FTIR data (Fig. 4). As found in previous literature, at a higher refluxing temperature hydroxide molecules change into pure oxide material upon heating and drying. The product/residue formed from the reaction was leached out during washing, and centrifugation of the product.40,41Morphological evaluation (C2C12) and their interaction effect with αFe2O3NPs
The C2C12 cells were cultured in a specified 75 mm2 flask and grown at their confluence (50–70%). When the cells reached their optimum confluence (50–70%), they were again harvested with trypsin and treated with the prepared αFe2O3NPs at different concentrations (100 ng mL−1, 500 ng mL−1 and 1000 ng mL−1). A control was also managed to check the difference between treated and untreated samples. The samples were incubated with 5% CO2 at 37 °C for different time (24, 48, and 72 h) periods (Fig. 5). Initially, no changes were observed in the culture medium but after 24 h, cells were seen to be mono nucleate and started to proliferate (48 h) and as the incubation time reached 72 h, the cells were damaged (Fig. 5). It is very clear from the images that as the concentration (100 ng mL−1, 500 ng mL−1 and 1000 ng mL−1) of NPs increases, the cells' viability was damaged by interaction with the prepared nanomaterial.42,43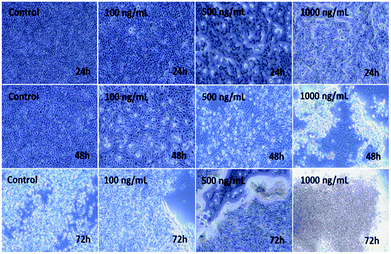 | ||
| Fig. 5 Microscopic images of the effect on C2C12 of iron oxide αFe2O3 (hematite phase) nanoparticles at different concentrations and incubation times. | ||
MTT assay or cytotoxicity calculations
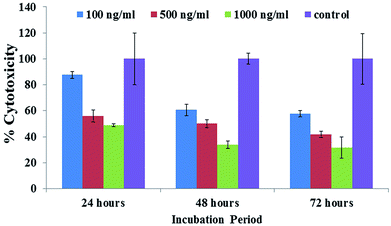
The obtained MTT results showed that the % viable cells varied in a dose/concentration-dependent manner. The cell viabilities at concentrations of 100 ng mL−1, 500 ng mL−1 and 1000 ng mL−1 were recorded as 87%, 55% and 48%, respectively, by MTT assay at 24 h. With an increase in incubation, a sequential change in cell viability was observed at 100 ng mL−1, 500 ng mL−1 and 1000 ng mL−1 concentrations and was recorded as 60%, 50% and 3%, respectively, by MTT assay at 48 h. With a 72 h incubation period, a sudden drop in viability was observed for 100 ng mL−1, 500 ng mL−1 and 1000 ng mL−1 concentrations to 57%, 41% and 31%, respectively, by MTT assay (Fig. 6). Similar results were also found with C2C12 cells with various concentrations using platinum quantum dots, gold nanoparticles and also metal oxide/zinc oxide nanoparticles.40,42,43 The obtained result signifies that the prepared hematite NPs reduce the viability of cancer cells at different nanogram (100 ng mL−1, 500 ng mL−1 and 1000 ng mL−1) concentration levels for different incubation (24, 48 and 72 h) periods.Caspase-3 and 7 activity effect with αFe2O3 NPs
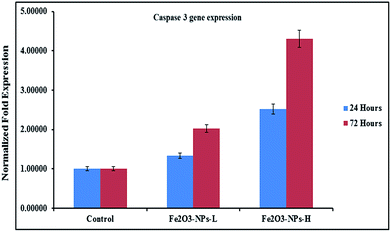
The levels of mRNA in the presence of caspase 3 and 7 genes against C2C12 cells with the incorporation of αFe2O3 NPs (in the presence of GAPDH) were analyzed with RT-PCR. The cells were treated with NPs at defined (500 ng mL−1 & 1000 ng mL−1) concentrations for two different incubation (24 & 72 h) periods. After analysis, the obtained data from PCR show that the levels of mRNA for the markers (caspase 3 and 7) were considerably changed in the cancer cells, which is due to exposure to αFe2O3NPs (Fig. 7 and 8, p < 0.05 for each). According to the obtained data, the genes' expressions for caspase 3 with αFe2O3 NPs at 100 ng mL−1 at 24 h incubation period were 1.32 and 2.51, respectively. The amounts of change at a high (1000 ng mL−1) concentration of αFe2O3NPs with 72 h incubation period were 2.02 and 4.30 fold, respectively, defining a gradual change, due to the upregulation of the genes (Fig. 7). The quantitative real-time PCR results indicated that αFe2O3NPs show upregulation in the mRNA level of the cell cycle checkpoint of caspase 3 and 7.44 The caspase activities correspond to the portion of apoptotic cells present in the naturally growing population due to natural aging in untreated cells.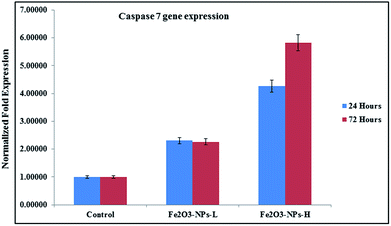 | ||
| Fig. 8 mRNA expression of C2C12 cells for caspase 7 in the presence of GAPDH genes, with exposure to NPs at low (500 ng mL−1) and high (1000 ng mL−1) concentrations. | ||
The role of alteration in gene expression was associated with an untreated sample as a control or a signature control (GAPDH) for the knockdown data. Generally the prepared metal oxide nanostructures (NPs) behave with a toxic nature with respect to the growth of cancer cells, as is very clear from the obtained data (Fig. 7 and 8).
As the concentration of NPs increases, the cell apoptosis increases and this resulted in upregulation in mRNA expression. Similar observations were also obtained in the case of caspase 7, when it was introduced after 24 and 72 h incubations in the presence of NPs. In the case of caspase 7 gene expression, at low concentration (100 ng mL−1) of NPs incubated for 24 h, it expressed 2.30 and 4.27 fold change respectively, whereas at a higher concentration (1000 ng mL−1) of αFe2O3 NPs and higher incubation period (72 h), apoptosis changes were 2.26 to 5.83 fold (Fig. 8).44
Confocal laser scanning microscopy (CLSM) study effect with αFe2O3 NPs
The dead and live cells and their morphology in a wet environment were also studied via CLSM in a dose-dependent manner with 5% CO2 for a 24 h incubation period with the staining solution propidium iodide (PI). Fig. 9 shows the effect of different concentrations of αFe2O3NPs from low (100 ng mL−1 conc) to high (500 ng mL−1 & 1000 ng mL−1). From the images it is clear that at low concentration the toxicity of the nanostructures does not have much effect on the cells, but as the dose of NPs increases (500 ng mL−1 & 1000 ng mL−1), more than ∼85–90% of the cells were completely damaged. Our results also corroborated the obtained MTT data (Fig. 6), and define that the toxicity to the cells is dependent on the concentration of utilized NPs and the ageing (incubation period) of the cells. This phenomenon is under investigation and the relation between NPs and cells lines needs to be confirmed.40,42,43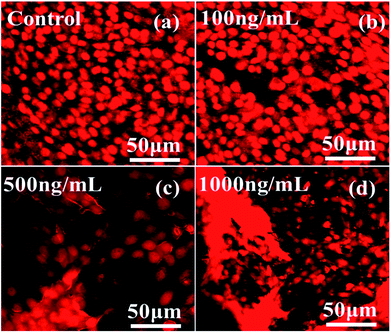 | ||
| Fig. 9 CLSM images of C2C12 cells at different concentrations of αFe2O3 hematite NPs (100 ng mL−1, 500 ng mL−1 and 1000 ng mL−1) with a 24 h incubation period. | ||
Analytical determinations of αFe2O3 NPs with C2C12 cells
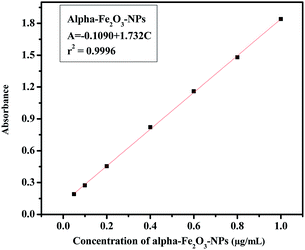
The analytical technique, regulatory markers, utilized a quantity of αFe2O3 NPs. This study will be helpful to differentiate the NPs before and after mingling with the C2C12 cells (αFe2O3NPs C2C12) component. In the present case the quantity of utilized sample and their molecular species absorb radiation with respect to a suitable wavelength (nm) at maximum absorption (λmax). The quality of the analytes (the essential ability of the nanomaterials (αFe2O3NPs) to control caspase 3 and 7 genes in C2C12 cells) was analyzed via optimization and validation methods. The statistical analytical technique has the ability to provide information about the relation between both chemical and biological quantized species which distinguishes the resulting data. In our results, which are illustrated as Fig. 10(a–c), the absorbance of αFe2O3NPs was displayed at two positions at λmax 220 and 430 nm, whereas the C2C12 and αFe2O3NPs–C2C12 show absorbance at λmax 290 and 360 nm wavelength, respectively. On the basis of the obtained data a calibration graph was constructed for the αFe2O3NPs by plotting absorbance against concentration (conc., 0.5–2.0 μg mL−1) which gives a linear graph (Fig. 11). The linear regressive equation (A = 0.109 + 1.732C) of the calibration data obtained (n = 5) with the help of absorbance versus concentration, gives the value of the intercept (a), slope (b), and correlation coefficient.45,46 The high molar absorptivity (αFe2O3NPs = 9.20 × 10³L mol−1 cm−1) of the resulting sample solution indicates the sensitivity, detection limit (LOD) and quantitation limit (LOQ), relative standard deviation (RSD), showing the system suitability of the proposed method at the lowest concentration level.47,48 These empirical formulae provided more reliable values to ensure that they are fit for the proposed method and confirmed that this method is accurate, precise, reproducible, and gives adequate results. The recovery and relative standard deviation (RSD) experiments are summarized in Tables S1 and S2.† It is evident from both tables that the recoveries (99.54–100.94%) were almost accurate and were satisfactory.47,48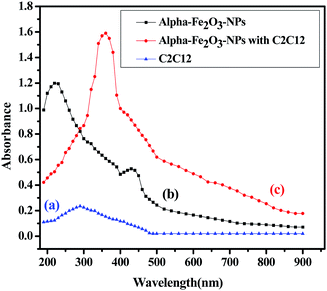 | ||
| Fig. 10 The absorption spectra of αFe2O3 NPs (a), C2C12 cells (b), spectra of αFe2O3 NPs and C2C12 cells (c). | ||
Possible proposed mechanism
On the basis of obtained data the exact mechanism of cytotoxicity with αFe2O3 NPs and damage to cells and their organelles is still under debate, but from our observations, such as morphology, cell viability, PCR detection with caspase 3 and 7 genes and CLSM study, we have projected and explained the cause of cell damage with αFe2O3NPs in a possible pictorial mechanism (Fig. 12), relating to cytotoxicity happening with αFe2O3NPs. The toxicity to the cells depends on various types of parameters, such as the size of the nanostructures used, the shape of the material, chemical content, and dose/concentration of NPs, cell concentration etc. It also affects the endocytic uptake of cells.40,42,43,49 In our case it is assumed that the αFe2O3 NPs are very small (12–15 nm) and spherical in shape so they can easily enter into the cell membrane because the size of each cell is usually around ∼20 μm, which means enough space for the nanostructures to enter into the cells. The αFe2O3NPs first attack the surface of the cancerous cells and then the cell membranes which exhibit small pores/passages in their organization, facilitates entry of small αFe2O3 NPs into cells and damages the upper layer of the cell walls (as in the schematic in Fig. 12). As with our obtained result at 100 ng mL−1 concentration of NPs, the density of damaged cells is lower because of the concentration as compared to higher applied doses such as 500 or 1000 ng mL−1 concentration of αFe2O3NPs. The very small size of the nanoparticles relative to the cell size as well as the high density of αFe2O3NPs in liquids can strongly favor the rapid formation of adduct.40,42,43,49 It is assumed that adducts formed of αFe2O3NPs have the ability to destroy the cell organelles, which ultimately succumb to cell death.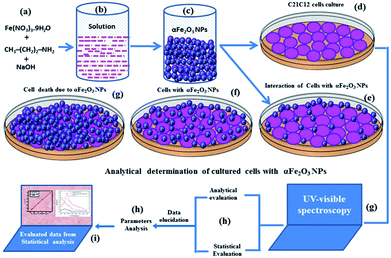 | ||
| Fig. 12 Possible proposed schematic mechanism for the interaction of αFe2O3NP against C2C12 and their cytological death. | ||
In case of analytical performance, the statistical interpretations and their validation were studied under International Conference of Harmonization (ICH) guidelines. This (ICH) guideline recommends validation characteristics of analytical methods such as: linearity, range, accuracy, precision, repeatability, specificity, LOD and LOQ.45,46 The statistical analytical parameters playing an important role in promoting and encouraging the capability of a nanomaterial include the mean, standard deviation, variance and standard analytical error, RSD, coefficient of correlation, regression line, variance, errors in the slope and the intercept, and confidence limit for the slope and the intercept. For the statistical analysis performance an appropriate quantity of αFe2O3NPs solution was dedicated to control toxicity in cancerous cells. Therefore, prerequisites, assumptions and formulae were employed at a low concentration level to design an experimental plan for strictly defined standard quantitative and qualitative results to specify reaction conditions. The UV-visible spectrophotometer technique provides absorption spectra in regard to absorbance, and more reliable values of the resulting data confirm the relationship and interaction between αFe2O3NPs and C2C12 cancerous cells. The aptitude of the analytical procedure to achieve test results is directly proportional to the concentration of αFe2O3 NPs in the sample solutions. Beer's law was followed in the concentration range from 0.05 to 1.0 μg mL−1 and, therefore, this solution range was fixed for αFe2O3 NPs (Fig. 10). The linearity represents the ability to use regression equation analysis (A = −0.109 + 1.732C) of the calibration data obtained (n = 5) with the help of αFe2O3NPs absorbance versus concentration, which gives the value of the intercept (a), slope (b), apparent molar absorptivity (αFe2O3NPs = 9.20 × 10³ L mol−1 cm−1), variance of the slope of the regression line (So2 = 2.04 × 10⁻⁴), correlation coefficient (r2 = 0.9996), (±tSa = 0.013 and ±tSb = 0.024), limits of detection (LOD = 402.5 μg mL−1) and limit of quantitation (LOQ = 1219.7 μg mL−1) at a 95% confidence level (Table S1†). Accuracy and precision were achieved with replicate sets of αFe2O3NPs (analyte) with respect to three concentrations, which represented the entire range of the standard linear curve (Fig. 11). To evaluate intra-day and inter-day precision, analyses of αFe2O3NPs at three concentration levels (0.221, 0.732 and 1.125 μg mL−1) were carried out within the same day and on five consecutive days. The intra-day and inter-day RSD values for αFe2O3NPs ranged from 0.918 to 1.951% and from 1.483 to 1.814%, respectively, and the obtained results are summarized in Table S2.† The % recoveries were quantitative for αFe2O3NPs (99.31–100.94%), indicating good accuracy of the proposed method and satisfactory recovery with values of RSD (%) analyzed by a spectrophotometric method. All resulting data conform strictly to statistical analysis and acceptable accuracy and precision under the quantified level to sustain bioavailability with caspase 3 and 7 in C2C12 cells. The reliable results are satisfactory and fully validated according to acceptance criteria from an assay performance of statistical analysis, giving an appropriate quantity of analytes to reduce or control the multiplication of C2C12 cells. The toxicity to biological materials (cancerous cells) was good, supporting the selection of αFe2O3NPs, and the species integrity maintained a quantity which allowed the endorsement of standardized nanomaterials for use as a proper essential ingredient at a low limit of quantified levels. Hence, the statistical analytical techniques recommended in the specification validated the resulting data and ensured it achieved a 95% confidence level.45–48
Conclusion
In the present work, we have successfully synthesized spherical shaped α-Fe2O3 hematite iron oxide NPs via a solution process at low cost. The particles were characterized with the available sophisticated instruments in terms of their crystalline character and morphology, such as X-ray diffraction pattern, FESEM and TEM, respectively. The chemical functional footprints were analysed via FTIR spectroscopy. The prepared NPs (∼12–15 nm) were utilized to control the proliferation of cancer cells C2C12 cells in a dose-dependent manner. The viability of the cells was examined with MTT assay which revealed that enhanced cell death was caused in a dose-dependent manner, which plays an important role in controlling the density of cells. Included in this study, the density of dead cells in a wet environment was also approved from the CLSM study. The cell apoptosis of C2C12 in the presence of caspases 3 and 7 with GAPDH genes with controlled doses of α-Fe2O3 hematite iron oxide NPs was checked with RT-PCR study. To validate the obtained study, an analytical technique was employed in terms of the determination of nanomaterials, selected for reduction in cell viability and controlling the growth of cancerous cells. The applicability of the NPs is the right choice for the purpose of cancerous cell inhibition. The statistical parameters validated the performance, where the suitability, selectivity, sensitivity, rapidity accuracy, and precision were the main advantages of the proposed method. The statistical analytical parameters such as the mean (X), standard deviation (SD), relative standard deviation (RSD) and confidence limit (C.L.) at 95% were calculated in order to verify the validity of the experimental data, to check the anticancerous effects. The small NPs are highly effective against the proliferation rate of cancer cells and the analytical determination techniques define the quality of the results. The obtained statistical results show higher accuracy with reproducibility, as indicated by the qualitative and quantitative results from UV-visible spectroscopy. Under the ICH guidelines, the analytical parameters were authenticated and studied for the validation and standardization of analytical procedures for the approval and authentication of the result.Conflicts of interest
The authors declare that there are no conflicts of interest.Acknowledgements
This study was financially supported by the King Saud University, Vice Deanship of Research Chairs.References
- A. Akbarzadeh, M. Samiei and S. Davaran, Nanoscale Res. Lett., 2012, 7, 144 CrossRef PubMed.
- M. Marcus, M. Karni, K. Baranes, I. Levy, N. Alon, S. Marge and O. Shefi, J. Nanobiotechnol., 2016, 14, 37 CrossRef PubMed.
- M. Mahmoudi, F. Q. Pluck, M. P. Monopoli, S. Sheibani, H. Vali, K. A. Dawson and I. Lynch, ACS Chem. Neurosci., 2013, 4(3), 475–485 CrossRef PubMed.
- K. K. Atyam, A. Ghosh, K. Mukherjee and S. B. Majumder, Hematite iron oxide nano-particles: facile synthesis and their chemi-resistive response towards hydrogen, Mater. Res. Express, 2015, 2, 055901 CrossRef.
- K. Kim, I. H. Kim, K. Y. Yoon, J. Lee and J. H. Jang, α-Fe2O3 on patterned fluorine doped tin oxide for efficient Photo electrochemical water splitting, J. Mater. Chem. A, 2015, 3, 7706–7709 RSC.
- L. Cui, D. Zhao, Y. Yang, Y. Wang and X. Zhang, Synthesis of highly efficient α-Fe2O3 catalysts for CO oxidation derived from MIL-100 (Fe), J. Solid State Chem., 2017, 247, 168–172 CrossRef.
- H. Katsuki and S. Komarneni, J. Am. Ceram. Soc., 2003, 86(1), 183–185 CrossRef.
- Y. Fu, J. Wang, H. Y. Yu, X. Li, H. Wang, J. H. Tian and R. Yang, Int. J. Hydrogen Energy, 2017, 42(32), 20711–20719 CrossRef.
- G. Haiying, J. Tifeng, Z. Qingrui, L. Adan and G. Faming, Rare Met. Mater. Eng., 2015, 44(11), 2688–2691 CrossRef.
- B. P. Singh, A. Kumar, A. P. Duarte, S. J. Rojas, M. C. Medina, H. I. A. Martinez, C. A. V. Olivencia and M. S. Tomar, Mater. Res. Express, 2015, 3, 106105 CrossRef.
- A. Mirzaei, K. Janghorban, B. Hashemi, A. Bonavita, M. Bonyani, S. G. Leonardi and G. Neri, Nanomaterials, 2015, 5, 737–749 CrossRef PubMed.
- H. Niu, S. Zhang, Q. Ma, S. Qin, L. Wan, J. Xu and S. Miao, RSC Adv., 2013, 3, 17228–17235 RSC.
- E. M. Verdugo, Y. Xie, J. Baltrusaitis and D. M. Cwiertny, RSC Adv., 2016, 6, 99997–100007 RSC.
- Z. Ma, X. Huang, S. Dou, J. Wu and S. Wang, J. Phys. Chem. C, 2014, 118(31), 17231–17239 CrossRef.
- Y. M. Lin, P. R. Abel, A. Heller and C. B. Mullins, J. Phys. Chem. Lett., 2011, 2(22), 2885–2891 CrossRef.
- N. Yan, X. Zhou, Y. Li, F. Wang, H. Zhong, H. Wang and Q. Chen, Sci. Rep., 2013, 3, 3392 CrossRef PubMed.
- J. R. Griffiths and J. D. Glickson, Adv. Drug Delivery Rev., 2000, 41(1), 75–89 CrossRef PubMed.
- M. M. B. Abbad, M. S. Takriff, A. Benamor and A. W. Mohammad, J. Sol-Gel Sci. Technol., 2017, 81(3), 880–893 CrossRef.
- L. Liu, H. Z. Kou, W. Mo, H. Liu and Y. Wang, J. Phys. Chem. B, 2006, 110(31), 15218–15223 CrossRef PubMed.
- M. Tadic, M. Panjan, V. Damnjanovic and I. Milosevic, Appl. Surf. Sci., 2014, 320, 183–187 CrossRef.
- T. Tsuzuki, F. Schäffel, M. Muroi and P. G. McCormick, Powder Technol., 2011, 210(3), 198–202 CrossRef.
- A. K. Mondal, S. Chen, D. Su, K. Kretschmer, H. Liu and G. Wang, J. Alloys Compd., 2015, 648, 732–739 CrossRef.
- S. G. Hosseini and E. Ayoman, J. Therm. Anal. Calorim., 2017, 128(2), 915–924 CrossRef.
- Z. Pu, M. Cao, J. Yang, K. Huang and C. Hu, Nanotechnology, 2006, 17(3), 799–804 CrossRef.
- A. Lassoued, B. Dkhil, A. Gadri and S. Ammara, Results Phys., 2017, 7, 3007–3015 CrossRef.
- F. S. Yen, W. C. Chen, J. M. Yang and C. T. Hong, Nano Lett., 2002, 2(3), 245–252 CrossRef.
- J. A. Morales-Morales, Ciencia en Desarrollo, 2017, 8(1), 99–107 CrossRef.
- K. Shimizu, S. V. Sokolov and R. G. Compton, Colloid Interface Sci. Commun., 2016, 13, 19–22 CrossRef.
- Q. A. Pankhurst, J. Connolly, S. K. Jones and J. Dobson, J. Phys. D: Appl. Phys., 2003, 36, R167–R181 CrossRef.
- P. Polak and O. Shefi, Nanomedicine, 2015, 11, 1467–1479 CrossRef PubMed.
- A. Ali, H. Zafar, M. Zia, I. Haq, A. R. Phull, J. S. Ali and A. Hussain, Nanotechnol., Sci. Appl., 2016, 9, 49–67 CrossRef PubMed.
- K. Rajendran, V. Karunagaran, B. Mahanty and S. Sen, Int. J. Biol. Macromol., 2015, 74, 376–381 CrossRef PubMed.
- C. A. Pacak, P. E. Hammer, A. A. MacKay, R. P. Dowd, K. R. Wang, A. Masuzawa, B. Sill, J. D. McCully and D. B. Cowan, PLoS One, 2014, 9(9), e108695 CrossRef PubMed.
- M. Tadic, L. Kopanja, M. Panjan, S. Kralj, J. N. Runice and Z. Stojanovic, Appl. Surf. Sci., 2017, 403, 628–634 CrossRef.
- D. Cardillo, M. Tehei, M. S. Hossain, M. M. Islam, K. Bogusz, D. Shi, D. Mitchell, M. Lerch, A. Rosenfeld, S. Corde and K. Konstantinov, ACS Appl. Mater. Interfaces, 2016, 8(9), 5867–5876 CrossRef PubMed.
- S. Kanagesan, M. Hashim, S. Tamilselvan, N. B. Alitheen, I. Ismail, A. Hajalilou and K. Ahsanul, Adv. Mater. Sci. Eng., 2013, 201, 710432 Search PubMed.
- A. Yanai, U. O. Hfeli, A. L. Metcalfe, P. Soema, L. Addo, C. Y. G. Evans, K. Po, X. Shan, O. L. Moritz and K. G. Evans, Cell Transplant., 2012, 21, 1137–1148 Search PubMed.
- B. D. Cullity, Elements of X-Ray Diffraction, Addison-Wesley, Reading MA, 1978, p. 102 Search PubMed.
- W. Cui, J. Li, Y. Zhang, H. Rong, W. Lu and L. Jiang, Nanomedicine: Nanotechnology, Biology and Medicine, 2012, 8(1), 46–53 CrossRef PubMed.
- R. Wahab, F. Khan, Y. B. Yang, I. H. Hwang, H. S. Shin, J. Ahmad, S. Dwivedi, S. T. Khan, M. A. Siddiqui, Q. Saquib, J. Musarrat, A. A. Al-Khedhairy, Y. K. Mishra and B. A. Ali, RSC Adv., 2016, 6, 26111–26120 RSC.
- R. Wahab, I. H. Hwang, Y. S. Kim, J. Musarrat, M. A. Siddiqui, H. K. Seo, S. K. Tripathy and H. S. Shin, Chem. Eng. J., 2011, 175, 450–457 CrossRef.
- R. Wahab, Y. B. Yang, A. Umar, S. Singh, I. H. Hwang, H. S. Shin and Y. S. Kim, J. Biomed. Nanotechnol., 2012, 8(3), 424–431 CrossRef PubMed.
- R. Wahab, S. Dwivedi, F. Khan, Y. K. Mishra, I. H. Hwang, H. S. Shin, J. Musarrat and A. A. Al-Khedhairy, Colloids Surf., B, 2014, 123, 664–672 CrossRef PubMed.
- M. W. Pfaffl, Nucleic Acids Res., 2001, 29(9), e45 CrossRef PubMed.
- International Conference on Harmonisation, Harmonized Tripartity Guideline, Validation of Analytical Procedures. Text and Methodology, Q2 (R1), 2005, November, https://www.ich.Org Search PubMed.
- P. Yanez-Sedeno, J. Riu, M. J. Pingarron and F. X. Rius, Trends Anal. Chem., 2010, 29(9), 939 CrossRef.
- L. Chekli, B. Bayatsarmadi, R. Sekine, B. Sarkar, A. M. Shen, K. G. Scheckel, W. Skinner, R. Naidu, H. K. Shon, E. Lombi and E. Donner, Anal. Chim. Acta, 2016, 903, 13–35 CrossRef PubMed.
- R. Wahab, F. Khan, Lutfullah, R. B. Singh, N. K. Kaushik, J. Ahmad, M. A. Siddiqui, Q. Saquib, B. A. Ali, S. T. Khan, J. Musarrat and A. A. Al-Khedhairy, Physica E Low Dimens. Syst. Nanostruct., 2015, 69, 101–108 CrossRef.
- S. Ghosh, K. Das, K. Chakrabartia and S. K. De, Dalton Trans., 2013, 42, 3434–3446 RSC.
Footnote |
| † Electronic supplementary information (ESI) available. See DOI: 10.1039/c8ra02613k |
| This journal is © The Royal Society of Chemistry 2018 |

