 Open Access Article
Lignans and isoflavonoids from the stems of Pisonia umbellifera†
Zhiguo Liua,
Xilong Zhengb,
Yanan Wangc,
Mengyue Tanga,
Shilin Chena,
Fangbo Zhanga,
Li Li *c,
Cun Zhang*a and
Yi Sun
 *a
*a
aInstitute of Chinese Materia Medica, China Academy of Chinese Medical Sciences, Beijing 100700, PR China. E-mail: ysun@icmm.ac.cn; czhang@icmm.ac.cn
bHainan Branch Institute of Medical Plant Development, Chinese Academy of Medical Sciences, Wanning 571100, PR China
cInstitute of Materia Medica, Chinese Academy of Medical Sciences & Peking Union Medical College, Beijing 100050, PR China. E-mail: annaleelin@imm.ac.cn
First published on 3rd May 2018
Abstract
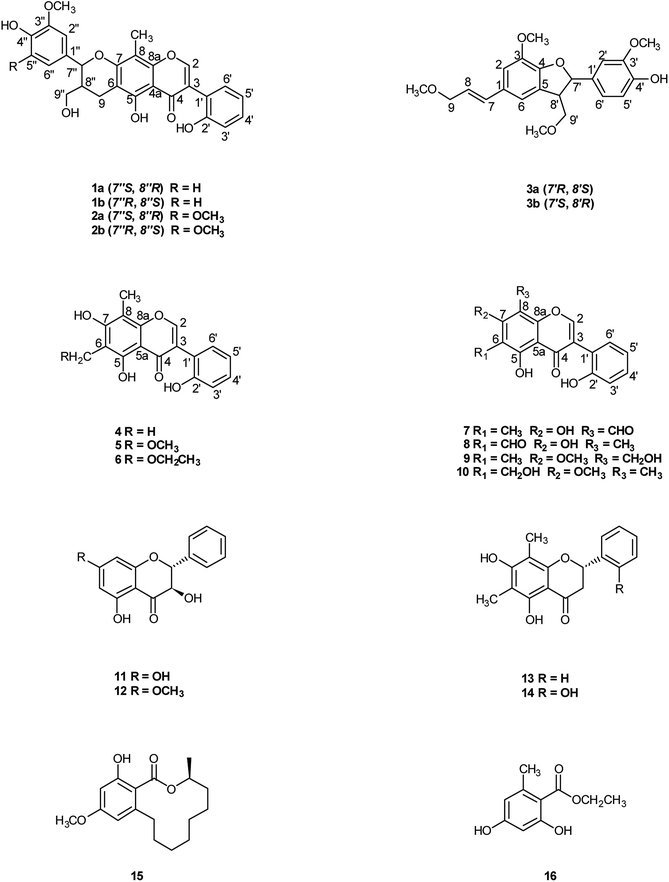
Twelve new compounds including four isoflavonolignans (1a/1b and 2a/2b), two neolignans (3a/3b), and six isoflavonoids (5–10), together with seven known compounds (4 and 11–16) were isolated from the stems of Pisonia umbellifera. The structures were elucidated on the basis of comprehensive spectroscopic analyses and ECD calculation methods. Compounds 1–3 were present as enantiomers that were successfully separated by chiral HPLC. Compounds 1a/1b and 2a/2b are the first examples of isoflavonolignans with a pyranoid ring linking up the isoflavonoid and the monolignol from nature. A putative biosynthetic pathway for the isoflavonolignans was deduced. The anti-inflammatory and cytotoxic activities for all compounds were evaluated.
Introduction
Pisonia umbellifera (J. R. Forst. & G. Forst.) Seem. (Nyctaginaceae), a perennial tree growing in low altitude thickets, is widely distributed throughout Australia, Java, Malaysia, Hawaii, Taiwan and the Hainan province of China. The leaves of P. umbellifera are used as a folk medicine to treat ciguatera poisoning and to prevent phytophage nematodes. Previous phytochemical investigations on this plant have resulted in the isolation of triterpenoids, alkaloids, phenolic acids and isoflavonoids, of which some compounds exhibited antitubercular activity against Mycobacterium tuberculosis.1,2Isoflavonolignans are a type of lignoids, which incorporate a C6-aromatic-C3-side chain unit into an isoflavonone nucleus. Isoflavonolignans are derived from two phenylpropanoid units as they are biogenetically related to lignans and neolignans. So far, only a few isoflavonolignans, termed as benzodioxane lignoids have been isolated from Fabaceae family, which structures contain the catechol moieties in flavonoids.3–8
P. umbellifera is a common herb medicine for Li folk in China. In our investigation searching for the novel bioactive constituents from natural resource,9,10 we chose the stems of P. umbellifera for more detailed study. Twelve new compounds, including four isoflavonolignans (1a/1b and 2a/2b), two neolignans (3a/3b), and six isoflavonoids (5–10), together with seven known compounds (4 and 11–16) were isolated from its stems (Fig. 1). The absolute configurations of the new isoflavonolignans (1a/1b and 2a/2b) and neolignans (3a/3b) were elucidated by comparing their calculated and experimental electronic circular dichroism (ECD) spectra. A putative biosynthetic pathway for the isoflavonolignans was deduced. All the compounds were tested to evaluate their inhibitory effects on NO production in LPS-induced RAW 264.7 macrophages and the cytotoxic activities. Herein, we report the isolation, structure identification, and biological effects of compounds 1–16.
Results and discussion
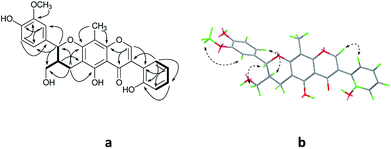
Compound 1 was obtained as colorless oil. The molecular formula was determined to be C27H24O8 by HRESIMS at m/z 477.1545 [M + H]+ (calcd for C27H25O8 477.1544). The 1H NMR spectrum (Table 1) of 1 revealed the presence of one enolic hydroxyl group at δH 12.54 (5-OH) and one diagnostic proton of isoflavone at δH 8.09 (1H, s, H-2). The aromatic region of spectrum displayed the signals of 1,2-disubstituted moieties which were assigned to H-3′, H-4′, H-5′ and H-6′, and was consistent with the substitution pattern in ring B of 6,8-dimethylisogenistein.2 The 1,3,4-trisubstituted moieties of benzene ring were also observed with the aromatic protons at δH 6.95 (1H, d, J = 7.8 Hz, H-5′′), 6.92 (1H, d, J = 1.8 Hz, H-2′′) and 6.91 (1H, dd, J = 7.8, 1.8 Hz, H-6′′). In addition, the aliphatic region of spectrum exhibited an AMXY coupling system with the signals at δH 5.02 (1H, d, J = 9.0 Hz, H-7′′), 3.65 (1H, dd, J = 10.8, 4.8 Hz, H-9′′), 3.55 (1H, dd, J = 10.8, 4.8 Hz, H-9′′) and 2.25 (1H, m, H-8′′). Detailed analyses of the 1H and 13C NMR spectra indicated that 1 possessed the isoflavonolignan skeleton bearing a phenylpropanoid unit. The linkage of the two parts through a pyranoid ring was confirmed by the 2D NMR spectra. Based on the HMBC correlations (Fig. 2a) from CH2-9 to C-7′′ (δC 81.0) and C-9′′ (δC 63.4), and from H-7′′ to C-9 (δC 21.8) and C-9′′ (δC 63.4), and the key 1H–1H COSY correlations from H-8′′ to H-7′′, CH2-9′′ and CH2-9, respectively. The coupling constant (J = 9.0 Hz) between H-7′′ and H-8′′ in 1H NMR spectrum and the NOESY correlations (Fig. 2b) of H-8′′/H-6′′ and H-7′′/CH2-9′′ suggested a trans configuration of the chiral centers on the pyranoid ring. The absolute configuration of 1 was determined by comparing its experiment and quantum chemical calculations of the electronic circular dichroism spectra. Notably, the specific rotation of 1 displayed value of zero (c 0.1, MeOH). Thus, chiral-phase HPLC analysis and resolution of 1a and 1b were carried out on a Daicel Chiralpak AS-H chiral column using n-hexane/isopropanol (7![[thin space (1/6-em)]](https://www.rsc.org/images/entities/char_2009.gif) :
:![[thin space (1/6-em)]](https://www.rsc.org/images/entities/char_2009.gif) 3) as mobile phase (Fig. 3a). The absolute configurations of 1a and 1b were determined by ECD calculations. The experimental ECD curves of 1a and 1b were similar to the computed curves of 1a (7′′S and 8′′R) and 1b (7′′R and 8′′S), respectively (Fig. 3b). Therefore, the structures of 1a and 1b were finally established as (7′′S,8′′R)-5-hydroxy-7′′-(4′′-hydroxy-3′′-methoxyphenyl)-8′′(hydroxymethyl)-3-(2′-hydroxyphenyl)-8-methyl-7′′,8′′-dihydropyrano[3,2-g]chromen-4(9H)-one and (7′′R,8′′S)-5-hydroxy-7′′-(4′′-hydroxy-3′′-methoxyphenyl)-8′′-(hydroxymethyl)-3-(2′-hydroxyphenyl)-8-methyl-7′′,8′′-dihydropyrano[3,2-g]chromen-4(9H)-one, respectively. They are named as pisonone A and pisonone B. As far as we know, these two compounds are the first examples of isoflavonolignans featuring a pyranoid ring in nature.
3) as mobile phase (Fig. 3a). The absolute configurations of 1a and 1b were determined by ECD calculations. The experimental ECD curves of 1a and 1b were similar to the computed curves of 1a (7′′S and 8′′R) and 1b (7′′R and 8′′S), respectively (Fig. 3b). Therefore, the structures of 1a and 1b were finally established as (7′′S,8′′R)-5-hydroxy-7′′-(4′′-hydroxy-3′′-methoxyphenyl)-8′′(hydroxymethyl)-3-(2′-hydroxyphenyl)-8-methyl-7′′,8′′-dihydropyrano[3,2-g]chromen-4(9H)-one and (7′′R,8′′S)-5-hydroxy-7′′-(4′′-hydroxy-3′′-methoxyphenyl)-8′′-(hydroxymethyl)-3-(2′-hydroxyphenyl)-8-methyl-7′′,8′′-dihydropyrano[3,2-g]chromen-4(9H)-one, respectively. They are named as pisonone A and pisonone B. As far as we know, these two compounds are the first examples of isoflavonolignans featuring a pyranoid ring in nature.
| Position | 1a | 2b | 3b | |||
|---|---|---|---|---|---|---|
| δH (J in Hz) | δC | δH (J in Hz) | δC | δH (J in Hz) | δC | |
| a Recorded in CDCl3.b Recorded in methanol-d4. | ||||||
| 1 | 132.3 | |||||
| 2 | 8.09, s | 156.0 | 8.19, s | 157.2 | 6.98, br s | 112.2 |
| 3 | 122.9 | 122.0 | 145.6 | |||
| 4 | 182.5 | 182.8 | 149.4 | |||
| 4a | 104.8 | 106.0 | ||||
| 5 | 157.2 | 158.1 | 130.4 | |||
| 6 | 106.5 | 107.0 | 6.98, br s | 116.6 | ||
| 7 | 159.7 | 160.1 | 5.59, d (16.2) | 134.3 | ||
| 8 | 103.2 | 103.8 | 6.19, m | 124.3 | ||
| 8a | 153.3 | 154.7 | ||||
| 9 | 2.74, dd (17.4, 10.2) | 21.8 | 2.73, dd (16.8, 10.8) | 22.6 | 4.08, dd (6.0, 1.2) | 74.3 |
| 2.98, dd (17.4, 5.4) | 2.99, dd (16.8, 4.8) | |||||
| 8-CH3 | 2.22, s | 7.7 | 2.23, s | 7.6 | ||
| 3-OCH3 | 3.90, s | 56.8 | ||||
| 9-OCH3 | 3.39, s | 58.0 | ||||
| 1′ | 120.4 | 119.8 | 134.3 | |||
| 2′ | 156.2 | 156.8 | 6.96, d (1.8) | 110.6 | ||
| 3′ | 7.10, dd (7.8, 1.2) | 119.8 | 6.94, dd (7.8, 1.2) | 117.2 | 149.1 | |
| 4′ | 7.36, ddd (7.8, 7.8, 1.8) | 130.8 | 7.29, ddd (7.8, 7.8, 1.8) | 132.7 | 147.7 | |
| 5′ | 7.00, ddd (7.8, 7.8, 1.2) | 121.3 | 6.92, ddd (7.8, 7.8, 1.2) | 120.7 | 6.79, d (7.8) | 116.2 |
| 6′ | 7.19, dd (7.8, 1.8) | 129.9 | 7.26, dd (7.8, 1.8) | 130.9 | 6.84, dd (7.8, 1.8) | 119.9 |
| 7′ | 5.50, d (6.6) | 89.7 | ||||
| 8′ | 3.63, m | 52.7 | ||||
| 9′ | 3.65, m | 75.7 | ||||
| 3.72, m | ||||||
| 3′-OCH3 | 3.84, s | 56.4 | ||||
| 9′-OCH3 | 3.41, s | 59.3 | ||||
| 1′′ | 131.1 | 131.4 | ||||
| 2′′ | 6.92, d (1.8) | 109.1 | 6.73, s | 105.3 | ||
| 3′′ | 147.0 | 149.4 | ||||
| 4′′ | 146.1 | 136.7 | ||||
| 5′′ | 6.95, d (7.8) | 114.6 | 149.4 | |||
| 6′′ | 6.91, dd (7.8, 1.8) | 120.0 | 6.73, s | 105.3 | ||
| 7′′ | 5.02, d (9.0) | 81.0 | 5.02, d (8.4) | 82.0 | ||
| 8′′ | 2.25, m | 39.7 | 2.26, m | 40.8 | ||
| 9′′ | 3.55, dd (10.8, 4.8) | 63.4 | 3.43, dd (10.8, 4.8) | 63.4 | ||
| 3.65, dd (10.8, 4.8) | 3.55, dd (10.8, 4.8) | |||||
| 3′′-OCH3 | 3.92, s | 56.2 | 3.87, s | 56.8 | ||
| 5′′-OCH3 | 3.87, s | 56.8 | ||||
| 5-OH | 12.54, s | |||||
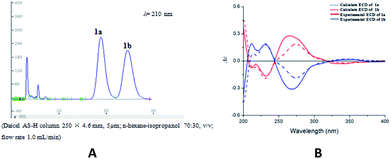 | ||
| Fig. 3 (A) Chiral-phase HPLC analytical chromatogram of 1. (B) Comparison of calculated and experimental ECD spectra of 1. | ||
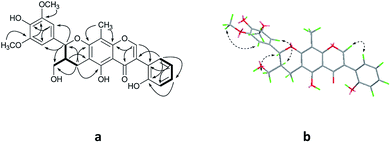
Compound 2 was isolated as yellow oil, and had a molecular formula of C28H26O9 as determined by HRESIMS ion at m/z 507.1649 [M + H]+. The 1H and 13C NMR data (Table 1) showed similar signals to those of 1, and indicated that the only difference was the presence of another methoxy group in 2. This substitution was placed at C-5′′ by the correlations (Fig. 4a) between the OCH3 (δH 3.87, s) and C-5′′ (δC 149.4) in the HMBC spectrum. The relative configurations of C-7′′ and C-8′′ were deduced from analysis of the coupling constant (J = 8.4 Hz) and the key NOESY correlations (Fig. 4b) of H-8′′/H-6′′ and H-7′′/CH2-9′′, and suggested a trans relationship between them. For the same reason as 1, the racemate of 2a and 2b was obtained by the chiral-phase separation. The calculated ECD spectra were in good agreement with the experimental spectra (Fig. 5), confirming that compounds 2a and 2b possessed the (7′′S and 8′′R) and (7′′R and 8′′S) configurations, respectively. Thus, the planar structure of 2 were elucidated as 5-hydroxy-7′′-(4′′-hydroxy-3′′,5′′-dimethoxyphenyl)-8′′-(hydroxymethyl)-3-(2′-hydroxyphenyl)-8-methyl-7′′,8′′-dihydropyrano[3,2-g]chromen-4(9H)-one. Compounds 2a and 2b are named as pisonone C and pisonone D, respectively.
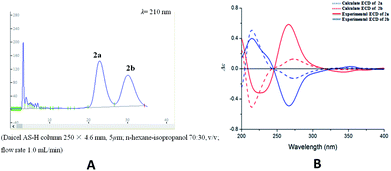 | ||
| Fig. 5 (A) Chiral-phase HPLC analytical chromatogram of 2. (B) Comparison of calculated and experimental ECD spectra of 2. | ||
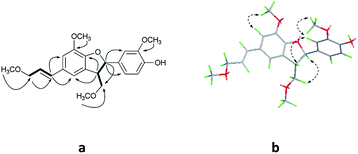
Compound 3 was acquired as colorless oil. On the basis of its HRESIMS at m/z 409.1621 [M + Na]+, its molecular formula was determined as C22H26O6. The 1H NMR spectrum (Table 1) showed two groups of aromatic protons at δH 6.98 (2H, br s, H-2 and H-6), 6.96 (1H, d, J = 1.8 Hz, H-2′), 6.84 (1H, dd, J = 7.8, 1.8 Hz, H-6′) and 6.79 (1H, d, J = 7.8 Hz, H-5′) corresponding to 1,3,4,5-tetrasubstituted and 1,3,4-trisubstituted phenyl moieties. In addition, two trans olefinic protons at δH 5.59 (1H, d, J = 16.2 Hz, H-7) and 6.19 (1H, m, H-8), one oxymethine protons at δH 5.50 (1H, d, J = 6.6 Hz, H-7′), two oxymethylene protons at δH 4.08 (2H, dd, J = 6.0, 1.2 Hz, H-9), 3.72 (1H, m, H-9′) and 3.65 (1H, m, H-9′) were observed. The 13C NMR and HSQC spectra revealed the presence of 22 carbon resonances, including 12 phenyl carbons, 2 olefinic carbon, 4 methoxy carbons, and 4 aliphatic carbons. Comparison of the NMR data with those of the dehydrodiconiferyl alcohol,11 they had a similar planar structure except for the presence of a methoxy group in 3. The methoxy group was determined at C-9′ by the HMBC correlations (Fig. 6a). According to the J7′,8′ value (6.6 Hz) and key NOESY correlations (Fig. 6b) of H-8′/H-2′ and H-7′/CH2-9′, the relative configuration of C-7′ and C-8′ was suggested to be trans. The racemate of 3a and 3b was also separated by chiral HPLC, and the absolute configuration of their furan rings was identified by comparing of their experimental and calculated ECD data (Fig. 7). Thus, compounds 3a and 3b were determined as shown and named as (7′R,8′S)-9′-methoxy-dehydrodiconiferyl alcohol and (7′S,8′R)-9′-methoxy-dehydrodiconiferyl alcohol.
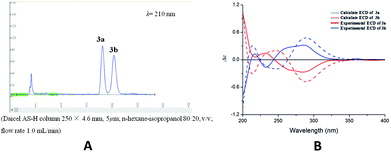 | ||
| Fig. 7 (A) Chiral-phase HPLC analytical chromatogram of 3. (B) Comparison of calculated and experimental ECD spectra of 3. | ||
Compound 5 was obtained as yellow needles. It showed a quasi-molecular ion peak at m/z 329.1020 [M + H]+, corresponding to the molecular formula of C18H16O6. The 1D NMR spectra (Table 2) displayed similar substitution pattern as 4, the major difference between the two compounds was the methyl etherification at C-9 in 5. The above conclusion was confirmed by the HMBC correlations of OCH3 with C-9 (δC 67.8). Thus, the structure of 5 was assigned as 5,7,2′-trihydroxy-6-methylene-8-methyl-9-methoxyisoflavone, and named as pisonone E.
| Position | 5 | 6 | 7 | |||
|---|---|---|---|---|---|---|
| δH (J in Hz) | δC | δH (J in Hz) | δC | δH (J in Hz) | δC | |
| 2 | 8.09, s | 156.0 | 8.08, s | 155.9 | 8.12, s | 154.8 |
| 3 | 123.1 | 123.0 | 125.2 | |||
| 4 | 182.5 | 182.4 | 181.3 | |||
| 4a | 104.6 | 104.5 | 104.5 | |||
| 5 | 156.5 | 156.3 | 165.4 | |||
| 6 | 105.6 | 105.9 | 109.9 | |||
| 7 | 162.4 | 162.5 | 168.2 | |||
| 8 | 103.5 | 103.4 | 102.5 | |||
| 8a | 154.9 | 154.8 | 158.2 | |||
| 9 | 4.90, s | 67.8 | 4.92, s | 65.9 | ||
| 6-CH3 | 2.16, s | 6.7 | ||||
| 8-CHO | 10.37, s | 189.8 | ||||
| 8-CH3 | 2.25, s | 7.4 | 2.24, s | 7.3 | ||
| 9-OCH3 | 3.53, s | 58.9 | ||||
| 9-OCH2CH3 | 3.70, dd (14.4, 7.2) | 67.2 | ||||
| 9-OCH2CH3 | 1.33, t (7.2) | 15.1 | ||||
| 1′ | 120.2 | 120.2 | 119.0 | |||
| 2′ | 156.2 | 156.1 | 155.9 | |||
| 3′ | 7.10, dd (7.8, 1.2) | 119.8 | 7.10, dd (7.8, 1.2) | 119.8 | 7.11, dd (7.8, 1.2) | 119.9 |
| 4′ | 7.36, ddd (7.8, 7.8, 1.8) | 130.8 | 7.36, ddd (7.8, 7.8, 1.8) | 130.8 | 7.40, ddd (7.8, 7.8, 1.8) | 131.4 |
| 5′ | 7.00, ddd (7.8, 7.8, 1.2) | 121.3 | 7.00, ddd (7.8, 7.8, 1.2) | 121.3 | 7.04, ddd (7.8, 7.8, 1.2) | 121.6 |
| 6′ | 7.18, dd (7.8, 1.8) | 129.9 | 7.17, dd (7.8, 1.8) | 129.9 | 7.19, dd (7.8, 1.8) | 130.2 |
| 5-OH | 12.59, s | 12.58, s | ||||
| 7-OH | 9.33, br s | 9.62, br s | ||||
| 2′-OH | 8.22, br s | 8.25, br s | ||||
Compound 6 was isolated as a yellow powder with the molecular formula of C19H18O6 (HRESIMS and NMR data). It has more 14 mass units than that of compound 5. The 1H and 13C NMR data of 6 (Table 2) were similar to those of 5, indicating that the only difference between the two structures was the presence of an additional oxymethylene group in 6. The oxymethylene group was assigned to C-9 by the HMBC correlations from OCH2CH3-9 to C-9 (δC 65.9) and OCH2CH3-9 (δC 15.1), as well as the 1H–1H COSY correlations from OCH2CH3-9 (δH 3.70) to OCH2CH3-9 (δH 1.33). Thus, the structure of 6 was defined as 5,7,2′-trihydroxy-6-methylene-8-methyl-9-ethoxyisoflavone, and named as pisonone F.
Compounds 7 and 8 were obtained as colorless oil, and determined to have the same molecular formula C17H12O6 by 13C NMR and HRESIMS data. Extensive analysis of 1D and 2D NMR data (Tables 2 and 3) indicated that their structures were similar to that of 4, and the major differences were the presence of methyl groups at C-6 or C-8, replaced by an aldehyde group. The position of the aldehyde groups were located at C-8 in 7 and at C-6 in 8, respectively, which were elucidated by the HMBC correlations from CHO-8 to C-7 (δC 168.2) and C-8a (δC 158.2) in 7, as well as the HMBC correlations from CHO-6 to C-5 (δC 166.0) and C-7 (δC 166.2) in 8. Thus, the structures of 7 and 8 were established as 5,7,2′-trihydroxy-6-methyl-8-aldehydeisoflavone and 5,7,2′-trihydroxy-6-aldehyde-8-methylisoflavone, and named as pisonone G and pisonone H, respectively.
| Position | 8 | 9 | 10 | |||
|---|---|---|---|---|---|---|
| δH (J in Hz) | δC | δH (J in Hz) | δC | δH (J in Hz) | δC | |
| 2 | 8.09, s | 156.2 | 8.15, s | 156.2 | 8.17, s | 156.6 |
| 3 | 123.6 | 123.7 | 123.6 | |||
| 4 | 182.7 | 182.8 | 183.0 | |||
| 4a | 104.0 | 107.6 | 107.9 | |||
| 5 | 166.0 | 160.2 | 158.4 | |||
| 6 | 106.7 | 115.6 | 118.3 | |||
| 7 | 166.2 | 164.6 | 163.7 | |||
| 8 | 103.7 | 112.5 | 110.0 | |||
| 8a | 159.2 | 153.5 | 154.9 | |||
| 6-CHO | 10.42, s | 193.0 | ||||
| 6-CH2OH | 4.84, s | 62.6 | ||||
| 6-CH3 | 2.26, s | 8.7 | ||||
| 7-OCH3 | 3.95, s | 54.2 | 3.92, s | 55.0 | ||
| 8-CH2OH | 4.93, s | 62.5 | ||||
| 8-CH3 | 2.23, s | 6.7 | 2.34, s | 8.5 | ||
| 1′ | 119.2 | 119.8 | 119.7 | |||
| 2′ | 155.9 | 156.1 | 155.9 | |||
| 3′ | 7.11, dd (7.8, 1.2) | 119.8 | 7.11, dd (7.8, 1.2) | 119.8 | 7.11, dd (7.8, 1.2) | 119.8 |
| 4′ | 7.39, ddd (7.8, 7.8, 1.8) | 131.3 | 7.38, ddd (7.8, 7.8, 1.8) | 131.0 | 7.38, ddd (7.8, 7.8, 1.8) | 131.0 |
| 5′ | 7.03, ddd (7.8, 7.8, 1.2) | 121.6 | 7.02, ddd (7.8, 7.8, 1.2) | 121.5 | 7.02, ddd (7.8, 7.8, 1.2) | 121.5 |
| 6′ | 7.19, dd (7.8, 1.8) | 130.0 | 7.17, dd (7.8, 1.8) | 130.1 | 7.18, dd (7.8, 1.8) | 130.0 |
| 5-OH | 12.62, s | 12.58, s | ||||
Compounds 9 and 10 were isolated as colorless oil. Its molecular formula was C18H16O6 as deduced by their HRESIMS and NMR data. Comparison of their 1H and 13C NMR data (Table 3) suggested that they displayed similar structure to that of 4, the differences between them were the presence of a hydroxymethyl group and a methoxy group in 9 and 10. The HMBC correlations from CH2OH-8 to C-7 (δC 164.6) and C-8a (δC 153.5) in 9 and the correlations from CH2OH-6 to C-5 (δC 158.4) and C-7 (δC 163.7) in 10 indicated that the hydroxymethyl groups were placed at C-8 in 9 and at C-6 in 10, respectively. The methoxy groups in both 9 and 10 were located at C-7 by the relevant HMBC and NOESY experiments. Thus, the structures of 9 and 10 were deduced to be 5,2′-dihydroxy-6-methyl-7-methoxy-8-hydroxymethylisoflavone and 5,2′-dihydroxy-6-hydroxymethyl-7-methoxy-8-methylisoflavone, and named as pisonone I and pisonone J.
The seven known compounds were identified as 6,8-dimethylisogenistein (4),2 pinobanksin (11),12 alpinone (12),13 desmethoxymatteucinol (13),14 matteucin (14),15 ozoroalide (15),16 and ethyl orsellinate (16)17 by comparing their spectroscopic data with the literature values.
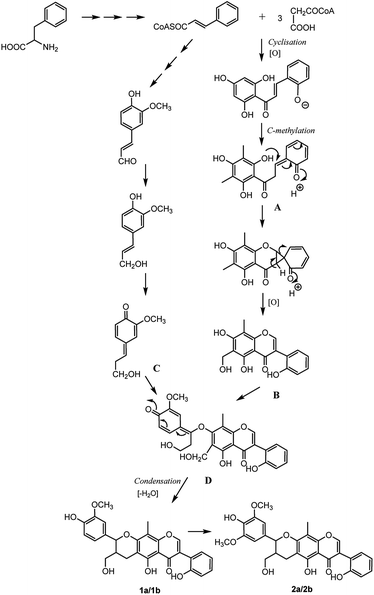
The analysis of the biosynthetic pathway of the isoflavonolignans (1a/1b, 2a/2b) revealed that the structures were formed via phenylpropanoid pathway transforming phenylalanine into 4-coumaroyl-CoA, which extended the isoflavone and monolignol pathways. The condensation of three malonyl-CoAs and one 4-coumaroyl-CoA produced the isoflavone fragment A, which was methylated on the C-6 and C-8 of the B-ring. The methyl group at C-6 was then oxidized to yield fragment B, which was the precursor of the isoflavonoid part for compounds 1 and 2. On the other hand, coniferyl alcohol (fragment C) formed the lignin moiety. Finally, the biosynthesis of isoflavonolignans (1a/1b and 2a/2b) occurred by the elimination of water and cyclization between flavonoid precursor and coniferyl alcohol (Fig. 8).
All compounds were evaluated for their in vitro inhibitory effects on LPS-induced NO production in macrophages (Table 4). Among them, compounds 13 and 15 exhibited moderate inhibitory activities with IC50 values of 33.15 and 11.30 μM, respectively.
| Compounds | IC50 ± SDb (μM) | Compounds | IC50 ± SD (μM) |
|---|---|---|---|
| a Resveratrol was used as positive control. Results are presented as the means ± SD (n = 3).b Concentration necessary for 50% inhibition (IC50). | |||
| 1a | >100 | 8 | >100 |
| 1b | >100 | 9 | >100 |
| 2a | >100 | 10 | >100 |
| 2b | >100 | 11 | 53.91 ± 0.45 |
| 3a | >100 | 12 | 84.32 ± 0.72 |
| 3b | >100 | 13 | 33.15 ± 1.18 |
| 4 | 73.90 ± 0.24 | 14 | >100 |
| 5 | 73.13 ± 0.66 | 15 | 11.30 ± 0.87 |
| 6 | >100 | 16 | 52.09 ± 1.21 |
| 7 | >100 | Resveratrol | 40.20 ± 0.94 |
The cytotoxic activities of compounds 1–16 were evaluated against human chronic myelogenous leukemia (K562) and human lung carcinoma (A549) cell lines that present adherent and non-adherent cancer cell type models (Table 5). Compound 5 exhibited the strongest activity against K562 cell line among all the isolates, whereas some of the compounds showed moderate activities against both cell lines. Compounds 1–3 were proved to be inactive in both assays.
| Compounds | A549 | K562 | Compounds | A549 | K562 |
|---|---|---|---|---|---|
| a Presents a pair of enantiomers; “–” presents IC50 values > 50 μM. | |||||
| 1a | – | – | 10 | – | – |
| 2a | – | – | 11 | 36.8 | 18.4 |
| 3a | – | – | 12 | 35.0 | 17.5 |
| 4 | 33.6 | 16.8 | 13 | – | 17.6 |
| 5 | 13.6 | 6.7 | 14 | – | 16.7 |
| 6 | 13.1 | 14.6 | 15 | 34.2 | 7.5 |
| 7 | – | 35.3 | 16 | – | 11.2 |
| 8 | – | – | Adriamycin | 2.9 | 2.0 |
| 9 | – | – | |||
Conclusions
Pisonia umbellifera is a folk medicine in Hainan province of China. In our investigation searching for novel bioactive constituents from natural source, twelve new compounds along with seven known ones were isolated from P. umbellifera. Compounds 1 and 2 are the first examples of isoflavonolignans featuring a pyranoid ring in nature, which enriches the structural types of this lignans. The anti-inflammatory and cytotoxic activities of all compounds were evaluated. Compounds 13 and 15 exhibited moderate in vitro anti-inflammatory activities, and compound 5 exhibited the strongest activity against K562 cell line among all the isolates.Experimental
General experimental procedures
Optical rotations were measured with a Perkin-Elmer 241 polarimeter. The UV spectra were conducted on a Shimadzu UV-2201 spectrometer. ECD spectra were recorded on a JASCO J-815 spectrometer. HRESIMS were recorded on Agilent Accurate-Mass-Q-TOF MS 6520 system equipped with electrospray ionization (ESI) source. NMR spectra were recorded on a Bruker AV-600 NMR spectrometer using TMS as an internal standard. The chromatographic silica gel (200–300 mesh) and polyamide (100–200 mesh) were purchased from Qingdao Marine Chemical Factory (Qingdao, China) and ODS (50 μm) was produced by YMC Co. LTD., Kyoto, Japan. Sephadex LH-20 was purchased from GE Healthcare. RP-HPLC separations were conducted using a Shimadzu LC-20AT liquid chromatograph with a YMC-PACK ODS-A column (250 × 10 mm, 5 μm) and Knauer K-2600 UV detector. Chiral separation was conducted in a Daicel AS-H column (250 × 4.6 mm, 5 μm) from Daicel Chemical Industries, Ltd. (Japan). TLC spots were visualized under UV light and by dipping into 10% H2SO4 in EtOH followed by heating. RAW 264.7 cells, human chronic myelogenous leukemia (K562) and human lung carcinoma (A549) cell lines were obtained from National infrastructure of cell line resource.Plant material
The plant material was collected in Hainan province, China, and identified by Professor Xilong Zheng, Hainan Branch Institute of Medical Plant Development, Chinese Academy of Medical Sciences, Wanning, China. The voucher specimen (GM-20170121) was deposited in the Institute of Chinese Materia Medica, China Academy of Chinese Medical Sciences, Beijing, China.Extraction and isolation
The dried stems of P. umbellifera (5 kg) were extracted with 95% EtOH (3 × 20 L) three times (3 h, 2 h, 1 h) under reflux. The EtOH extracts were concentrated to afford a crude extract (500 g), which was suspended in H2O and partitioned successively with petroleum ether, CH2Cl2 and EtOAc. The CH2Cl2 extract (35 g) was subjected to column chromatography (CC) on silica gel using a gradient system of increasing polarity of petroleum ether–acetone (100![[thin space (1/6-em)]](https://www.rsc.org/images/entities/char_2009.gif) :
:![[thin space (1/6-em)]](https://www.rsc.org/images/entities/char_2009.gif) 0–0
0–0![[thin space (1/6-em)]](https://www.rsc.org/images/entities/char_2009.gif) :
:![[thin space (1/6-em)]](https://www.rsc.org/images/entities/char_2009.gif) 100, v/v) to give 10 fractions (Fr. A–Fr. J). Fr. D (3.2 g) was chromatographed over RP-C18 silica gel eluted with MeOH–H2O (from 60 to 80%) to give three fractions Fr. D1–Fr. D3. Fr. D1 (200 mg) was subjected to Sephadex LH-20 CC eluted with MeOH to give two subfractions (Fr. D1A–Fr. D1B). Fr. D1A was repeatedly recrystallized in petroleum ether–acetone (1
100, v/v) to give 10 fractions (Fr. A–Fr. J). Fr. D (3.2 g) was chromatographed over RP-C18 silica gel eluted with MeOH–H2O (from 60 to 80%) to give three fractions Fr. D1–Fr. D3. Fr. D1 (200 mg) was subjected to Sephadex LH-20 CC eluted with MeOH to give two subfractions (Fr. D1A–Fr. D1B). Fr. D1A was repeatedly recrystallized in petroleum ether–acetone (1![[thin space (1/6-em)]](https://www.rsc.org/images/entities/char_2009.gif) :
:![[thin space (1/6-em)]](https://www.rsc.org/images/entities/char_2009.gif) 1) to give 3 (2.6 mg) and 15 (2.1 mg). Fr. D1B was further purified by a semi-preparative HPLC (CH3CN–H2O, 75
1) to give 3 (2.6 mg) and 15 (2.1 mg). Fr. D1B was further purified by a semi-preparative HPLC (CH3CN–H2O, 75![[thin space (1/6-em)]](https://www.rsc.org/images/entities/char_2009.gif) :
:![[thin space (1/6-em)]](https://www.rsc.org/images/entities/char_2009.gif) 25) to afford 5 (3.4 mg), 6 (8.9 mg) and 13 (2.9 mg). Fr. F (2.0 g) was divided into subfractions Fr. F1 and Fr. F2 by reversed-phase ODS CC eluted with MeOH–H2O (from 50 to 80%). 2 (2.4 mg) and 12 (3.7 mg) were obtained from Fr. F1 using Sephadex LH-20 column (MeOH). Fr. F2 was separated by semi-preparative HPLC on an ODS column (CH3CN–H2O, 55
25) to afford 5 (3.4 mg), 6 (8.9 mg) and 13 (2.9 mg). Fr. F (2.0 g) was divided into subfractions Fr. F1 and Fr. F2 by reversed-phase ODS CC eluted with MeOH–H2O (from 50 to 80%). 2 (2.4 mg) and 12 (3.7 mg) were obtained from Fr. F1 using Sephadex LH-20 column (MeOH). Fr. F2 was separated by semi-preparative HPLC on an ODS column (CH3CN–H2O, 55![[thin space (1/6-em)]](https://www.rsc.org/images/entities/char_2009.gif) :
:![[thin space (1/6-em)]](https://www.rsc.org/images/entities/char_2009.gif) 45) to obtain compounds 9 (2.6 mg) and 10 (3.0 mg). Fr. H (2.5 g) was purified on a polyamide column, eluted with a gradient of MeOH–H2O from 2
45) to obtain compounds 9 (2.6 mg) and 10 (3.0 mg). Fr. H (2.5 g) was purified on a polyamide column, eluted with a gradient of MeOH–H2O from 2![[thin space (1/6-em)]](https://www.rsc.org/images/entities/char_2009.gif) :
:![[thin space (1/6-em)]](https://www.rsc.org/images/entities/char_2009.gif) 8 to 9
8 to 9![[thin space (1/6-em)]](https://www.rsc.org/images/entities/char_2009.gif) :
:![[thin space (1/6-em)]](https://www.rsc.org/images/entities/char_2009.gif) 1, to yield four subfractions (Fr. H1–Fr. H4). Fr. H1 (320 mg) was subjected to a silica gel column eluted with petroleum ether–EtOAc (from 10
1, to yield four subfractions (Fr. H1–Fr. H4). Fr. H1 (320 mg) was subjected to a silica gel column eluted with petroleum ether–EtOAc (from 10![[thin space (1/6-em)]](https://www.rsc.org/images/entities/char_2009.gif) :
:![[thin space (1/6-em)]](https://www.rsc.org/images/entities/char_2009.gif) 1 to 2
1 to 2![[thin space (1/6-em)]](https://www.rsc.org/images/entities/char_2009.gif) :
:![[thin space (1/6-em)]](https://www.rsc.org/images/entities/char_2009.gif) 1), followed by recrystallization from MeOH to give 4 (4.1 mg) and 11 (3.5 mg). 1 (2.3 mg) and 14 (3.2 mg) was isolated from Fr. H2 by a Sephadex LH-20 column chromatography (CH2Cl2–MeOH, 1
1), followed by recrystallization from MeOH to give 4 (4.1 mg) and 11 (3.5 mg). 1 (2.3 mg) and 14 (3.2 mg) was isolated from Fr. H2 by a Sephadex LH-20 column chromatography (CH2Cl2–MeOH, 1![[thin space (1/6-em)]](https://www.rsc.org/images/entities/char_2009.gif) :
:![[thin space (1/6-em)]](https://www.rsc.org/images/entities/char_2009.gif) 1). Fr. H4 was further purified by using semi-preparative HPLC (CH3CN–H2O, 65
1). Fr. H4 was further purified by using semi-preparative HPLC (CH3CN–H2O, 65![[thin space (1/6-em)]](https://www.rsc.org/images/entities/char_2009.gif) :
:![[thin space (1/6-em)]](https://www.rsc.org/images/entities/char_2009.gif) 15) to yield 7 (2.6 mg), 8 (2.4 mg) and 16 (4.6 mg).
15) to yield 7 (2.6 mg), 8 (2.4 mg) and 16 (4.6 mg).
![[thin space (1/6-em)]](https://www.rsc.org/images/entities/char_2009.gif) ε) 237 (0.36) nm; 271 (0.12) nm; ECD (MeOH) λmax (Δε) 1a, 232 (−0.17) and 266 (+0.28) nm; 1b, 231 (+0.18) and 268 (−0.31) nm; 1H NMR (600 MHz, CDCl3) and 13C NMR (150 MHz, CDCl3) data, see Table 1; HRESIMS m/z 477.1545 [M + H]+ (calcd for C27H25O8, 477.1544).
ε) 237 (0.36) nm; 271 (0.12) nm; ECD (MeOH) λmax (Δε) 1a, 232 (−0.17) and 266 (+0.28) nm; 1b, 231 (+0.18) and 268 (−0.31) nm; 1H NMR (600 MHz, CDCl3) and 13C NMR (150 MHz, CDCl3) data, see Table 1; HRESIMS m/z 477.1545 [M + H]+ (calcd for C27H25O8, 477.1544).![[thin space (1/6-em)]](https://www.rsc.org/images/entities/char_2009.gif) ε) 239 (0.47) nm; 270 (0.11) nm; ECD (MeOH) λmax (Δε) 2a, 231 (−0.33) and 266 (+0.64) nm; 2b, 212 (+0.48) and 267 (−0.53) nm; 1H NMR (600 MHz, MeOD) and 13C NMR (150 MHz, MeOD) data, see Table 1; HRESIMS m/z 507.1649 [M + H]+ (calcd for C28H27O9, 507.1650).
ε) 239 (0.47) nm; 270 (0.11) nm; ECD (MeOH) λmax (Δε) 2a, 231 (−0.33) and 266 (+0.64) nm; 2b, 212 (+0.48) and 267 (−0.53) nm; 1H NMR (600 MHz, MeOD) and 13C NMR (150 MHz, MeOD) data, see Table 1; HRESIMS m/z 507.1649 [M + H]+ (calcd for C28H27O9, 507.1650).![[thin space (1/6-em)]](https://www.rsc.org/images/entities/char_2009.gif) ε) 240 (0.21) nm; 280 (0.48) nm; ECD (MeOH) λmax (Δε) 3a, 232 (+0.14) and 284 (−0.27) nm; 3b, 233 (−0.20) and 287 (+0.29) nm; 1H NMR (600 MHz, MeOD) and 13C NMR (150 MHz, MeOD) data, see Table 1; HRESIMS m/z 409.1621 [M + Na]+ (calcd for C22H26NaO6, 409.1622).
ε) 240 (0.21) nm; 280 (0.48) nm; ECD (MeOH) λmax (Δε) 3a, 232 (+0.14) and 284 (−0.27) nm; 3b, 233 (−0.20) and 287 (+0.29) nm; 1H NMR (600 MHz, MeOD) and 13C NMR (150 MHz, MeOD) data, see Table 1; HRESIMS m/z 409.1621 [M + Na]+ (calcd for C22H26NaO6, 409.1622).![[thin space (1/6-em)]](https://www.rsc.org/images/entities/char_2009.gif) ε) 222 (0.75) nm; 267 (0.15) nm; 1H NMR (600 MHz, CDCl3) and 13C NMR (150 MHz, CDCl3) data, see Table 2; HRESIMS m/z 329.1020 [M + H]+ (calcd for C18H17O6, 329.1020).
ε) 222 (0.75) nm; 267 (0.15) nm; 1H NMR (600 MHz, CDCl3) and 13C NMR (150 MHz, CDCl3) data, see Table 2; HRESIMS m/z 329.1020 [M + H]+ (calcd for C18H17O6, 329.1020).![[thin space (1/6-em)]](https://www.rsc.org/images/entities/char_2009.gif) ε) 232 (0.11) nm; 268 (0.22) nm; 1H NMR (600 MHz, CDCl3) and 13C NMR (150 MHz, CDCl3) data, see Table 2; HRESIMS m/z 365.0995 [M + Na]+ (calcd for C19H18NaO6, 365.0996).
ε) 232 (0.11) nm; 268 (0.22) nm; 1H NMR (600 MHz, CDCl3) and 13C NMR (150 MHz, CDCl3) data, see Table 2; HRESIMS m/z 365.0995 [M + Na]+ (calcd for C19H18NaO6, 365.0996).![[thin space (1/6-em)]](https://www.rsc.org/images/entities/char_2009.gif) ε) 241 (0.42) nm; 274 (0.81) nm; 1H NMR (600 MHz, CDCl3) and 13C NMR (150 MHz, CDCl3) data, see Table 2; HRESIMS m/z 313.0707 [M + H]+ (calcd for C17H13O6, 313.0707).
ε) 241 (0.42) nm; 274 (0.81) nm; 1H NMR (600 MHz, CDCl3) and 13C NMR (150 MHz, CDCl3) data, see Table 2; HRESIMS m/z 313.0707 [M + H]+ (calcd for C17H13O6, 313.0707).![[thin space (1/6-em)]](https://www.rsc.org/images/entities/char_2009.gif) ε) 241 (0.56) nm; 287 (0.45) nm; 1H NMR (600 MHz, CDCl3) and 13C NMR (150 MHz, CDCl3) data, see Table 3; HRESIMS m/z 313.0707 [M + H]+ (calcd for C17H13O6, 313.0707).
ε) 241 (0.56) nm; 287 (0.45) nm; 1H NMR (600 MHz, CDCl3) and 13C NMR (150 MHz, CDCl3) data, see Table 3; HRESIMS m/z 313.0707 [M + H]+ (calcd for C17H13O6, 313.0707).![[thin space (1/6-em)]](https://www.rsc.org/images/entities/char_2009.gif) ε) 240 (0.68) nm; 263 (0.21) nm; 1H NMR (600 MHz, CDCl3) and 13C NMR (150 MHz, CDCl3) data, see Table 3; HRESIMS m/z 329.1020 [M + H]+ (calcd for C18H17O6, 329.1020).
ε) 240 (0.68) nm; 263 (0.21) nm; 1H NMR (600 MHz, CDCl3) and 13C NMR (150 MHz, CDCl3) data, see Table 3; HRESIMS m/z 329.1020 [M + H]+ (calcd for C18H17O6, 329.1020).![[thin space (1/6-em)]](https://www.rsc.org/images/entities/char_2009.gif) ε) 234 (0.77) nm; 263 (0.17) nm; 1H NMR (600 MHz, CDCl3) and 13C NMR (150 MHz, CDCl3) data, see Table 3; HRESIMS m/z 329.1020 [M + H]+ (calcd for C18H17O6, 329.1020).
ε) 234 (0.77) nm; 263 (0.17) nm; 1H NMR (600 MHz, CDCl3) and 13C NMR (150 MHz, CDCl3) data, see Table 3; HRESIMS m/z 329.1020 [M + H]+ (calcd for C18H17O6, 329.1020).ECD computation section
The absolute configurations shown as 1a/2a/3a were used as the input configuration of theoretical calculations. Firstly, a systematic conformational analysis was performed to find all possible conformers within a 3 kcal mol−1 energy window in the MMFF94 force field. For 3a, the 3-methoxypropen-1-yl group was replaced by vinyl group to reduce the computation. The obtained conformers were further optimized and identified as the stable conformers at the B3LYP/6-31G (d) level by the Gaussian 09 program.18 Main conformers (Boltzmann distribution > 1%) of each compound were chosen for ECD calculations. All quantum computations are performed on an IBM cluster machine located at the High Performance Computing Center of Peking Union Medical College. The lowest 120 electronic excitations were calculated and energies, oscillator strengths, and rotational strengths (velocity) of each electronic excitation were obtained. ECD spectra were then simulated with a half-bandwidth of 0.30 or 0.40 eV. By comparison of the calculated and experimental ECD spectra, their configurations were established.Chiral-phase separation
Compounds 1 and 2 were both separated by a chiral-phase chromatographic AS-H column (4.6 × 250 mm, 5 μm), using n-hexane/isopropanol (7![[thin space (1/6-em)]](https://www.rsc.org/images/entities/char_2009.gif) :
:![[thin space (1/6-em)]](https://www.rsc.org/images/entities/char_2009.gif) 3) as mobile phase to yield 1a (tR = 18.9 min, 0.4 mg), 1b (tR = 24.5 min, 0.5 mg), 2a (tR = 22.8 min, 0.5 mg) and 2b (tR = 30.1 min, 0.6 mg), respectively. The enantiomers of 3a (tR = 14.5 min, 0.5 mg) and 3b (tR = 16.3 min, 0.5 mg) were also obtained by chiral HPLC column eluted with n-hexane/isopropanol (8
3) as mobile phase to yield 1a (tR = 18.9 min, 0.4 mg), 1b (tR = 24.5 min, 0.5 mg), 2a (tR = 22.8 min, 0.5 mg) and 2b (tR = 30.1 min, 0.6 mg), respectively. The enantiomers of 3a (tR = 14.5 min, 0.5 mg) and 3b (tR = 16.3 min, 0.5 mg) were also obtained by chiral HPLC column eluted with n-hexane/isopropanol (8![[thin space (1/6-em)]](https://www.rsc.org/images/entities/char_2009.gif) :
:![[thin space (1/6-em)]](https://www.rsc.org/images/entities/char_2009.gif) 2).
2).
NO production inhibition bioassay
The nitrite concentration in the medium was measured as an indicator of NO production according to the Griess reaction. Briefly, RAW 264.7 cells were seeded into 96-well plates at density of 1 × 10⁵ cell per well and stimulated with 1 μg mL−1 of LPS in the presence or absence of test compounds. After incubation at 37 °C for 24 h, 100 μL of cell-free supernatant was mixed with 100 μL of Griess reagent containing equal volumes of 2% (w/v) sulfanilamide in 5% (w/v) phosphoric acid and 0.2% (w/v) of N-(1-naphthyl) ethylenediamine solution to determine nitrite production. Absorbance was measured in microplate reader at 540 nm against a calibration curve with NaNO2 standards. Experiments were performed in triplicate, and data were expressed as the mean ± SD of three independent experiments.19,20Assay for cytotoxic activity
The cytotoxic activities of compounds 1–16 against human lung adenocarcinoma strain A-549 were determined using the 3-(4,5-dimethyl-2-thiazolyl)-2,5-diphenyl-2-H-tetrazolium bromide (MTT) assay. K562 cell viability was assessed by trypan blue exclusion test. Both A-549 and K562 cells were maintained in DMEM medium containing 10% Fetal Bovine Serum (FBS) and 0.4% penicillin–streptomycin solution (100×) at 37 °C under 5% CO2. When A549 cells showed logarithmic growth, diluted them to a concentration of 1 × 10⁴ cells per mL, the diluted cell suspensions (200 μL, containing 2000 cells per well) were placed into 96-well microtiter plates and incubated at 37 °C for 24 h, at a 5% CO2 atmosphere. K562 was prepared at a concentration of 1 × 10⁴ cells per mL directly, and diluted to 96-well microtiter plates. After 72 h incubation, every well was added with the MTT or MTS solution and maintained for another 4 h. Then the cells were fixed and stained with 150 μL DMSO for 10 min. The absorption was measured at 570 nm in an Ultra Microplate Reader (Elx 808, BIO-TEX Instruments, Inc.).21Conflicts of interest
There are no conflicts to declare.Acknowledgements
This work was supported by the National Natural Science Foundation of China (No. 81502968), National Major New Drug Creation Project of China (No. 2014ZX09509001-001), and CAMS Innovation Fund for Medical Sciences (CIFMS) 2016-12M-3-010.Notes and references
- C. Lavaud, S. Beauviere, G. Massio, L. L. Men-Olivier and G. Bourdy, Phytochemistry, 1996, 43, 189–194 CrossRef CAS PubMed.
- H. T. Kuo, C. F. Peng, H. Y. Huang, C. H. Lin, I. S. Chen and I. L. Tsai, Planta Med., 2011, 77, 736–741 CrossRef CAS PubMed.
- S. Bezuidenhout Catherine, C. B. Bzuidenhoudt Barend, E. Brandt Vincent and D. Ferreira, J. Chem. Soc., Perkin Trans. 1, 1988, 1237 RSC.
- D. S. Jang, E. J. Park, M. E. Hawthorne, J. S. Vigo, J. G. Graham, F. Cabieses, B. D. Santarsiero, A. D. Mesecar, H. H. S. Fong, R. G. Mehta, J. M. Pezzuto and A. D. Kinghorn, J. Nat. Prod., 2003, 66, 583–587 CrossRef CAS PubMed.
- K. Ma, T. Ishikawa, H. Seki, K. Furihata, H. Ueki and S. Narimatsu, Heterocycles, 2005, 65, 893–900 CrossRef CAS.
- Z. Zhang, G. M. Liu, Y. H. Wang, C. S. Li, Y. L. Ren, H. Xiao, X. J. Hao and H. P. He, Chin. Chem. Lett., 2007, 18, 297–299 CrossRef CAS.
- R. J. Yang, Y. S. Lan, Z. J. Huang, C. L. Shao, H. Liang, Z. F. Chen and J. Li, Rec. Nat. Prod., 2012, 6, 212–217 CAS.
- G. P. Oliveira, T. M. G. Silva, C. A. Camara, A. L. B. D. Santana, M. S. A. Moreira and T. M. S. Silva, Phytochem. Lett., 2017, 22, 61–70 CrossRef.
- Z. G. Liu, Z. L. Li, J. Bai, D. L. Meng, N. Li, Y. H. Pei, F. Zhao and H. M. Hua, J. Nat. Prod., 2014, 77, 792–799 CrossRef CAS PubMed.
- Z. G. Liu, Z. L. Li, J. Bai, D. L. Meng, N. Li, Y. H. Pei, F. Zhao and H. M. Hua, Bioorg. Med. Chem. Lett., 2016, 26, 1–5 CrossRef CAS PubMed.
- Y. B. Liu, X. R. Cheng, J. J. Qin, S. K. Yan, H. Z. Jin and W. D. Zhang, Chin. J. Nat. Med., 2011, 9, 115–119 CAS.
- G. Julien, R. Tristan, C. Stephanie, P. P. Antonio, D. Marie-Cecile, C. C. Marie-France and M. Jean-Michel, J. Agric. Food Chem., 2017, 65, 8884–8891 CrossRef PubMed.
- H. Fujinori, T. Satoshi and M. Junya, Phytochemistry, 1991, 30, 2197–2198 CrossRef.
- C. F. Massaro, M. Katouli, T. Grkovic, H. Vu, R. J. Quinn, T. A. Heard, C. Carvalho, M. Manley-Harris, H. M. Wallace and P. Brooks, Fitoterapia, 2014, 95, 247–257 CrossRef CAS PubMed.
- W. S. Feng, X. W. Cao, X. K. Zheng and H. X. Kuang, Acta Pharm. Sin., 2005, 40, 443–446 CAS.
- P. J. M. Abreu and Y. H. Liu, Fitoterapia, 2007, 78, 388–389 CrossRef CAS PubMed.
- T. I. B. Lopes, R. G. Coelho, N. C. Yoshida and N. K. Honda, Chem. Pharm. Bull., 2008, 56, 1551–1554 CrossRef CAS PubMed.
- M. J. Frisch, G. W. Trucks, H. B. Schlegel, G. E. Scuseria, M. A. Robb, J. R. Cheeseman, G. Scalmani, V. Barone, B. Mennucci, G. A. Petersson, H. Nakatsuji, M. Caricato, X. Li, H. P. Hratchian, A. F. Izmaylov, J. Bloino, G. Zheng, J. L. Sonnenberg, M. Hada, M. Ehara, K. Toyota, R. Fukuda, J. Hasegawa, M. Ishida, T. Nakajima, Y. Honda, O. Kitao, H. Nakai, T. Vreven Jr, J. A. Montgomery, J. E. Peralta, F. Ogliaro, M. Bearpark, J. J. Heyd, E. Brothers, K. N. Kudin, V. N. Staroverov, R. Kobayashi, J. Normand, K. Raghavachari, A. Rendell, J. C. Burant, S. S. Iyengar, J. Tomasi, M. Cossi, N. Rega, J. M. Millam, M. Klene, J. E. Knox, J. B. Cross, V. Bakken, C. Adamo, J. Jaramillo, R. Gomperts, R. E. Stratmann, O. Yazyev, A. J. Austin, R. Cammi, C. Pomelli, J. W. Ochterski, R. L. Martin, K. Morokuma, V. G. Zakrzewski, G. A. Voth, P. Salvador, J. J. Dannenberg, S. Dapprich, A. D. Daniels, Ö. Farkas, J. B. Foresman, J. V. Ortiz, J. Cioslowski and D. J. Fox, Gaussian 09, Rev. C 01, Gaussian, Inc., Wallingford CT, 2009 Search PubMed.
- J. Li, F. Zhao, M. Z. Li, L. X. Chen and F. Qiu, J. Nat. Prod., 2010, 73, 1667–1671 CrossRef CAS PubMed.
- V. M. Dirsch, H. Stuppner and A. M. Vollmar, Planta Med., 1998, 64, 423–426 CrossRef CAS PubMed.
- W. Ebrahim, A. Aly, V. Wray, A. Mándi, M. H. Teiten, F. Gaascht, B. Orlikova, M. U. Kassack, W. H. Lin, M. Diederich, T. Kurtán, A. Debbab and P. Proksch, J. Med. Chem., 2013, 56, 2991–2999 CrossRef CAS PubMed.
Footnote |
| † Electronic supplementary information (ESI) available: 1D and 2D NMR, HR ESI-MS, UV and ECD spectra of 1–3 and 5–10. See DOI: 10.1039/c8ra02240b |
| This journal is © The Royal Society of Chemistry 2018 |

