 Open Access Article
Creative Commons Attribution 3.0 Unported Licence
Formation and photochemical investigation of brown carbon by hydroxyacetone reactions with glycine and ammonium sulfate†
Yan Gao ab and
Yunhong Zhang*ab
aSchool of Chemistry and Chemical Engineering, Beijing Institute of Technology, Beijing 100081, China. E-mail: yhz@bit.edu.cn
bSchool of Materials and Chemical Engineering, Bengbu College, Bengbu 233030, China. E-mail: 2857965284@qq.com
First published on 6th June 2018
Abstract
Increasing attention has been paid to atmospheric “brown carbon” (BrC) aerosols due to their effect on the earth's climate. Aqueous BrC aerosols were formed through aqueous reactions of hydroxyacetone (HA) with nitrogen compounds such as glycine (Gly) and/or ammonium sulfate (AS). When exposed to nitrogen compounds for several days, HA, as a type of aqueous carbonyl compound, becomes absorbent and fluorescent in the blue visible and near ultraviolet regions, which have been monitored by UV/vis and fluorescence spectroscopy. In this study, we quantified absorption and excitation-emission matrix (EEM) spectra in the formation of aqueous BrCs, which was generated from HA-Gly and HA-Gly-AS mixtures, respectively. The obtained data was used to determine the base-10 absorption coefficient (α), absorption Angstrom exponent (AAE), and effective quantum yield (QY). All of the related parameters provide further evidence for the formation of aqueous BrC. The absorbances of the as-obtained BrCs follow the order HA-Gly-AS > HA-Gly > HA-AS. In other words, HA-Gly-AS mixtures displayed the most intense absorbances, whereas HA-AS mixtures barely produced visible absorbance. It is reasonable to speculate that Gly promotes the formation of HA-Gly BrC mixtures. The experimental results are consistent with previous measurements reported by Powelson et al. BrCs from HA-Gly-AS and HA-Gly exhibit stronger fluorescence between 300 and 400 nm. Glycine plays a more important role in the formation of aqueous BrC than that of AS. Furthermore, we examined the mass absorption coefficient (MAC) by photolysis of aqueous BrCs, which resulted from the oxidation of HA-Gly and HA-Gly-AS mixtures by 5 mM H2O2. An effective photolysis time induced significant changes near-UV (300–400 nm) absorption intensity of HA-Gly and HA-Gly-AS mixtures. These results emphasize the dynamic nature of the corresponding atmospheric aqueous BrC. Overall, our study provides the optical properties of the corresponding atmospheric aqueous BrC and the H2O2 oxidation photolysis process of the as-obtained BrC in detail, which may contribute to the understanding of the important effects of aqueous BrC for atmospheric chemistry and climate.
Introduction
Atmospheric aerosols play a key role in modulating the Earth's radiative balance, particularly positive radiative forcing (warming) and the average surface temperatures on both global and local scales by direct and indirect mechanisms.2–4 They have also been linked to a significant adverse impact on public health, particularly in the occupational environmental effects by airborne dispersal and transport.5–7 Atmospheric “brown carbon” (BrC), as a collective term for light absorbing but poorly characterized organic compounds in the atmosphere, is an important contributor to light absorption and climate forcing.8–10 As a category of condensed-phase organic carbonaceous compounds that are present in atmospheric aerosol from both anthropogenic and natural sources, BrC can absorb solar radiation in the blue visible region and near ultraviolet region with strong wavelength dependency; the light absorption of this type of absorbent organic matter in the ultraviolet band increases as the wavelength becomes shorter.11–14 The sources and compositions of BrC are very complex, and we can generalize the source into two major categories: important primary emissions from biomass burning and the incomplete combustion discharge of biofuels. In addition, there is secondary emission from secondary organic aerosols (SOA) formed from atmospheric secondary transformation and aging of atmospheric particulate matter from fresh or secondary conversion.15–17 However, emission reductions are possible only when the sources, optical properties and chemical compositions are identified.1 In polluted areas, many organic carbonaceous compounds that are routinely found in clouds and aerosol have the potential to form fluorescent and absorbent BrC products.18Fluorescence spectroscopy that can detect and record emission spectra in real time is a rapid and sensitive technique for quantitative and qualitative analysis of BrC.19–21 Fluorescent particles must contain significant amounts of organic compounds with large absorption coefficients and fluorescence quantum yields.22 The small, water-soluble carbonyl compound hydroxyacetone (HA) can undergo browning (Maillard) reactions in the presence of ammonium salts or amino acids such as Gly.23–32 Comparable to (or slightly longer than) the average lifetime of aerosol particles in the troposphere, the maximum reaction time of the aqueous BrC solutions used in the research is up to 19 days.33
In the present study, aqueous BrC aerosols were formed through the aqueous reactions of hydroxyacetone (HA) with nitrogen compounds such as glycine (Gly) and/or ammonium sulfate (AS). We provide further evidence for the formation of BrC using the related parameters of excitation-emission matrix (EEM) fluorescence spectra, fluorescence emission spectra and absorption spectra, such as wavelength-independent fluorescence quantum yield (QY), Stokes shift, wavelength-dependent MAC, and absorption Angstrom exponent (AAE). We preliminarily identified the formation process of BrCs from HA-Gly-AS and HA-Gly mixtures. Furthermore, we studied a series of photochemical processes of the as-obtained BrC after H2O2 oxidation photolysis at the laboratory scale.
Experimental section
Aqueous stock solutions were prepared in deionized water using ammonium sulfate (>99.0%, Beijing Chemical Works), glycine (>99.0%, Tianjin Guangfu Fine Chemical Research Institute) and hydroxyacetone (90%, Aladdin Industrial Corporation). BrC stock solution from HA-Gly mixtures was prepared by mixing 15 mL of glycine (0.6 M), 15 mL of hydroxyacetone (0.6 M), and 15 mL of ultrapure water. The final concentrations in the stock solution were ~0.2 M for glycine and ~0.2 M for hydroxyacetone. BrC stock solution from HA-AS mixtures was prepared by mixing 15 mL of ammonium sulfate (0.6 M), 15 mL of hydroxyacetone (0.6 M), and 15 mL of ultrapure water. BrC stock solution from HA-Gly-AS mixtures was prepared by mixing 15 mL of ammonium sulfate (0.6 M), 15 mL of hydroxyacetone (0.6 M), and 15 mL of glycine (0.6 M). BrC stock solutions were prepared using a method similar to that developed previously in order to simulate atmospheric aerosol conditions, which are known to be inset in these systems previously.34A U-3900 UV/Vis spectrophotometer (Hitachi, Japan) at a scan rate of 300 nm min−1 was employed to record changes in absorbance between 300–480 nm in a 1 cm-quartz cell. A reference absorption spectrum using deionized water as the background was determined in the same quartz cell. An F-97 fluorescence spectrometer (Pgeneral, Shanghai, China) was used in EEM mode (0.01 s response, high sensitivity, 600 nm min−1 emission scan speed, 10 nm data pitch) to map the development of fluorescence over the entire range of excitation (λex) and emission wavelengths (λem) (typically 280–450 nm) with the limit λem = (λex + 20 nm) to avoid the Rayleigh and Raman scattering signal. In brief, for the EEM spectra, the excitation wavelength varied over the 290–450 nm range in 10 nm steps, and the emitted fluorescence strength was recorded over the 310–600 nm range in 1 nm steps. In H2O2 oxidation photolysis of BrC solutions, 1.49 mL 0.20 M BrC stock solution and 0.01 mL 0.75 M hydrogen peroxide (30%, Wuxi City Yasheng Chemical CO., LTD) were mixed thoroughly, and the solutions were placed in a 1 cm quartz cuvette for 254 nm illumination (Ultraviolet Analyzer) and absorption measurements. FTIR measurements were carried out using a Thermo Scientific Nicolet is 10 spectrometer. Samples were analyzed at ambient temperature with a scan range of 400–4000 cm−1, at a resolution of 0.4 cm−1.
Results and discussion
UV/Vis light absorption
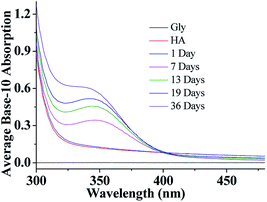
After a selected reaction period (1–19 days), UV/Vis absorption measurements of the aqueous HA-Gly mixtures were carried out over the wavelength range of 300–480 nm as a function of reaction time using a U-3900 UV/Vis spectrophotometer (Fig. 1). The base-10 absorption coefficient α of the BrC solutions was calculated by dividing the base-10 absorption strength by the quartz cell path length, αSOA(λ) = A(λ)/l.22 The background was determined by measuring the absorption of deionized water.As shown in Fig. 1, compared to Gly and HA, the absorption of aqueous HA-Gly mixtures significantly enhanced with reaction time in the blue visible and near ultraviolet regions. It should be noted that absorption at longer wavelengths (>480 nm) also increases with reaction time (36 days), but the absolute changes are too small to visualize. The spectral data show that the mixtures of HA-Gly display broad absorption bands peaking near 350 nm.
A power law was used to describe the absorption Angstrom exponent (AAE) of BrC:
 | (1) |
| Solution | α (350 nm) cm−1 | Iarea | QY% | AAE 400–480 nm | FI | BIX | |
|---|---|---|---|---|---|---|---|
| QS (5.8 × 10⁻⁷ M) | 0.00603 | 12![[thin space (1/6-em)]](https://www.rsc.org/images/entities/char_2009.gif) 269.4 269.4 |
51 | — | — | — | |
| HA-Gly (7 days) | 0.34 | 20![[thin space (1/6-em)]](https://www.rsc.org/images/entities/char_2009.gif) 389.6 389.6 |
1.50 | 4.29 | 2.11 | 0.75 | |
| HA-Gly (13 days) | 0.45 | 22![[thin space (1/6-em)]](https://www.rsc.org/images/entities/char_2009.gif) 083.9 083.9 |
1.23 | 5.13 | 2.13 | 0.70 | |
| HA-Gly (19 days) | 0.50 | 22![[thin space (1/6-em)]](https://www.rsc.org/images/entities/char_2009.gif) 392.0 392.0 |
1.12 | 4.88 | 2.13 | 0.72 | |
| HA-Gly (36 days), before photolysis | 0.56 | 23![[thin space (1/6-em)]](https://www.rsc.org/images/entities/char_2009.gif) 239.1 239.1 |
2.04 | 7.60 | 2.12 | 0.68 | |
| HA-Gly (36 days), after photolysis | 0.11 | 11![[thin space (1/6-em)]](https://www.rsc.org/images/entities/char_2009.gif) 049.2 049.2 |
2.52 | 5.18 | 2.19 | 0.82 | |
Similarly, compared to HA-Gly mixtures, the absorption of aqueous HA-Gly-AS mixtures was also significantly enhanced with reaction time in the blue visible and near ultraviolet regions (Fig. 1S(a)†). The AAE for the HA-Gly-AS mixtures studied herein range from 9 to 14 (Table S1†) for the visible wavelength range of 400–480 nm. Hence, the HA-Gly mixtures also can be regarded as an example of a moderately-absorbing type of BrC. However, for the HA-AS mixtures, absorption enhancement can barely be observed over the entire spectral range with reaction time, as shown in Fig. S1(b).† Above all, we can conclude that the HA-AS mixtures cannot be considered as a type of BrC.
Excitation-emission spectra and effective quantum yield
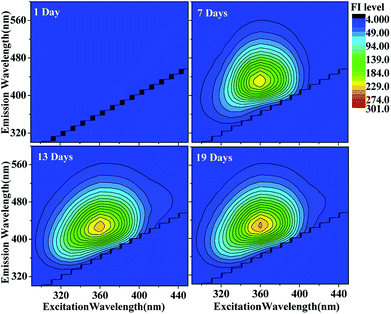 | ||
| Fig. 2 EEM plots of HA-Gly mixtures as a function of reaction time. The fluorescence intensity (FI level, color coded as shown on the right) increased somewhat as a function of reaction time. | ||
The EEM intensities at different excitation and emission wavelengths can be used as indicators of the type and source of the dissolved organic matter such as terrestrially derived fulvic acids and fulvic acids of microbial origin in fog water.22,41 The following indicators determined: fluorescence index (FI) was calculated using the ratio of emission intensities at 450 nm and 500 nm following 370 nm excitation,39 and the index of recent autochthonous (i.e., produced by the original source of dissolved organic matter as opposed to externally produced22) contribution (BIX) was calculated using the ratio of emission intensities at 380 and 430 nm following 310 nm excitation.40 Table 1 lists both indices calculated for the HA-Gly mixtures probed in this study. In general, FI values of approximately 1.4 are observed for terrestrially derived fulvic acids, while FI values of approximately 1.9 corresponds to fulvic acids of microbial origin.41 BIX values of approximately 0.6 corresponds to dissolved organic matter with low autochthonous component, while BIX > 1 is observed for dissolved organic matter of biological origin.22,42 In our study, the observed FI values of the HA-Gly mixtures is 2.1 (Table 1), which is close to 1.9 according to the definition of FI. Hence, the HA-Gly mixtures probably correspond to fulvic acids of microbial origin. The BIX values for the HA-Gly mixtures are on average 0.7 (Table 1), which is close to 0.6 and consistent with a low autochthonous component. In other words, the reaction might have been generated from biological origin fulvic acids of microbial origin but the concentration is very low.42 Similarly, we calculated the FI value of 2.1 and BIX value of 0.6 (Table S1†) for the HA-Gly-AS mixtures, which were also similar to that of the HA-Gly mixtures.
The corresponding integral area between 362 and 600 nm calculated from the linear fit in Fig. S8(b)† is 12![[thin space (1/6-em)]](https://www.rsc.org/images/entities/char_2009.gif) 269.4 using 5.8 × 10⁻⁷ M QS solutions. The QY values of the BrC solutions in three different time periods were calculated at 350 nm. excitation wavelength by comparing the measured fluorescence emission intensities from the EEM plots integrated over the emission wavelengths (I) and the base-10 absorption coefficients (α):22
269.4 using 5.8 × 10⁻⁷ M QS solutions. The QY values of the BrC solutions in three different time periods were calculated at 350 nm. excitation wavelength by comparing the measured fluorescence emission intensities from the EEM plots integrated over the emission wavelengths (I) and the base-10 absorption coefficients (α):22
 | (2) |
The resulting QY values of the HA-Gly mixtures are summarized in Table 1. Fig. 1 demonstrates that the absorption coefficients of the HA-Gly mixtures increase significantly in different time periods. However, the effective fluorescence QY values decrease slightly from 1.50% to 1.12%, and they have a same order of magnitude (~0.01). Meanwhile, the effective fluorescence QY values of the HA-Gly-AS mixtures were also calculated, and they are in the range of 2.56–1.57% (Table S1†), which are higher than that of HA-Gly mixtures. These results probably illustrate that Gly are more important in BrC formation than AS, and Gly may have positively contributed to the formation of BrC.
H2O2 oxidation photolysis of BrC solutions
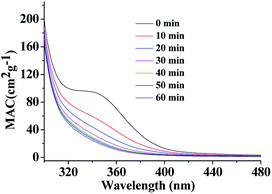 | ||
| Fig. 3 UV/Vis absorption spectra recorded during photolysis of HA-Gly mixtures in the 300–480 nm range. The vertical axis corresponds to the mass absorption coefficient (MAC) calculated from eqn (3). | ||
UV/Vis absorption spectra were recorded using a UV-Vis spectrometer with pure solvent as a reference. The extent of HA-Gly mixtures browning was quantified in terms of the effective mass absorption coefficient (MAC) of the organic material. Wavelength-dependent MAC (cm2 g−1) can be directly calculated from the base-10 absorbance, A10, of the HA-Gly mixtures with known mass concentration, Cmass (g cm−3), and path length, b (cm).35
 | (3) |
The MAC spectra of HA-Gly mixtures before and after H2O2 oxidation taken at different photolysis times are shown in Fig. 3. The shapes of the spectra agree with the characteristics of a typical atmospheric BrC material.45 The absorption coefficient is the highest in the near-UV range, and there is a tail in the visible range. In contrast, the H2O2 oxidation photolysis experiments of HA-Gly-AS mixtures were conducted (Fig. S3†). The experimental results are similar to that of HA-Gly mixtures.
The effective rate constant k, considering the first-order kinetic process, is commonly used to approximate the MAC decay.36
 | (4) |
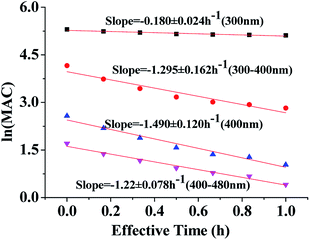
Fig. 4 shows the dependence of the average MAC of HA-Gly solutions at 300 nm, in the near-UV regions (300–400 nm), at 400 nm, and in the near-visible regions (400–480 nm), on the effective H2O2 oxidation photolysis time. The effective rate constant k followed the order 400 nm (k = 1.490 h−1) > the near-UV range (k = 1.295 h−1) > the visible range (k = 1.218 h−1) > 300 nm (k = 0.180 h−1).
These effective k values can be converted into empirical half-lives, τ = ln(2)/k36 which are listed in Table 2. We also include data on photodegradation of HA-Gly mixtures produced by the reaction of H2O2 oxidation. The distinctive peak at approximately 340 nm almost completely disappears after 1.0 h of photolysis, and the brown color of the solutions became shallow in the process. Fig. S4† shows the dependence of the average MAC of HA-Gly-AS mixtures on the effective H2O2 oxidation photolysis time. The effective rate constant k followed the order 400 nm (k = 1.54 h−1) > the visible range (k = 1.364 h−1) > the near-UV range (k = 1.242 h−1) > 300 nm (k = 0.226 h−1).
| Wavelength (nm) | 300 | Near-UV | 400 | Visible |
|---|---|---|---|---|
| k | 0.180 | 1.295 | 1.490 | 1.218 |
| τ | 3.851 | 0.535 | 0.465 | 0.569 |
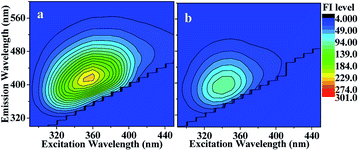 | ||
| Fig. 5 EEM spectrum recorded (a) before and (b) after photolysis of HA-Gly mixtures. After 60 min of photolysis, the fluorescence intensity (FI level, color coded as shown on the right) decreased somewhat (meanwhile the solution absorbance decreased, as shown Fig. 4). | ||
Conclusion and discussion
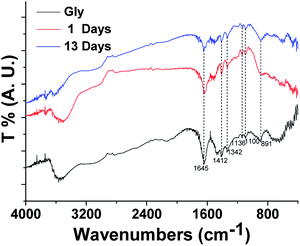
The reacted solution shows a pronounced brownish discoloration that increases with reaction time and the measured UV/Vis absorption of HA-Gly and HA-Gly-AS mixtures are significantly enhanced in the 300–480 nm spectral range due to the formation of organic chromophores in the reaction. The results suggest that AS and Gly mixtures are more effective than only Gly on forming BrC via reactions with small aqueous carbonyl compound (HA) at room temperature.51 It is notable that the optical properties of HA-Gly and HA-Gly-AS mixtures should be dynamically changing. Moreover, our study provides fundamental information on the behavior of aqueous BrC by H2O2 oxidation of HA-Gly and HA-Gly-AS mixtures during photolysis processing.Reactions between HA and Gly undergo rapid photobleaching via H2O2 oxidation photolysis. Light-absorbing compounds, which lose their ability to absorb the near-UV range radiation responsible for the slight browning color of BrC, can potentially rapidly photobleach during H2O2 oxidation photolysis. This indicates that the concentrations of aqueous BrC species will be higher during the night than in the daytime. In addition to the wavelength-dependent MAC values, more optical properties of two BrC samples were quantified in our study, namely, the effective rate k and the estimated effective half-life τ under typical atmospheric conditions. Aqueous BrC normally contain complex organic components; however, our measurements of the FTIR spectral properties show that Gly/Gly-AS and relevant aqueous BrCs have very similar size distributions. This is consistent with the previous conclusion that the reaction might have been generated from organic components, but the concentration is very low. Overall, our study provides the optical properties of the corresponding atmospheric aqueous BrC and the H2O2 oxidation photolysis process of the as-obtained BrC in detail, which may contribute to the understanding of the important effect of aqueous BrC on atmospheric chemistry and climate.
Conflicts of interest
There are no conflicts to declare.Acknowledgements
This study was financially supported by the National Natural Science Foundation of China (91544223, 41175119, 21473009 and 21373026).Notes and references
- M. H. Powelson, B. M. Espelien, L. N. Hawkins and M. M. Galloway, Environ. Sci. Technol., 2014, 48, 985–993 CrossRef PubMed.
- V. Ramanathan and G. Carmichael, Nat. Geosci., 2008, 1, 221–227 CrossRef.
- S. Q. D. Solomon, M. Manning, Z. Chen, M. Marquis, K. Averyt, M. Tignor and H. L. Miller, Contribution of Working Group 1 to the Fourth Assessment Report of the Intergovernmental Panel on Climate Change, New York, 2007 Search PubMed.
- S. Solomon, D. Qin, M. Manning, Z. Chen, M. Marquis, K. B. Averyt, M. Tignor and H. L. Miller, Contribution of Working Group 1 to the Fourth Assessment Report of the Intergovernmental Panel on Climate Change, Cambridge University Press, Cambridge, UK and New York, USA, p. 996 Search PubMed.
- D. W. Dockery, C. A. Pope, X. Xu, J. D. Spengler, J. H. Ware, M. E. Fay, B. G. Ferris and F. E. Speizer, N. Engl. J. Med., 1993, 329, 1753–1759 CrossRef PubMed.
- M. J. Perri, S. Seitzinger and B. J. Turpin, Atmos. Environ., 2009, 43, 1487–1497 CrossRef.
- U. Poschl, Angew. Chem., Int. Ed., 2005, 44, 7520–7540 CrossRef PubMed.
- M. O. Andreae and A. Gelencser, Atmos. Chem. Phys., 2006, 6, 3131–3148 CrossRef.
- T. Moise, J. M. Flores and Y. Rudich, Chem. Rev., 2015, 115, 4400–4439 CrossRef PubMed.
- A. Laskin, J. Laskin and S. A. Nizkorodov, Chem. Rev., 2015, 115, 4335–4382 CrossRef PubMed.
- E. R. Graber and Y. Rudich, Atmos. Chem. Phys., 2006, 6, 729–753 CrossRef.
- T. C. Bond, M. Bussemer, B. Wehner, S. Keller, R. J. Charlson and J. Heintzenberg, Environ. Sci. Technol., 1999, 33, 3887–3891 CrossRef.
- R. W. Bergstrom, P. Pilewskie, P. B. Russell, J. Redemann, T. C. Bond, P. K. Quinn and B. Sierau, Atmos. Chem. Phys. Discuss., 2007, 7, 10669–10686 CrossRef.
- M. Yang, S. G. Howell, J. Zhuang and B. J. Huebert, Atmos. Chem. Phys., 2009, 9, 2035–2050 CrossRef.
- R. K. Chakrabarty, H. Moosmuller, L. W. A. Chen, K. Lewis, W. P. Arnott, C. Mazzoleni, M. K. Dubey, C. E. Wold, W. M. Hao and S. M. Kreidenweis, Atmos. Chem. Phys., 2010, 10, 6363–6370 CrossRef.
- E. L. Shapiro, J. Szprengiel, N. Sareen, C. N. Jen, M. R. Giordano and V. F. McNeill, Atmos. Chem. Phys., 2009, 9, 2289–2300 Search PubMed.
- Y. Cheng, K. B. He, M. Zheng, F. K. Duan, Z. Y. Du, Y. L. Ma, J. H. Tan, F. M. Yang, J. M. Liu, X. L. Zhang, R. J. Weber, M. H. Bergin and A. G. Russell, Atmos. Chem. Phys., 2011, 11, 11497–11510 Search PubMed.
- J. L. Chang and J. E. Thompson, Atmos. Environ., 2010, 44, 541–551 CrossRef.
- S. C. Hill, R. G. Pinnick, S. Niles, Y. L. Pan, S. Holler, R. K. Chang, J. Bottiger, B. T. Chen, C. S. Orr and G. Feather, Anal. Chem. Technol., 1999, 3, 221–239 CrossRef.
- M. S. Ammor, J. Fluoresc., 2007, 17, 455–459 CrossRef PubMed.
- V. Agranovski, Z. Ristovski, M. Hargreaves, P. J. Blackall and L. Morawska, J. Aerosol Sci., 2003, 34, 301–317 CrossRef.
- H. J. Lee, A. Laskin, J. Laskin and S. A. Nizkorodov, Environ. Sci. Technol., 2013, 47, 5763–5770 CrossRef PubMed.
- B. Noziere, P. Dziedzic and A. Cordova, Geophys. Res. Lett., 2007, 34, L21812 CrossRef.
- B. Noziere, P. Dziedzic and A. Cordova, J. Phys. Chem. A, 2009, 113, 231–237 CrossRef PubMed.
- E. L. Shapiro, J. Szprengiel, N. Sareen, C. N. Jen, M. R. Giordano and V. F. McNeill, Atmos. Chem. Phys., 2009, 9, 2289–2300 Search PubMed.
- N. Sareen, A. N. Schwier, E. L. Shapiro, D. Mitroo and V. F. McNeill, Atmos. Chem. Phys., 2010, 10, 997–1016 Search PubMed.
- T. B. Nguyen, P. B. Lee, K. M. Updyke, D. L. Bones, J. Laskin, A. Laskin and S. A. Nizkorodov, J. Geophys. Res., 2012, 117, D01207 Search PubMed.
- J. L. Woo, D. D. Kim, A. N. Schwier, R. Li and V. F. McNeill, Faraday Discuss., 2013, 165, 357–367 RSC.
- B. Noziere and A. Cordova, J. Phys. Chem., 2008, 112, 2827–2837 CrossRef PubMed.
- D. O. De Haan, A. L. Corrigan, K. W. Smith, D. R. Stroik, J. T. Turley, F. E. Lee, M. A. Tolbert, J. L. Jimenez, K. E. Cordova and G. R. Ferrell, Environ. Sci. Technol., 2009, 43, 2818–2824 CrossRef PubMed.
- D. O. De Haan, L. N. Hawkins, J. A. Kononenko, J. J. Turley, A. L. Corrigan, M. A. Tolbert and J. L. Jimenez, Environ. Sci. Technol., 2011, 45, 984–991 CrossRef PubMed.
- N. Sedehi, H. Takano, V. A. Blasic, K. A. Sullivan and D. O. De Haan, Atmos. Environ., 2013, 77, 656–663 CrossRef.
- M. Tang, J. M. Alexander, D. Kwon, A. D. Estillore, O. Laskina, M. A. Young, P. D. Kleiber and V. H. Grassian, J. Phys. Chem., 2016, 120, 4155–4166 CrossRef PubMed.
- N. Sareen, A. N. Schwier, E. L. Shapiro, D. Mitroo and V. F. McNeill, Atmos. Chem. Phys., 2010, 10, 997–1016 Search PubMed.
- Y. Chen and T. C. Bond, Atmos. Chem. Phys., 2010, 10, 1773–1787 CrossRef.
- H. J. Lee, P. K. Aiona, A. Laskin, J. Laskin and S. A. Nizkorodov, Environ. Sci. Technol., 2014, 48, 10217–10226 CrossRef PubMed.
- N. Hudson, A. Baker and D. Reynolds, River Res. Appl., 2007, 23, 631–649 CrossRef.
- R. M. B. O. Duarte, C. A. Pio and A. C. Duarte, J. Atmos. Chem., 2004, 48, 157–171 CrossRef.
- D. M. McKnight, E. W. Boyer, P. K. Westerhoff, P. T. Doran, T. Kulbe and D. T. Andersen, Limnol. Oceanogr., 2001, 46, 38–48 CrossRef.
- J. E. Birdwell and K. T. Valsaraj, Atmos. Environ., 2010, 44, 3246–3253 CrossRef.
- A. Zsolnay, E. Baigar, M. Jimenez, B. Steinweg and F. Saccomandi, Chemosphere, 1999, 38, 45–50 CrossRef PubMed.
- A. Huguet, L. Vacher, S. Relexans, S. Saubusse, J. M. Froidefond and E. Parlanti, Org. Geochem., 2009, 40, 706–719 CrossRef.
- R. G. Zepp, W. M. Sheldon and M. A. Moran, Mar. Chem., 2004, 89, 15–36 CrossRef.
- R. G. Zepp, G. L. Baughman and P. F. Schlotzhauer, Chemosphere, 1981, 10, 119–126 CrossRef.
- H. Sun, L. Biedermann and T. C. Bond, Geophys. Res. Lett., 2007, 34, L17813 CrossRef.
- Z. H. Liu, M. M. Zhang and Y. C. Zhao, J. Baoji College Arts Sci. Nat. Sci., 1994, 02, 101–104 Search PubMed.
- Y. H. Yu and S. Liu, Chemistry, 2006, 04, 282–286 Search PubMed.
- P. K. Hudson, E. R. Gibson, M. A. Young, P. D. Kleiber and V. H. Grassian, Aerosol Sci. Technol., 2007, 41, 701–710 CrossRef.
- M. E. Earle, R. G. Pancescu, B. Cosic, A. Y. Zasetsky and J. J. Sloan, J. Phys. Chem., 2006, 110, 13022–13028 CrossRef PubMed.
- D. D. Weis and G. E. Ewing, J. Geophys. Res., 1996, 101, 18709–18720 CrossRef.
- M. Trainic, A. A. Riziq, A. Lavi and Y. Rudich, J. Phys. Chem., 2012, 116, 5948–5957 CrossRef PubMed.
Footnote |
| † Electronic supplementary information (ESI) available. See DOI: 10.1039/c8ra02019a |
| This journal is © The Royal Society of Chemistry 2018 |

