
 Open Access Article
 This Open Access Article is licensed under a Creative Commons Attribution-Non Commercial 3.0 Unported Licence
Energy generation through bioelectrochemical degradation of pentachlorophenol in microbial fuel cell†
Nishat Khana,
M. Danish Khana,
Abdul-Sattar Nizami *b,
Mohammad Rehanb,
Azfar Shaidac,
Anees Ahmada and
Mohammad Z. Khan*a
*b,
Mohammad Rehanb,
Azfar Shaidac,
Anees Ahmada and
Mohammad Z. Khan*a
aEnvironmental Research Laboratory, Department of Chemistry, Aligarh Muslim University, Aligarh 202 002, UP, India. E-mail: dr_mzain.fa@amu.ac.in
bCenter of Excellence in Environmental Studies (CEES), King Abdulaziz University, Jeddah, Saudi Arabia. E-mail: nizami_pk@yahoo.com
cDepartment of Chemistry, Indian Institute of Technology, Roorkee 247667, Uttarakhand, India
First published on 6th June 2018
Abstract
Bio-electrochemical degradation of pentachlorophenol was carried out in single as well as dual chambered microbial fuel cell (MFC) with simultaneous production of electricity. The maximum cell potential was recorded to be 787 and 1021 mV in single and dual chambered systems respectively. The results presented nearly 66 and 89% COD removal in single and dual chambered systems with corresponding power densities of 872.7 and 1468.85 mW m−2 respectively. The highest coulombic efficiency for single and dual chambered counterparts was found to be 33.9% and 58.55%. GC-MS data revealed that pentachlorophenol was more effectively degraded under aerobic conditions in dual-chambered MFC. Real-time polymerase chain reaction showed the dominance of exoelectrogenic Geobacter in the two reactor systems with a slightly higher concentration in the dual-chambered system. The findings of this work suggested that the aerobic treatment of pentachlorophenol in cathodic compartment of dual chambered MFC is better than its anaerobic treatment in single chambered MFC in terms of chemical oxygen demand (COD) removal and output power density.
1. Introduction
Chlorophenols (CPs) are a group of weakly acidic organic compounds which are used in herbicides, fungicides, pesticides, and disinfectants.1,2 Pentachlorophenol (PCP), the most toxic of all the CPs, is used as a pesticide and wood preservative in the industries.3 The United States Environment Protection Agency (USEPA) considers PCP as a probable carcinogen with severe health hazards.4 In recent years, the dechlorination of PCP has gained significant attention, and various technologies have been developed to treat PCP, including zero-valent metal based degradation,5 biological methods like biosorption and bioremediation,6 enzyme-catalyzed oxidation,7,8 photocatalytic degradation,9 and electrochemical processes.10 The sorption methods have the disadvantage of only transferring PCP from waste to adsorbent without its actual treatment. Similarly, the conventional techniques available to treat waste electrochemically are highly energy intensive.1,11 Moreover, some bacteria can degrade PCP, but these biological methods result in excessive sludge production.12 However, a combination of the two techniques for electrochemical bioremediation of wastewater can serve the better purpose and has been considered as a promising alternative for the treatment of PCP and other toxic organics along with energy generation.13–15Today, the modern world is dependent mainly on the electrical energy for most of its functioning, and yet the primary sources of this energy are fossil fuels.16 The contribution of fossil fuels to the total global electricity demand in the year 2014 was 66% with the share of renewable sources limited to only 11%.17 Therefore, with the inevitable crisis of fossil fuel exhaustion and deteriorating environmental conditions, there is an urgent need to shift the focus of energy supply for wastewater treatment from non-renewable to renewable sources.18,19 Recently, the microbial fuel cell (MFC) has emerged as an efficient technology for the treatment of wide range of pollutants with a very little expenditure of external energy.20,21 One of the most promising advantages is that energy recovered from MFC as a by-product can offset the treatment cost if the technology is properly scaled up.
A MFC converts the stored chemical energy in organic compounds into electrical energy by using microorganisms.15,22 MFC function on the principle of simultaneous reduction and oxidation where substrate in the anodic chamber is oxidized to release electrons. An electron acceptor consumes these released electrons in the cathodic chamber separated from the anodic chamber by a membrane.23,24 The flow of electrons from the anode to the cathode in the process generates electric current.20 This whole process is catalyzed by microorganisms that use part of the substrate for their growth while converting the other part into energy.22 The reaction is complicated, and the performance of MFC is influenced by several factors including pH, conductivity, temperature, types of the substrates and electron losses.25,26
Some studies have presented the treatment of PCP bio-electrochemically using MFCs, but the reports are limited to the lower concentrations of PCP (usually up to 50 ppm) with correspondingly lower power densities (PD).12,27 Moreover, the degradation of PCP with simultaneous electricity production in single and dual chambered microbial fuel cell (SCMFC and DCMFC) are rarely compared in the scientific literature which is the primary focus of this study. In addition, attempts have been made to link the output PD with the chemical oxygen demand (COD) of the synthetic wastewater containing PCP. The bio-electrochemical behavior of the system was studied using cyclic voltammetry (CV), and the performance evaluation was carried out by estimating the cell potential, PD, coulombic efficiency (CE) and the COD removal efficiency of the two MFC systems. GC-MS technique further examined the quality of the treated water and fate of PCP metabolites. The findings of this work on the bio-electrochemical degradation of PCP would help to design new strategies for large-scale wastewater treatment plants along with energy production.
2. Material and methods
2.1. MFC setup
The SCMFC, containing only a single anaerobic anodic compartment, was commissioned with air cathode separated by a proton exchange membrane (PEM) (Fig. 1a). The H-shaped DCMFC contained both the aerobic and anaerobic compartments, wherein anodic and cathodic chambers were connected through a PEM (Fig. 1b). Graphite rods of 8 mm in diameter and 56 mm long were used as electrodes, whereas Nafion-117 was used as a PEM in both the reactor systems.28 The Nafion membrane was pre-treated in accordance with the method given by Liu and Logan.29 Electrodes were abraded with sandpaper for better biofilm formation.14 The volumes of all the chambers were 70 mL each. The electrodes were connected via a copper wire using an external load of 470 Ω.30 The experimental setup was kept in a separate temperature controlled room at 30 ± 5 °C to avoid exposure to direct light and stirred periodically to mix the sludge properly. A control reactor with only glucose (no PCP) was also operated during the course of the study.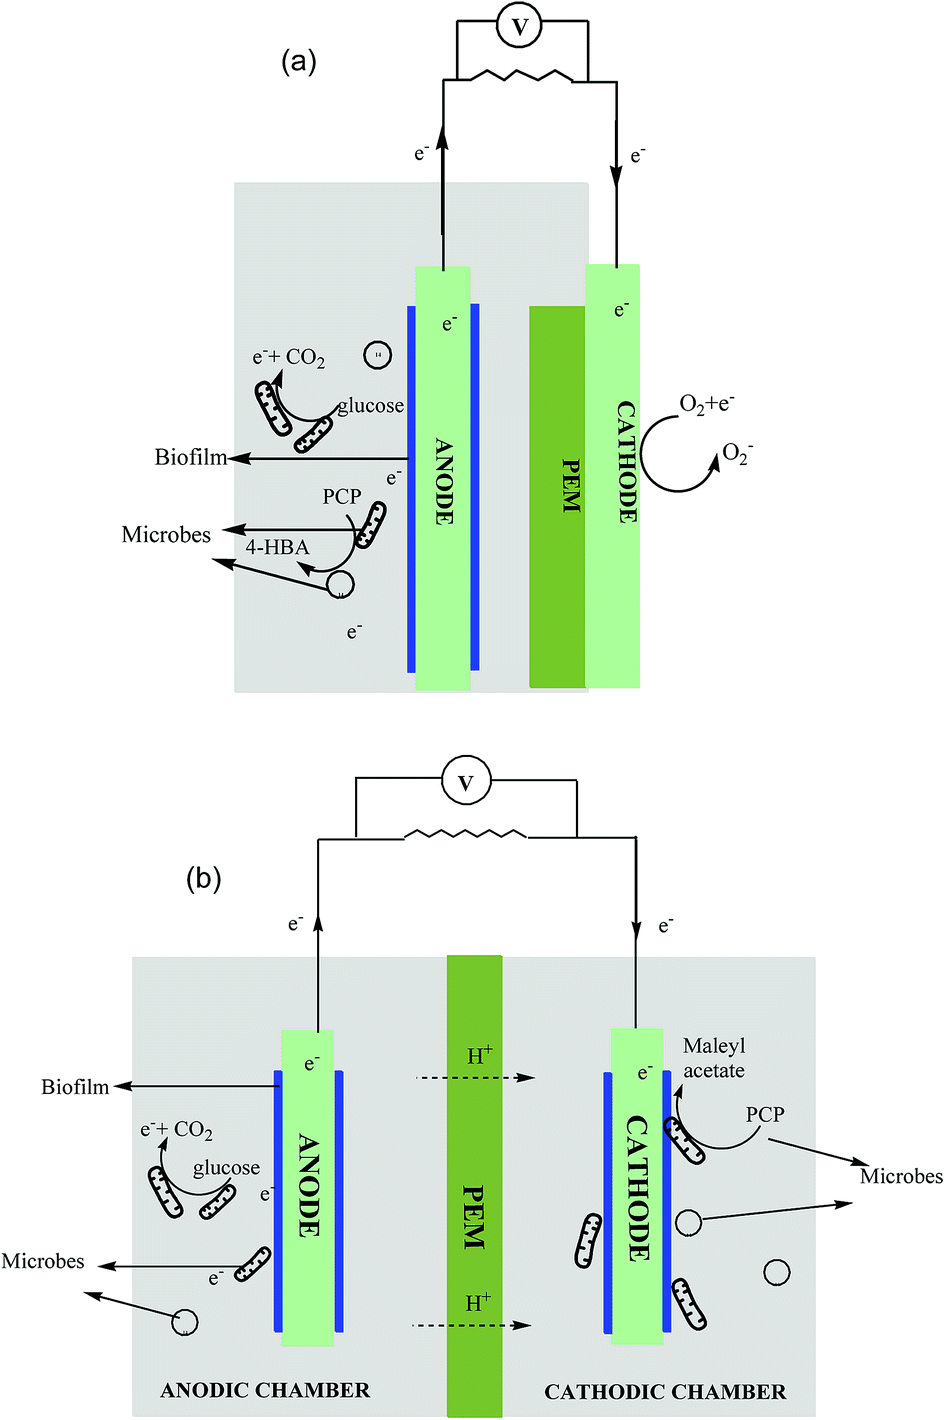 | ||
| Fig. 1 Schematic diagram of (a) SCMFC – single chambered MFC and (b) DCMFC – dual chambered MFC. | ||
2.2. Inoculation and operation
SCMFC was inoculated with acclimated anaerobic culture and fed with PCP as co-metabolite in mineral salt media and glucose was added as co-substrate to augment microbial growth. Conversely, in the case of DCMFC, the anodic chamber was inoculated using anaerobic acclimated sludge and fed with only glucose to support the growth of microorganisms while PCP was added to the aerobically acclimated sludge in the cathodic compartment. The sludge containing mixed microbial culture was collected from Okhla sewage treatment plant, New Delhi, India. The composition of the mineral salt media was as follows: NH4Cl 0.85 g L−1, K2HPO4 0.234 g L−1, KH2PO4 0.136 g L−1, FeCl3 0.05 g L−1, MgCl2·6H2O 0.084 g L−1 and yeast extract 0.34 g L−1.31 A slightly basic pH was maintained initially by adding 0.1 M phosphate buffer (NaH2PO4·H2O, Na2HPO4 pH 7.2).32 The aerobic and anaerobic sludge were acclimated for a period of 30 days. Once the stable voltage was obtained, the PCP concentration was changed to the experimental concentration of 50 ppm, and the circuit was closed using an external resistance of 470 Ω. The PCP concentration was step wise increased from 50 to 500 ppm (50 → 100 → 200 → 400 → 500 ppm) during the study. The concentration of glucose was kept constant at 1 g L−1 (equivalent to 1050 mg L−1 COD) during the course of study. Each concentration was examined for a period of 10 days and samples were collected periodically for various analyses.2.3. Analytical methods and analysis
The voltage output across the external load was recorded by a digital millimeter (Kehao KH 200, China). PD was calculated using following relations
 | (1) |
 | (2) |
![[thin space (1/6-em)]](https://www.rsc.org/images/entities/char_2009.gif) 500 C), I is current, t is time, b is the number of electrons transferred per mole of COD, Van is the volume of anodic chamber and ΔCOD is the change in COD over test duration.
500 C), I is current, t is time, b is the number of electrons transferred per mole of COD, Van is the volume of anodic chamber and ΔCOD is the change in COD over test duration.
Standard pH and conductivity meters, Khera Scientific Instruments, India, were used to measure the pH and conductivity. The microbial cell growth was measured in term of optical density by monitoring the absorbance at 600 nm by UV-Visible spectrophotometer (Perkin Elmer Lambda 25, USA). The COD was determined according to the Standard Method (APHA 2002) while the concentration of chloride ions (formed during dehalogenation of the PCP) was determined in line with the Indian Standard.33 The samples collected from the reactors were centrifuged and scanned using wavelength range 200–700 nm in a UV-Visible spectrophotometer to determine the residual concentration of PCP (Perkin Elmer Lambda 25, USA). All experiments were performed in duplicate in the temperature range of 30 ± 5 °C.
Scanning electron microscopy (SEM) coupled with electron dispersive X-ray (EDX) was employed to study the surface morphologies and elemental compositions of sludge obtained from both studied MFC systems. Prior to SEM analysis, the samples were prepared by washing in phosphate buffer with pH 7.2 and fixing with 2% glutaraldehyde solution overnight. The samples were then washed using 10, 30, 50, 70, 90 and 100% ethanol solution and dried for 2 days.26
The redox reaction occurring at the surface of the electrodes in the reactor systems was studied by using cyclic voltammogram (CV). The CV was drawn by measuring current over the specific potential range using a three-electrode CV system (Princeton Applied Research 263A, USA). For all three reactors (SCMFC, DCMFC and control reactor) the anode and cathode were considered as working and counter electrodes respectively. The reference electrode used was Ag/AgCl electrode saturated with KCl. A scan rate of 10 mV s−1 was used to study the electrochemical performance within the potential range of −0.4 to +1.0 V in accordance with Sultana et al.26
2.4. Molecular biology analysis
The real-time polymerase chain reaction (RTPCR), a powerful molecular biology technique, was employed to examine and quantify the diverse microbial mixed culture used in this study. The DNA was isolated from the initial anaerobic inocula, and final sludge received in the anodic compartment of both the reactor systems employing FAST DNA SPIN KIT from MP Biomedicals, USA as per the method of Ahammad et al.34Prior to RTPCR analysis, molecular grade water was used to dilute the DNA extracts to reduce the effect of possible PCR inhibitors present in it. Various DNA dilutions were tested and with the 1:10 diluted DNA sample, the inhibition free qPCR amplification was obtained. This DNA diluted sample was used for all qPCR analysis by a BioRad CFX C1000 (Hercules, CA, USA). The qPCR system was set to target 16S rRNA, SBR, and also methanogens. Each reaction mix was prepared in 10 μL quantity from template DNA (3 μL), each primer with a concentration of 10 pmol μL−1 (0.5 μL), nuclease-free water (1 μL) and qPCR reagent (5 μL) (SsoFast EvaGreen Supermix, BioRad, USA).
The following qPCR program was followed in accordance with Khan et al.:35
Eubacteria – The initial enzyme activation was carried out at 95 °C for 5 min, denaturing at 95 °C for 45 s, annealing conducted at 60.5 °C for 45 s and then extension step for 45 s at 72 °C. These reactions were continued for 39 cycles.
Methanomicrobiales (MMB) – The initial enzyme activation was carried out at 98 °C for 3 min, denaturing at 98 °C for 2 s, annealing, and extension for 45 s at 62 °C. These reactions were continued for 45 cycles.
Methanosarcinaceae (MSC) and Methanosaetaceae (MST) – The initial enzyme activation carried out at 98 °C for 3 min, denaturing at 98 °C for 2 s, annealing, and extension for 5 s at 60 °C. This reaction was continued for 45 cycles.
Methanobacteriales (MBT) and Methanococcales (MCC) – The initial enzyme activation carried out at 98 °C for 3 min, denaturing at 98 °C for 2 s, annealing, and extension for 5 s at 60 °C. This reaction was also continued for 45 cycles.
Geobacter – The initial denaturation carried out at 94 °C for 4 min followed by a touchdown program of 20 cycles at 94 °C for 30 s, 65 °C for 30 s (decreasing rate of 0.5 °C per cycle), 72 °C for 30 s. Further, a production program was followed that consisted of 15 cycles at 94 °C for 30 s, 55 °C for 30 s and 72 °C for 3 min.
Finally, sulphate-reducing bacteria (SRB) – the initial enzyme activation was carried out at 94 °C for 5 min, denaturing at 94 °C for 45 s, annealing and extension for 60 s at 59 °C and then extension step for 45 s at 72 °C. This reaction was continued for 39 cycles.
Similar sets of qPCR primers were used in the present study as described in our previous work.26
3. Results and discussion
3.1. Bioelectricity generation
The bioenergy recovered during the degradation of PCP in SCMFC, DCMFC, and control was monitored during the test period in terms of cell potential (mV), and the results are presented in Fig. 2. It was observed that the current production was low initially with the addition of PCP in both the MFC systems. This could be due to the fact that the biological system was not much stable to tolerate the toxic effects of higher concentrations of PCP. However, the sludge became more acclimated with time, and as a result, the current production has been increased. In the case of SCMFC, the potential was observed to reach its peak value of 787 mV at 200 ppm of PCP and showed a diminishing trend with a further increase in PCP concentration (Fig. 2a). Conversely, in DCMFC, the cell potential increased as the concentration was increased from 50 to 100 ppm reaching the peak value of 1021 mV and decreased with further increase in PCP concentration (Fig. 2b). This occurrence of peak voltage at 200 ppm in case of SCMFC (instead of 100 ppm) could be due to the longer time taken by microbes to build a sustainable biofilm and promote current production.36 However, as the concentration was further increased, voltage output dropped because of increased toxicity. Other researchers have reported similar trends of the current generation in the treatment of toxic compounds by MFC.3,30 The system was fed with glucose twice a week to support the microbial activity and growth. For a particular cycle, the concentration of added substrate was decreased with time, and as a result, the current was dropped to the minimum value due to substrate limitations. The peaks in the graph represent the fresh addition of glucose. The falling trend of current with the increasing concentration of PCP could be due to the toxic effect of PCP on the microbial community,15 which led to poor microbial activity and consequently decreased the production of current. This suggests that for continuous energy production, the substrate should be added at regular intervals to maintain the requisite feast to famine ratio. The maximum voltage output recorded for control (with only glucose) was 1076 mV. The lower output voltage recorded on the addition of PCP also suggests the inhibitory effect of PCP on microbes and ultimately the performance of MFC. | ||
| Fig. 2 Variation of cell potential over the test duration for (a) SCMFC and (b) DCMFC. | ||
3.2. Power density (PD), chemical oxygen demand (COD) removal and coulombic efficiency (CE)
The performance of the reactors was also assessed in terms of PD (mW m−2), COD removal (%), and CE (%). The energy recovered in the form of electricity was directly proportional to the amount of organic carbon which in turn is related to the COD removed from the system suggesting that the energy in MFC is produced at the expense of COD. The initial COD of the system containing 100 ppm of PCP and 1 g L−1 glucose was 1410 mg L−1, and the COD was dropped to 480 mg L−1 and 150 mg L−1 for SCMFC and DCMFC respectively during the course of 10 days of degradation. The COD removal efficiency was found to be highest for 100 ppm of PCP for both the reactor systems (65.9% for SCMFC and 89.6% for DCMFC). The PD, on the other hand, was highest (872.7 mW m−2) at 200 ppm for SCMFC. However, the PD for DCMFC was found to be highest at 100 ppm (1468.85 mW m−2). The peaks in PD curve correspond to fresh addition of glucose. The PD peaked every time the co-substrate was added to the medium. The highest PD recorded for control was 1631.36 mW m−2. The lower PD in the case of SCMFC could be due to alternate pathways like methanogenesis, which might have taken place and as a result, the electrons produced were lost and could not be recovered as energy output. Although the COD removal was maximum at 100 ppm in case of SCMFC, but the maximum PD was recorded at 200 ppm. This phenomenon could be attributed to two reasons; either the electrons were lost in alternate pathways taking place in SCMFC or the biofilm took longer to become sustainable in case of SCMFC, and consequently, the power production was less at 100 ppm. As the PCP concentration was increased, PD decreased indicating the inhibitory effect of PCP on microbes leading to lower power output.1,15 Fig. 3(a and b) linked the COD removal with PD curves during the course of the experiment.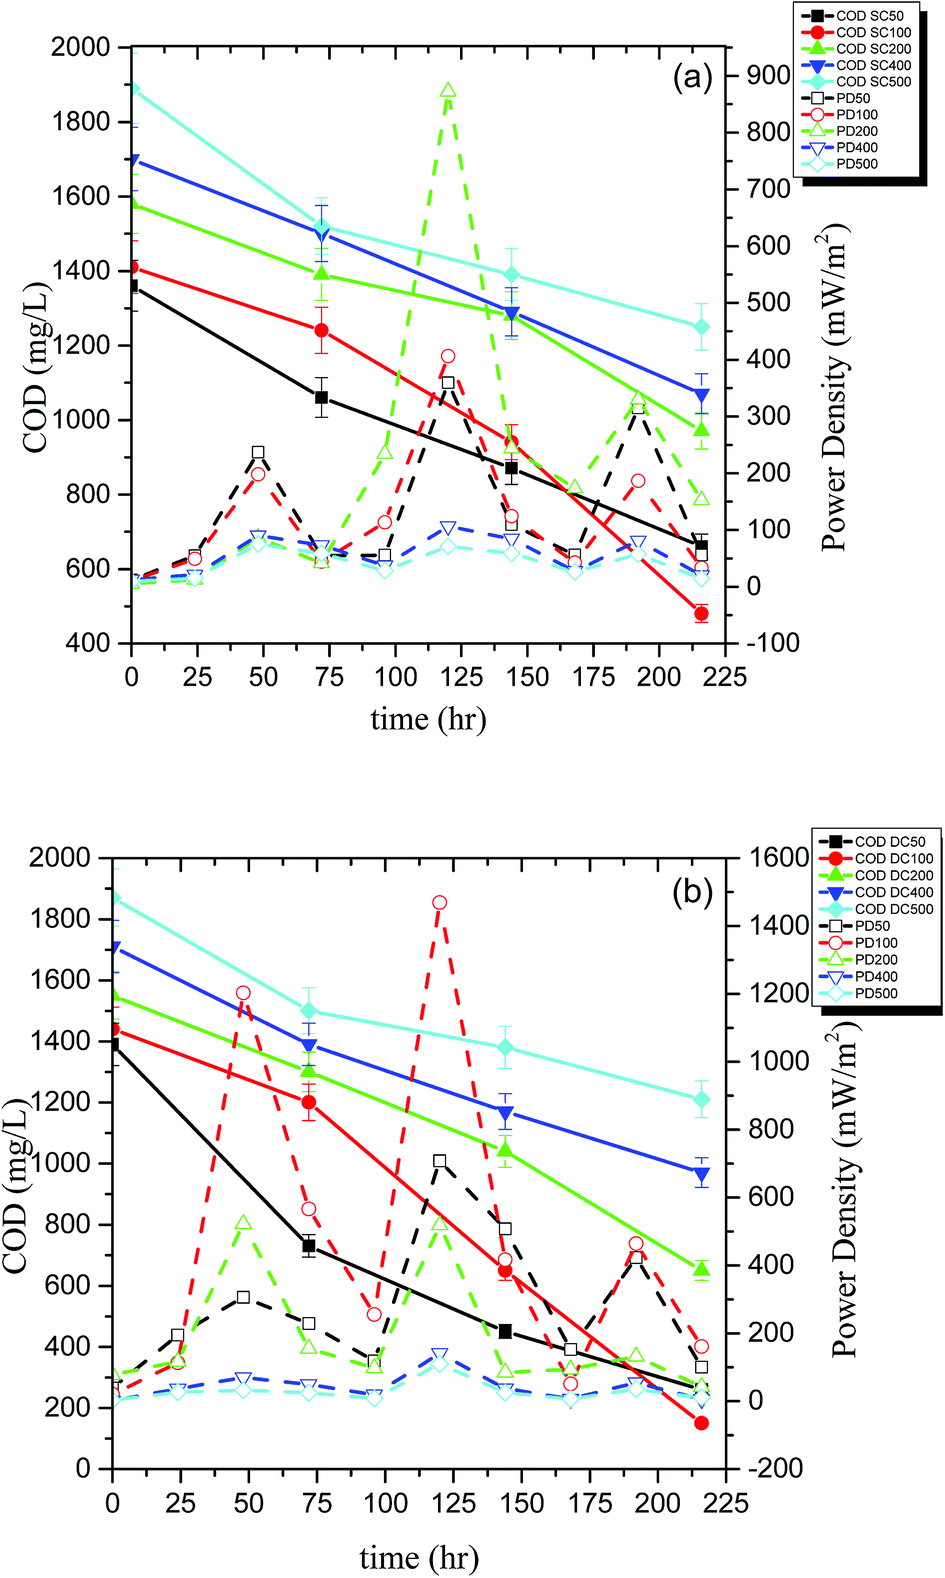 | ||
| Fig. 3 COD and power density (PD) curve for (a) SCMFC and (b) DCMFC respectively. | ||
The DCMFC consistently produced higher power and showed high COD removal as compared to SCMFC even at higher PCP concentration. The CE was calculated by using the method suggested by Patil et al.37 and presented in Fig. 4(a and b). The CE for SCMFC was ranged from 7.8–33.9% with the highest CE of 33.9% for 200 ppm concentration of PCP (Fig. 4a). Similarly, the CE in the case of DCMFC was ranged from 9.3–58.55% with the highest CE of 58.55% at 100 ppm concentration of PCP (Fig. 4b). The lower CE corresponding to the higher concentrations of PCP was again attributed to the toxic effect of PCP on bacterial community thereby lowering the CE. Therefore, higher COD removal with correspondingly high PD suggests a better performance of DCMFC in terms of energy recovery as compared to SCMFC. The better performance of DCMFC could be due to more porous sludge with uniform channels, active and sustainable bacterial community growing in this system. For PCP-glucose fed MFC batch of 72 h, the coulombic balance of nearly 10% has been reported by Huang et al.3 which is much lower than the values reported in the present work.
 | ||
| Fig. 4 Oxygen based coulombic efficiency (CE) for (a) SCMFC and (b) DCMFC and (c) formation of chloride ion (Cl−) during the experimental phase for SCMFC and DCMFC. | ||
3.3. Degradation of PCP
The first step of PCP degradation under anaerobic as well as aerobic conditions was dehalogenation that resulted in the stoichiometric rise of the chloride ion in the systems. The change in the chloride ion concentration over time was studied at 100 ppm PCP concentration for both SCMFC and DCMFC. As shown in the Fig. 4c, the chloride ion concentration increased with the passage of time for both the reactors implying that dehalogenation was the first step in PCP degradation. This agrees with GC-MS results (Fig. S3(a and b)†). From the plots in Fig. 4c, it is clear that the chloride ion concentration of DCMFC increased at a faster rate than SCMFC, which further support the claim of faster dehalogenation and effective degradation of PCP in DCMFC.In order to ensure the degradation of PCP in both bioreactors, the effluents samples were scanned at wavelength range of 200–700 nm using UV-Vis spectrophotometer. The UV-Visible spectra of pure PCP samples show characteristic bands near 220, 250 and 320 nm as have also been reported by Gunlazuardi and Lindu,38 and Murialdo et al.39 Fig. 5(a and b) showed the UV-Visible spectra of effluents samples collected from SCMFC and DCMFC respectively along with spectra for pure PCP. The diminishing peaks observed in the samples collected after 10 days indicated the treatment and subsequent removal of PCP through the bio-electrochemical system.
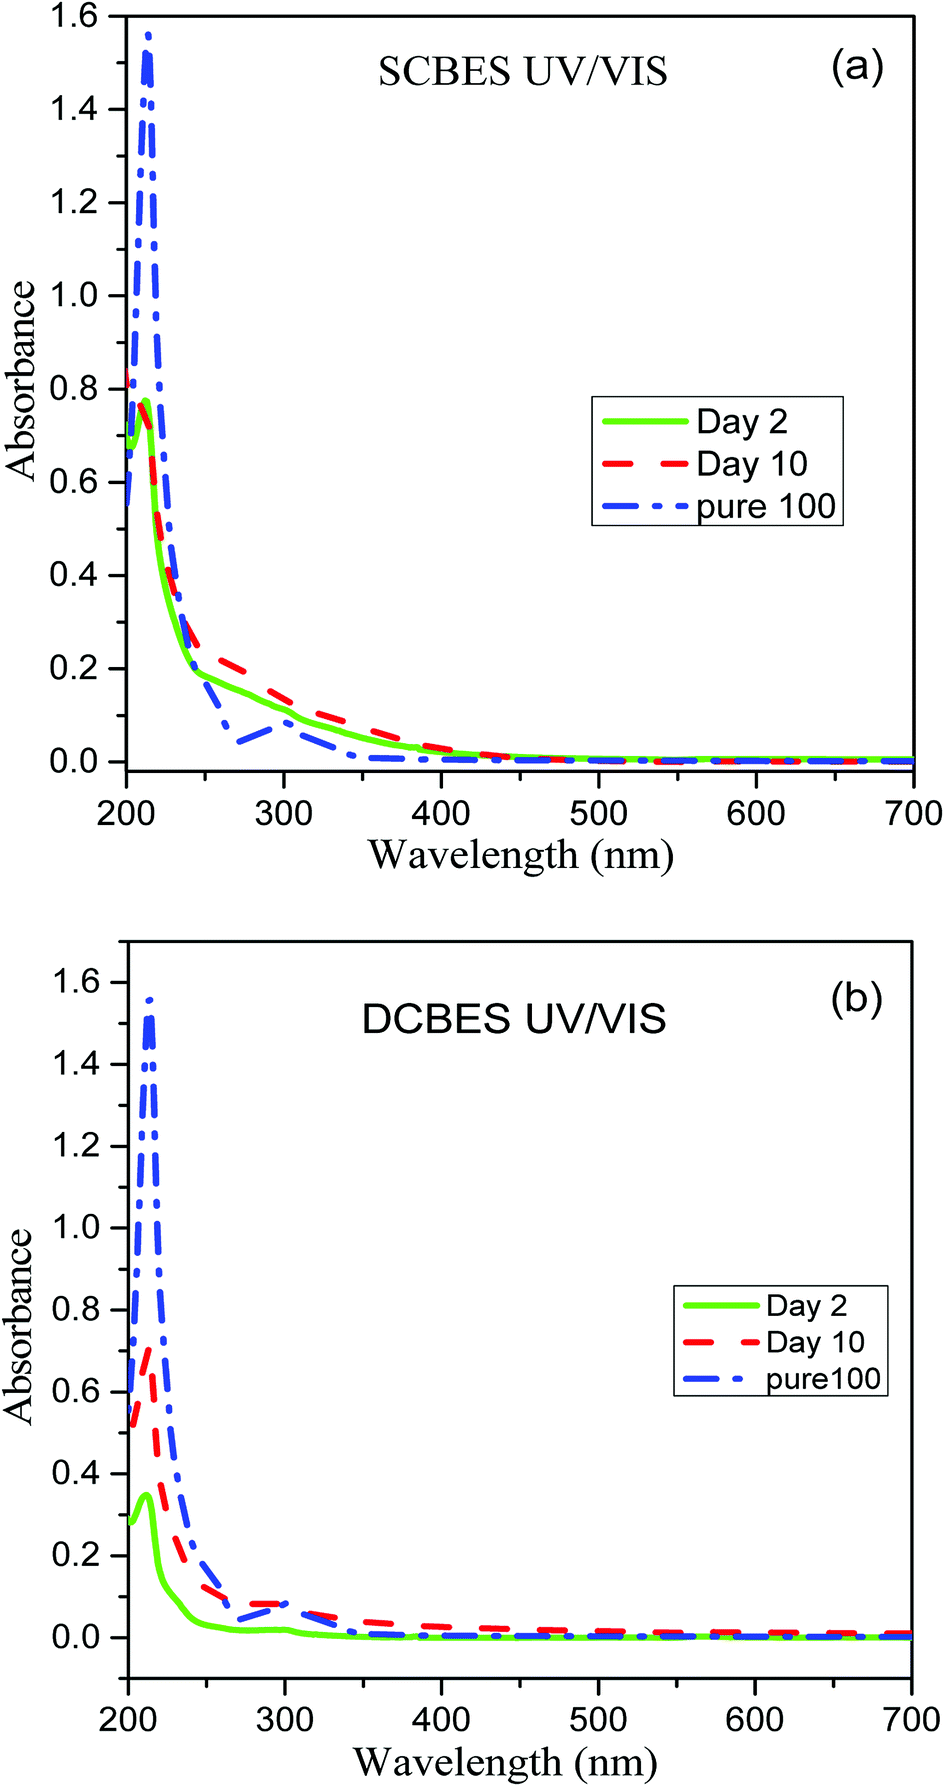 | ||
| Fig. 5 UV/Visible spectra of PCP effluent collected from (a) SCMFC and (b) DCMFC. | ||
Studies on degradation pathways have become critical to track the fate of contaminants, intermediate metabolites, and final products. Both aerobic and anaerobic degradation of CPs have been reported earlier.2,40,41 However, aerobic degradation of CPs has been studied extensively.42 Different mechanisms proposed for CPs degradation suggests the initial monooxygenases attack followed by dehalogenases forming chloromaleyl acetic acid and maleyl acetic acid depending upon dehalogenation before or after ring cleavage via ortho or meta cleavage.43,44 The degradation pathways as observed in this study (Fig. S3(a and b)†) were in good agreement with those reported by Arora and Bae41 and Louie et al.45 The GC-MS spectra of the products extracted in ethyl acetate solvents are presented in Fig. S1 and S2 (ESI†). Based on GC-MS results, degradation pathways of PCP in two MFC systems have been proposed in Fig. S3(a and b).†
The anaerobic degradation of PCP (m/z 266.34) in SCMFC was initiated by the reductive dehalogenation forming 2,3,4,5-tetrachlorophenol (m/z 131), which was further converted to 3-chlorophenol (m/z 126.5) with the stoichiometric rise in Cl− ions (Fig. 4c) following the conventional anaerobic pathway. The intermediate formed was finally converted to 4-hydroxy benzoic acid (m/z 139) by the carboxylation of phenol.46 Unlike anaerobic degradation, in the cathodic compartment of DCMFC under the oxygen supply, the PCP (m/z 266.34) was initially transformed into 2,3,6-trichlorohydroquinone (m/z 213.45) by the action of monooxygenases enzyme. This metabolite (2,3,6-trichlorohydroquinone) undergoes reductive transformation to give 2,3,6-trichlorophenol (m/z 190.54). Dichlorohydroquinone products might have also formed during PCP degradation but remain undetected due to its instantaneous conversion into 2-chloromaleyl acetate and maleyl acetate (m/z 156.09). The better degradation of PCP in DCMFC can be explained as the lack of oxygen leads to the accumulation of reduced moieties that tends to inhibit further treatment in SCMFC. Whereas in the presence of oxygen, these moieties are removed leading to better treatment of the substrate in the given system as reported by Huang et al.47
3.4. Characteristics of sludge
The surface morphologies and elemental compositions of the sludge obtained from the anodic compartment of the reactors were analyzed using SEM coupled with EDX. Fig. 6(a, b and c, d) showed the SEM images of sludge obtained from SCMFC and DCMFC at different magnifications (3000× and 7000×) respectively. The microscopic images of the sludge obtained from both the reactors showed the presence of a large number of mixed bacterial communities such as cocci and diatoms. A significant difference was seen in the sludge obtained from SCMFC and DCMFC due to the different operating conditions. The sludge from DCMFC was appeared to be quite porous as compared to the very dense sludge collected from SCMFC. Compact nature of anaerobic sludge from SCMFC resulted in to lower removal rates due to mass transfer limitations.40 The porous anaerobic sludge from DCMFC showed better mass transfer whereby electrons could be transferred easily leading to its superior performance. Fig. 6(e and f) show the SEM images of the electrode surface before and after the biofilm formation. The EDX plot showed the elemental composition of the sludge from both studied reactors (Fig. S4(a and b)†). In the case of sludge collected from SCMFC, the elements such as N, O, C, and Fe were present. Whereas in the case of DCMFC, the elements like C, N, O, Si, Al, P, and S were present. The micronutrients added (through nutrient broth) during the experiment resulted in some of the elemental peaks. The different composition observed in EDX could be due to the different operating conditions in SCMFC and DCMFC.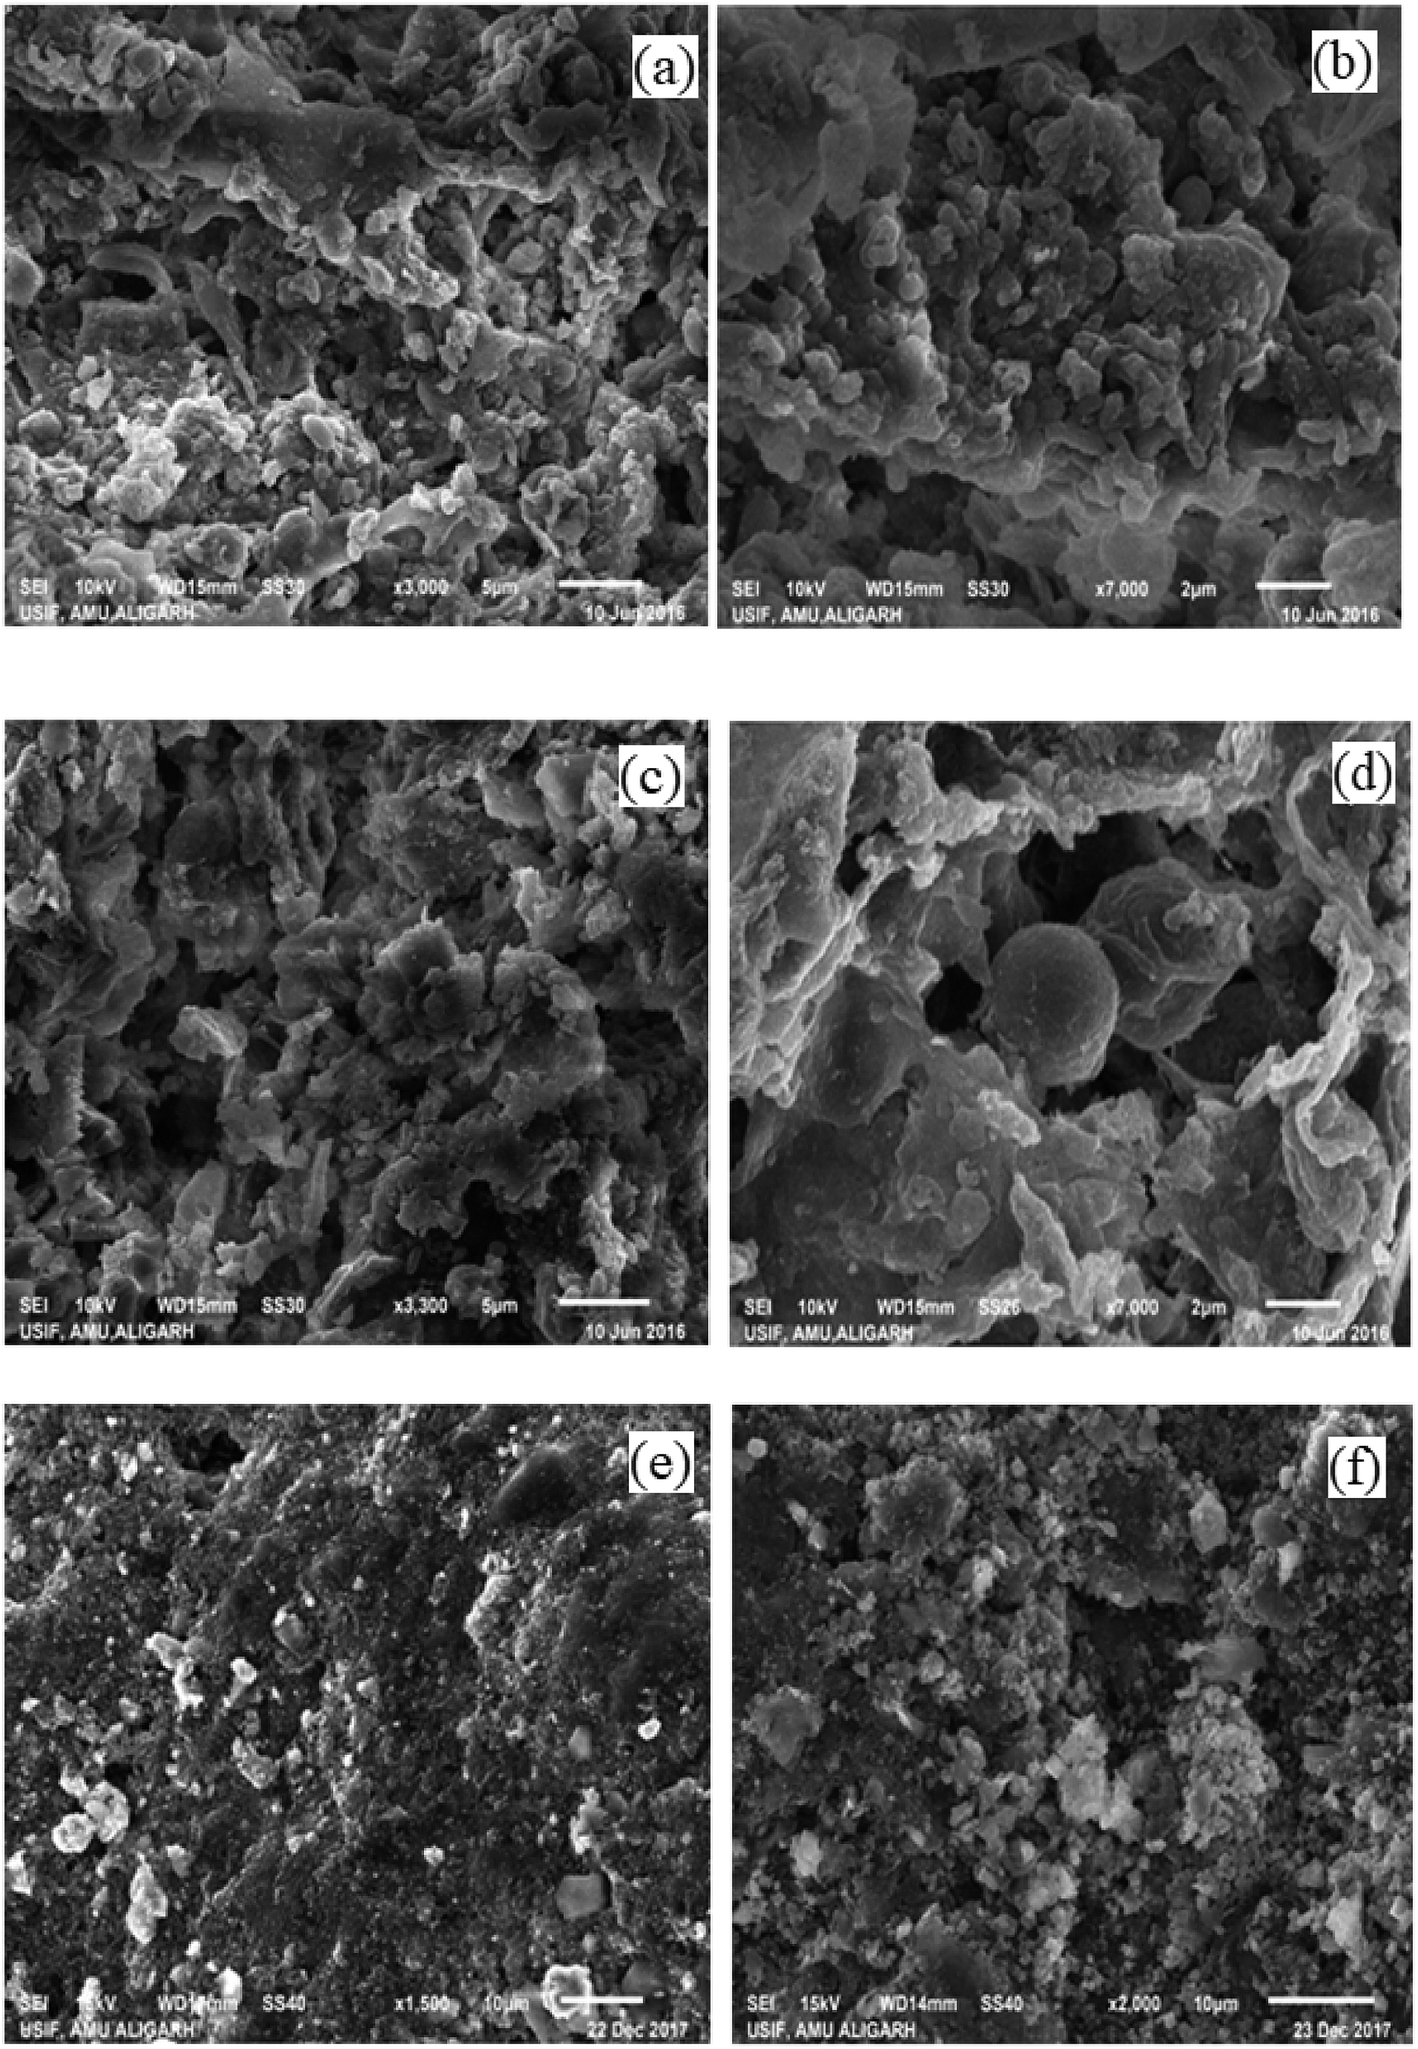 | ||
| Fig. 6 SEM images of SCMFC (a and b) and DCMFC (c and d) sludge at 3000× and 7000× (e and f) electrode with and without biofilm. | ||
3.5. Electrochemical behavior and performance of MFCs
The electrochemical behavior of anolyte present in both MFC systems was studied using CV. A three-electrode system was used to perform CV at a scan rate of 10 mV s−1. A very good redox loop was obtained for both MFC systems confirming that the active microbial communities performed the electron transfer. Fig. 7a shows the voltammograms at 10 mV s−1 for SCMFC, wherein a perfect redox loop with a forward peak was obtained at 0.298 V. Two reverse peaks were obtained at −0.117 V respectively. In the case of DCMFC, a forward peak at 0.334 V was obtained using a scan rate of 10 mV s−1 indicating a clear oxidizing activity of microbes in the anodic chamber, while the reverse peak was obtained at the potential of −0.076 V (Fig. 7b). The broader voltammogram in case of DCMFC could indicate better performance of DCMFC as compared to SCMFC in terms of stability as well as capacitance.48 The voltammograms obtained for SCMFC and DCMFC were entirely different in nature as compared to the control run that contains no PCP (Fig. 7c). Performance evaluation of the two MFC systems is given in Table 1.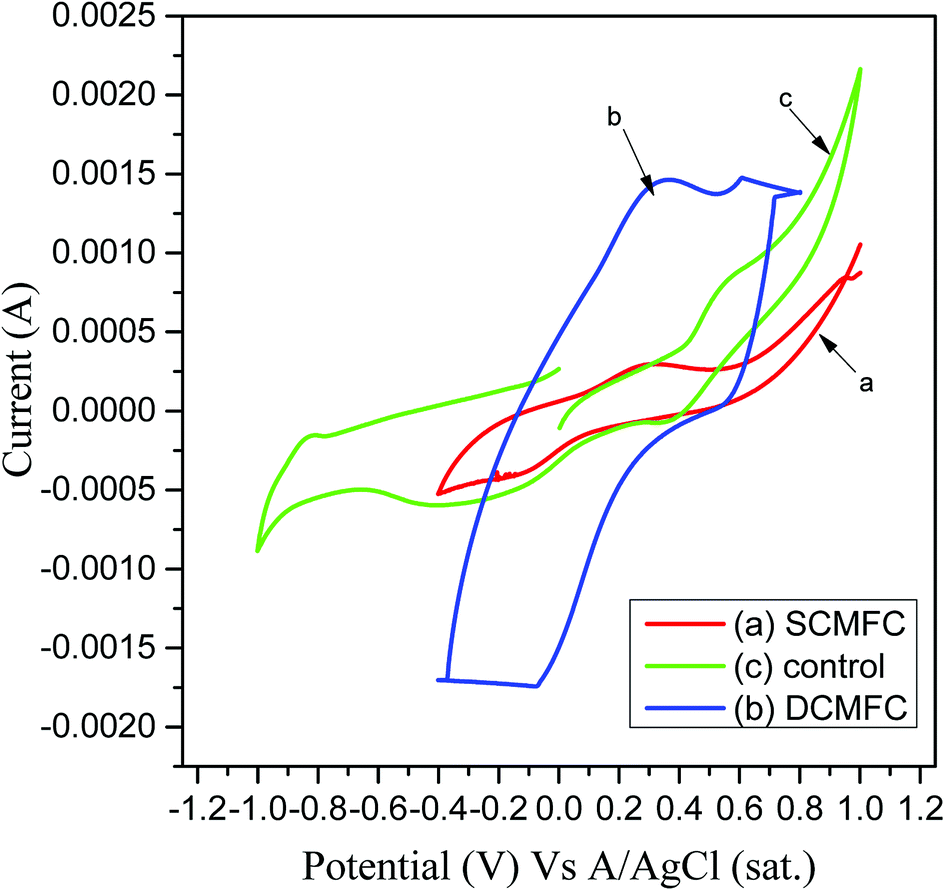 | ||
| Fig. 7 Cyclic voltammograms of (a) SCMFC (b) DCMFC and (c) control reactors. | ||
| Parameters | Range | |
|---|---|---|
| SC | DC | |
| pH | 4.9–7.2 | 7.0–8.1 |
| Conductivity | 0.5–1.4 mS cm−1 | 0.5–1.8 mS cm−1 |
| Temperature | 30.1–35.7 °C | 30.1–35.7 °C |
| Optical density | 1.4–2.1 | 1.7–2.4 |
| MLVSS | 0.5–5 g L−1 | 3.5–6.5 g L−1 |
| Cl− ion | 70.9–425.4 mg L−1 | 70.9–567.2 mg L−1 |
| Cell potential | 61–787 mV | 63–1118 mV |
| PD | 5.2–872.7 mW m−2 | 5.6–1761.2 mW m−2 |
3.6. Molecular biology of microbial communities
The RTPCR technique was used to quantify few major genera of microbial communities present in the anodic compartments of MFC systems. The RTPCR is a powerful technique used for the estimation of real-time abundance of different microbial communities in terms of log gene copy number per mL. The absolute abundance of five major classes of methanogens namely MSC, MST, MCC, MBT, and MMB was estimated along with SRB and exoelectrogenic Geobacter and presented in Fig. 8a. Among the different classes of methanogens, MCC showed the highest abundance whereas MBT showed the least. The population of MMB was increased significantly as compared to other methanogens during the experiment. The presence of excess hydrogen utilizing bacteria indicated a part of the energy that might have been lost in the form of methane through hydrogen pathway by hydrogenotrophic bacteria. It was observed that the Geobacter population that was primarily responsible for the electricity generation in MFC was enhanced during the course of study.22 From Fig. 8a, it was also evident that Geobacter was more dominant in DCMFC than SCMFC indicating better electron transfer and higher PD in the former. Fig. 8b presented the relative abundance of SRB, methanogens, and Geobacter with respect to total universal bacteria. It can be observed from the Fig. 8b that the population of SRBs responsible for inhibiting methanogenesis in the MFCs was significantly lesser than that of methanogenic population indicating the energy loss by methanogenesis (Table 2).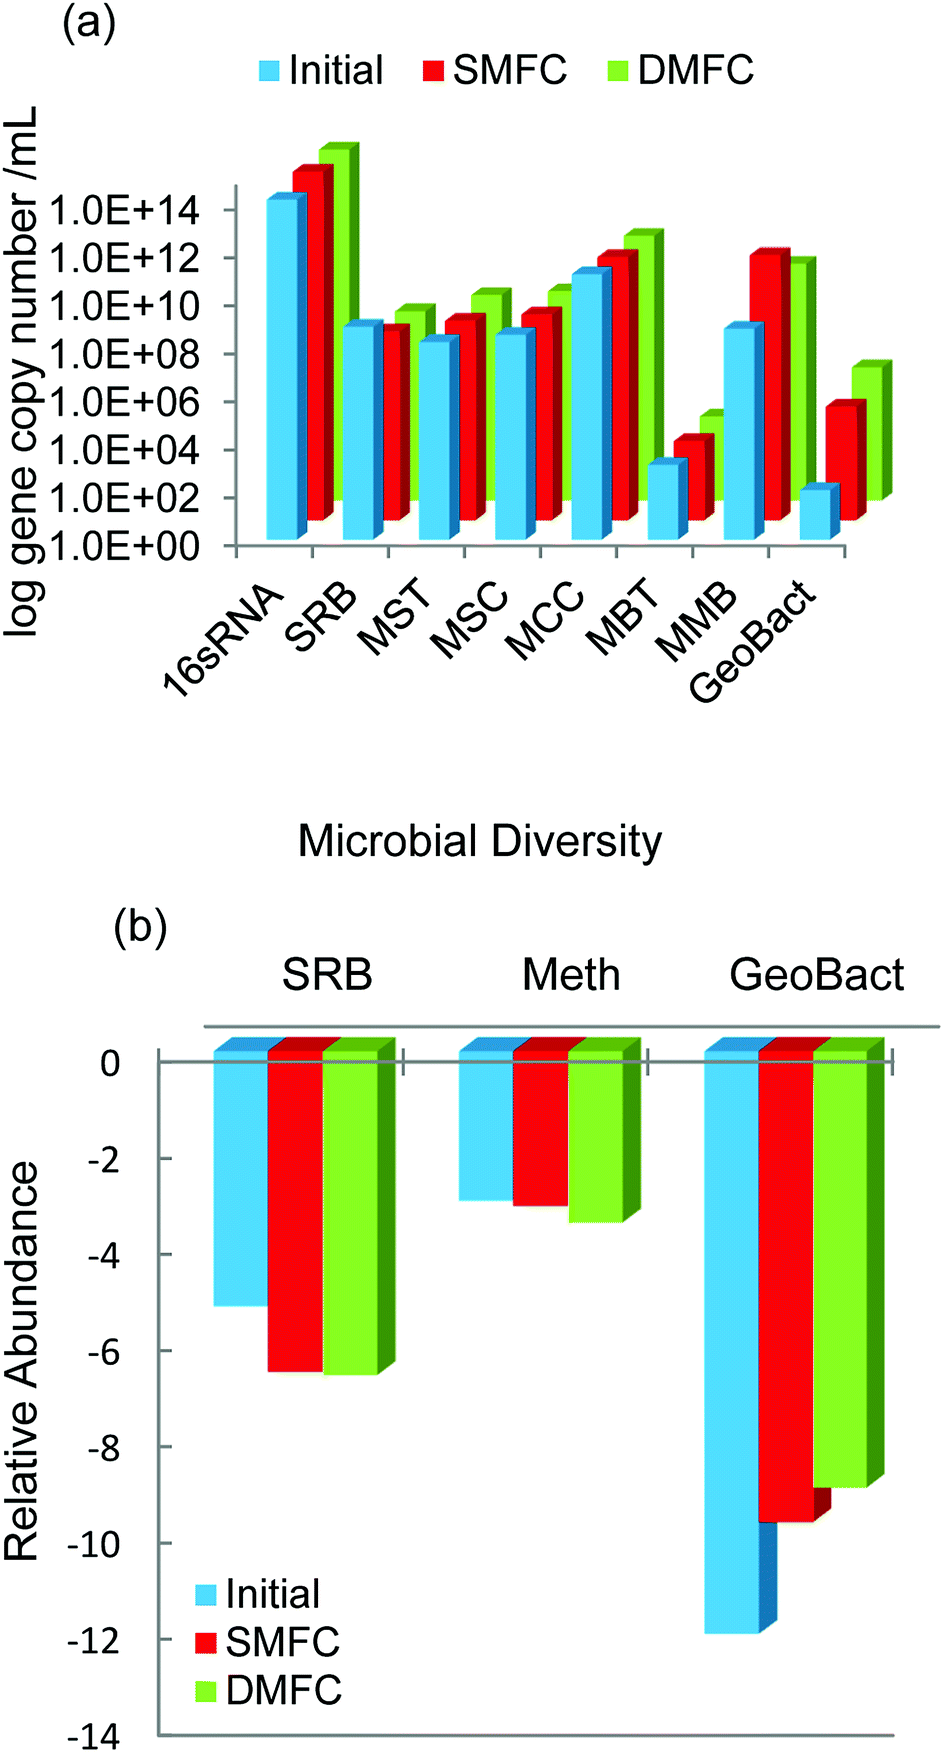 | ||
| Fig. 8 Quantification of the microbial communities present in SCMFC and DCMFC by qPCR (a) absolute abundance and (b) relative abundance. | ||
| MFC setup | Co-substrate | Output | Reference | ||
|---|---|---|---|---|---|
| DCMFC with PCP (5–30 mg L−1) | Glucose | Acetate | 1.7 W m−3 | 2.0 W m−3 | Huang et al.3 |
| DCMFC with PCP (upto 30 mg L−1) | Glucose | Acetate | 1.3 W m−3 | 2.0 W m−3 | Wang et al.12 |
| DCMFC with PCP (5–40 mg L−1) | Acetate | 2.5 W m−3 | Londry and Fedorak46 | ||
| SCMFC with PCP (5–15 mg L−1) | Glucose | Acetate | 1.1 W m−3 | 7.7 W m−3 | Huang et al.27 |
| SCMFC with glucose-PCP (500–1500 mg L−1) | Glucose | 7.8 W m−3 | Alshehri49 | ||
| SCMFC and DCMFC with PCP (50–500 mg L−1) | Glucose | 0.047 W m−3 | 0.788 W m−3 | Present work | |
3.7. Future outlook
MFC has recently gained immense interest around the globe due to its characteristic property of driving direct electrical output from the wastewater. Different types of substrates have been utilized in MFC for electricity generation like dyes, domestic wastewater besides others. The results of the present study depicted that MFC could effectively treat the toxic compounds to generate electricity while converting it to simpler less toxic counterparts. The work compared the anaerobic and aerobic treatment of PCP and suggested that the treatment of xenobiotic PCP could better achieve in aerobic conditions of DCMFC than SCMFC. However, to scale up the system, studies are required to lower the process and capital costs without compromising its performance. The lower PD could be improved by increasing the surface area and using the better material of the electrodes. Future research should be focused on less costly membranes and materials like ceramics in order to implement the technology at the commercial scale in treating toxic compounds like PCP. Moreover, the cascade of MFC arranged in parallel and series should be compared for better treatment and higher sustainable electrical output. Methanogenesis was found to be one of the main reasons for energy loss which could be decreased by maintaining proper pH and adding chemicals to suppress the growth of methanogens in the system.In developing countries like India, PCP is mainly used in wood preservation from where it finds its way into the water bodies. Scaling up this technology could benefit in treating the effluent PCP wastewater before discharging to the water bodies and supporting the electrical need of the industry. The results of the present study suggest that the effective biodegradation of xenobiotic PCP could be achieved in aerobic conditions of DCMFC. Furthermore, the results could help design reactors to scale up the technology in future.
4. Conclusions
The study demonstrates that PCP could be effectively treated as a co-metabolite in single as well as dual chambered MFC along with the production of electricity. The maximum value of cell potential for SCMFC and DCMFC were 787 mV and 1021 mV respectively. The significant reduction in COD values with corresponding high CE demonstrated the effectiveness of the system in removing PCP and its metabolites by the action of microorganisms. SEM and RTPCR results suggested that the nature of microbial community was influenced by the different operating conditions of SCMFC and DCMFC. In addition, the PCP removal was more pronounced under aerobic conditions in DCMFC than in the anaerobic chamber of SCMFC due to the presence of oxygen. The metabolite accumulation was reduced due to which better degradation was achieved. Therefore, the toxic chemicals can be treated in a bio-electrochemical system efficiently accompanied by the generation of electricity, however further studies are critical for scaling up of this technology.Conflicts of interest
There are no conflicts to declare.Nomenclature
| ABTS | 2,2′-Azino-bis(3-ethylbenzothiazoline-6-sulphonic acid) |
| BES | Bioelectrochemical system |
| CD | Current density |
| CE | Coulombic efficiency |
| COD | Chemical oxygen demand |
| CP | Chlorophenol |
| CV | Cyclic voltammetry |
| DC | Dual chambered |
| DCMFC | Dual chambered microbial fuel cell |
| EDX | Energy dispersive X-ray spectroscopy |
| GC-MS | Gas chromatography-mass spectroscopy |
| MBT | Methanobacterium |
| MCC | Methanococcus |
| MMB | Methanomicrobium |
| MSC | Methanosarcina |
| MST | Methanoseataceae |
| MFC | Microbial fuel cell |
| PCP | Pentachlorophenol |
| PD | Power density |
| PEM | Proton exchange membrane |
| qPCR | Quantitative polymerase chain reaction |
| SC | Single chambered |
| SCMFC | Single chambered microbial fuel cell |
| SEM | Scanning electron microscopy |
| SRB | Sulphate reducing bacteria |
Acknowledgements
The authors are thankful to Aligarh Muslim University, Aligarh for providing necessary research facilities. Authors are also thankful to the Council of Science and Technology, Uttar Pradesh Science (CST, UP) for funding this work.References
- M. D. Khan, N. Khan, S. Sultana, R. Joshi, S. Ahmed, E. Yu, K. Scott, A. Khan Ahmad and M. Z. Khan, Process Biochem., 2017, 57, 141–158 CrossRef.
- M. Z. Khan, F. Khan and S. Sabir, Can. J. Chem. Eng., 2011a, 89, 914–920 Search PubMed.
- L. Huang, L. Gan, Q. Zhao, B. E. Logan, H. Lu and G. Chen, Bioresour. Technol., 2011b, 102, 8762–8768 Search PubMed.
- EPA, Pentachlorophenol, Revis. 2000, https://www.epa.gov/sites/production/files/201609/documents/pentachlorophenol.pdf.
- J. Du, J. Bao, M. Tong and S. Yuan, Environ. Eng. Sci., 2013, 30, 350–356 CrossRef.
- T. Mathialagan and T. Viraraghavan, Bioresour. Technol., 2009, 100, 549–558 CrossRef PubMed.
- H. Li, Y. Li, H. Cao, X. Li and Y. Zhang, Chemosphere, 2011, 83, 124–130 CrossRef PubMed.
- M. Hou, X. Tang, W. Zhang, L. Liao and H. Wan, J. Agric. Food Chem., 2011, 59, 11456–11460 CrossRef PubMed.
- Q. Lan, M. Cao, Z. Ye, J. Zhu, M. Chen, X. Chen and C. Liu, J. Photochem. Photobiol., A, 2016, 328, 198–206 CrossRef.
- D. Zhang, C. Zhang, Z. Li, D. Suzuki, D. D. Komatsu, U. Tsunogai and A. Katayama, Bioresour. Technol., 2014, 164, 232–240 CrossRef PubMed.
- A. S. Nizami, K. Shahzad, M. Rehan, O. K. M. Ouda, M. Z. Khan, I. M. I. Ismail, T. Almeelbi, J. M. Basahi and A. Demirbas, Appl. Energy, 2017b, 186, 189–196 Search PubMed.
- S. Wang, L. Huang, L. Gan, X. Quan, N. Li, G. Chen, L. Lu, D. Xing and F. Yang, Bioresour. Technol., 2012, 120, 120–126 CrossRef PubMed.
- L. Huang, Q. Wang, X. Quan, Y. Liu and G. Chen, Bioelectrochemistry, 2013, 94, 13–22 CrossRef PubMed.
- D. Liu, L. Lei, B. Yang, Q. Yu and Z. Li, Bioresour. Technol., 2013, 148, 9–14 CrossRef PubMed.
- M. D. Khan, N. Khan, A.-S. Nizami, M. Rehan, S. Sabir and M. Z. Khan, Bioresour. Technol., 2017a, 238, 492–501 Search PubMed.
- K. B. Liew, W. R. W. Dauda, M. Ghasemi, J. X. Leong, S. S. Lima and M. Ismail, Int. J. Hydrogen Energy, 2014, 39, 4870–4883 CrossRef.
- Statistics World; Electricity and Heat for 2014, 2017. Int. Energy Agency. http://www.iea.org/statistics/statisticssearch/report/?country=WORLD%26product=electricityandheat%26year=2014.
- A. S. Nizami, M. Rehan, M. Waqas, M. Naqvi, O. K. M. Ouda, K. Shahzad, R. Miandad, M. Z. Khan, M. Syamsiro, I. M. I. Ismail and D. Pant, Bioresour. Technol., 2017a, 241, 1101–1117 Search PubMed.
- O. K. M. Ouda, S. A. Raza, A. S. Nizami, M. Rehan, R. Al-Waked and N. E. Korres, Renewable Sustainable Energy Rev., 2016, 61, 328–340 CrossRef.
- B. E. Logan, B. Hamelers, R. Rozendal, U. Schroder, J. Keller, S. Freguia, P. Aelterman, W. Verstraete and K. Rabaey, Environ. Sci. Technol., 2006, 40, 5181–5192 CrossRef PubMed.
- W. Li, S. Zhang, G. Chen and Y. Hua, Appl. Energy, 2014, 126, 136–141 CrossRef.
- M. Z. Khan, S. Singh, S. Sultana, T. R. Sreekrishnan and S. Z. Ahammad, New J. Chem., 2015, 39, 5597–5604 RSC.
- Z. He, S. D. Minteer and L. T. Angenent, Environ. Sci. Technol., 2005, 39, 5262–5267 CrossRef PubMed.
- M. Ghasemi, W. R. W. Daud, M. Ismail, M. Rahimnejad, A. F. Ismail, J. X. Leong, M. Miskan and K. B. Liew, Int. J. Hydrogen Energy, 2013, 38, 5480–5484 CrossRef.
- M. Rahimnejad, A. Adhami, S. Darvari, A. Zirepour and S. E. Oh, Alexandria Eng. J., 2015, 54, 745–756 CrossRef.
- S. Sultana, M. D. Khan, S. Sabir, K. M. Gani, M. Oves and M. Z. Khan, New J. Chem., 2015, 39, 9461–9470 RSC.
- L. Huang, L. Gan, N. Wang, X. Quan, B. E. Logan and G. Chen, Biotechnol. Bioeng., 2012, 109(9), 2211–2221 CrossRef PubMed.
- M. Mashkour, M. Rahimneja, M. Mashkour, G. Bakeri, R. Luque and S. E. Oh, ChemElectroChem, 2017, 4(3), 648–654 CrossRef.
- H. Liu and B. E. Logan, Environ. Sci. Technol., 2004, 38, 4040–4046 CrossRef PubMed.
- M. D. Khan, H. Abdulateif, I. M. Ismail and S. Sabir, PLoS One, 2015, 10, 1–18 Search PubMed.
- P. Clauwaert, K. Rabaey, P. Aelterman, L. De Schamphelair, T. H. Pham, P. Boeckx, N. Boon and W. Verstraete, Environ. Sci. Technol., 2007, 41, 3354–3360 CrossRef PubMed.
- H. Luo, P. E. Jenkins and Z. Ren, Environ. Sci. Technol., 2011, 45, 340–344 CrossRef PubMed.
- Methods of Sampling and Test (Pysical and Chemical) for water and wastewater, Part 32 Chloride (First Revision), IS: 3025 (PART 32)-1988.
- S. Z. Ahammad, R. J. Davenport, L. F. Read, J. Gomes, T. R. Sreekrishnan and J. Dolfing, RSC Adv., 2013, 3, 774–781 RSC.
- M. Z. Khan, S. Singh, T. R. Sreekrishnan and S. Z. Ahammad, RSC Adv., 2014, 4, 46851–46859 RSC.
- B. Logan, S. Cheng, V. Watson and G. Estadt, Environ. Sci. Technol., 2007, 41, 3341–3346 CrossRef PubMed.
- S. A. Patil, S. Gildemyn, D. Pant, K. Zengler, B. E. Logan and K. Rabaey, Biotechnol. Adv., 2015, 33, 736–744 CrossRef PubMed.
- J. Gunlazuardi and W. A. Lindu, J. Photochem. Photobiol., A, 2005, 173(1), 1–5 CrossRef.
- S. E. Murialdo, R. Fenoglio, P. M. Haure and J. F. González, Water SA, 2003, 29, 457–464 Search PubMed.
- M. Z. Khan, P. K. Mondal, S. Sabir and V. Tare, Bioresour. Technol., 2011b, 102, 7016–7021 Search PubMed.
- P. K. Arora and H. Bae, Microb. Cell Fact., 2014, 13, 31 CrossRef PubMed.
- J. A. Field and R. Sierra-Alvarez, Rev. Environ. Sci. Bio/Technol., 2008, 7, 211–241 CrossRef.
- C. J. P. Snyder, M. Asghar, J. M. Scharer and R. L. Legge, Biodegradation, 2006, 17, 535–544 CrossRef PubMed.
- J. Hollender, J. Hopp and W. Dott, Appl. Environ. Microbiol., 1997, 63, 4567–4572 Search PubMed.
- T. M. Louie, C. M. Webster and L. Xun, J. Bacteriol., 2002, 184, 3492–3500 CrossRef PubMed.
- K. L. Londry and P. M. Fedorak, Can. J. Microbiol., 1992, 38, 1–11 CrossRef PubMed.
- L. Huang, X. Chai, X. Quan, B. E. Logan and G. Chen, Bioresour. Technol., 2012, 111, 167–174 CrossRef PubMed.
- A. I. Inamdar, Y. Kim, S. M. Pawar, J. H. Kim, H. Im and H. Kim, J. Power Sources, 2011, 196, 2393–2397 CrossRef.
- A. N. Z. Alshehri, Journal of Environmental and Applied Bioresearch, 2015, 3(1), 6–15 Search PubMed.
Footnote |
| † Electronic supplementary information (ESI) available. See DOI: 10.1039/c8ra01643g |
| This journal is © The Royal Society of Chemistry 2018 |