 Open Access Article
Electroless plating of a Sn–Ni/graphite sheet composite with improved cyclability as an anode material for lithium ion batteries†
Guanhua Yanga,
Zhixiong Yana,
Lisan Cuia,
Yonghao Qua,
Qingyu Li *b,
Xin Lia,
Yiyan Wanga and
Hongqiang Wang
 *ac
*ac
aSchool of Chemical and Pharmaceutical Sciences, Guangxi Normal University, Guilin 541004, China
bGuangxi Key Laboratory of Low Carbon Energy Materials, Guangxi Normal University, Guilin 541004, China
cHubei Key Laboratory for Processing and Application of Catalytic Materials, Huanggang Normal University, Huanggang 438000, China
First published on 24th April 2018
Abstract
A Sn–Ni/graphite sheet composite is synthesized by a simple electroless plating method as an anode material for lithium ion batteries (LIBs). The microstructure and electrochemical properties of the composite are characterized by field emission scanning electron microscopy (FE-SEM), transmission electron microscopy (TEM), cyclic voltammetry (CV), and AC impedance spectroscopy. The results show that the as-prepared composite has Sn–Ni nanoparticles around 100 nm in size, where metallic Ni acts as an “anchor” to fix metallic Sn. The reunion phenomenon of Sn is alleviated by adding metallic Ni between the metallic Sn and graphite sheets. The Sn–Ni/graphite sheet electrode exhibits a good rate performance with a capability of 637.4, 586.3, 466.7, 371.5, 273.6, 165.3 and 97.3 mA h g−1 at a current density of 0.1, 0.2, 0.5, 1.0, 2.0, 5.0 and 10 A g−1, respectively. The good electrical conductivity of Ni, high specific capacity of Sn and excellent cycling capability of the graphite sheets have a synergistic effect and are the main reasons behind the superior electrochemical performance. Furthermore, the as-prepared composite exhibits excellent lithium storage capacity and the reversible capacity increased as the cycle number increased.
1. Introduction
Due to their high energy density, environmental friendliness and the absence of memory effects, lithium ion batteries (LIBs) have been widely used in portable electronic products (such as laptops, mobile phones, digital cameras, etc.), and have huge potential in the fields of electric and hybrid vehicles.1–5 With the development of society and the progress of technology, the demand for high-performance batteries is urgently increasing.6,7 Meanwhile, the anode materials of LIBs have a significant influence on their electrochemical performance, especially in the development of high-performance batteries. At present, one commercially applied anode material in LIBs is graphite, which possesses the characteristics of low cost, excellent electron conductivity, long cycle life and capacity stability. However, the theoretical capacity of graphite is only 372 mA h g−1, which can hardly meet the requirements of high-capacity LIBs.8,9 In order to obtain high capacity anode materials, numerous efforts are being made to find alternative materials to replace current commercial carbon for new LIBs.10–15Among all the alternative materials, Sn metal is a promising non-carbon anode material with high theoretical capacity (994 mA h g−1) and a low-voltage lithium-ion de-intercalation platform.3,16 However, its significant volume expansion (200–300%) during cycles results in a reduction in specific capacity and cycle performance degradation, which limits its large-scale application in LIBs.17–20 A typical strategy to overcome these shortcomings is to introduce an active or inert element that acts as a “buffer” to accommodate the large volume change during cycling. Researchers have shown that dispersing a Sn-based material in a carbon matrix is an effective way to form a stable Sn alloy or composite material to mitigate the volume effects of Sn and improve the cycling performance.3,11,13,21,22
Sn/C composite materials have already been obtained by various methods,23–25 and most of them need high temperature treatment to ensure good conductivity. However, the melting point of Sn is only 232 °C and its dispersibility in composites is susceptible to heat treatment temperature. Under high temperature heat treatment, Sn particles tend to aggregate together into large particles,23 which easily leads to powdering and falling of the electrode material during cycling, eventually resulting in the decrease of battery capacity and deterioration of the cycle performance.26 Meanwhile, when the Sn/C composite material is treated with relatively low temperature, it has poor electrical conductivity. Moreover, the connection between the Sn particles and the carbon is loose, which is not conducive to improving the electrochemical performance. In order to improve the conductivity of the composite material and inhibit the aggregation of metallic Sn at high heat treatment temperature, metallic Ni was introduced into the composite material.27–29 Since nickel is a metal with good conductivity and its melting point is as high as 1453 °C, it can improve the electrical conductivity of the composite material and increase thermal tolerance.17,30 Renzong Hu et al. prepared a Sn–C–Ni composite thin film by electron beam evaporation, which exhibited good capacity retention and a high rate capability.22 B. D. Polat et al. prepared a Ni–Sn–C multilayered composite thin film by electron beam deposition, in which the interactions among Ni, Sn, and C atoms were enhanced and the electrode demonstrated good capacity performance.31 Although Ni–Sn–C composite thin films with good electrochemical performance have been obtained, most methods used are not conducive to large-scale production due to the use of special equipment. For this reason, the facile synthesis of Sn–Ni–C multilayered anode materials with high capacity and long cycle life remains a challenge.
In this work, we use graphite sheets as the buffering/conducting matrix for Sn owing to their flexibility, mechanical strength, and electrical conductivity and propose a simple new strategy to prepare a Sn–Ni/graphite sheet composite material by electroless plating.32 Metallic Ni in the composite material acts as a bridge connecting the graphite sheets and metallic Sn, preventing the aggregation of Sn at high heat treatment temperature. Meanwhile, Ni can improve the non-wetting properties between the metallic Sn and the non-metallic graphite sheets. Ni acts as an “anchor” in the as-prepared composite and limits the aggregation of Sn in a certain area, which is conducive to inhibiting metallic Sn reunion and improving the cycling performance of Sn. The enhanced electrochemical performance of the Sn–Ni/graphite sheets composite as an anode and the related mechanism are reported herein.
2. Experimental
2.1 Preparation of Sn–Ni/graphite sheet composite material
![[thin space (1/6-em)]](https://www.rsc.org/images/entities/char_2009.gif) :
:![[thin space (1/6-em)]](https://www.rsc.org/images/entities/char_2009.gif) 3) were added to the suspension and reacted at 90 °C for another 10 h. After cooling to room temperature, the black products were filtered and washed with a certain volume of 10 wt% HCl aqueous solution. Oxidized graphite sheets were obtained after washing with deionized water and drying.
3) were added to the suspension and reacted at 90 °C for another 10 h. After cooling to room temperature, the black products were filtered and washed with a certain volume of 10 wt% HCl aqueous solution. Oxidized graphite sheets were obtained after washing with deionized water and drying.2.2 Material characterization
The microstructure of the samples was characterized by field emission scanning electron microscopy (FESEM, Philips, FEI Quanta 200 FEG) and transmission electron microscopy (TEM, Tokyo, Japan, JEOL 2100F). The composition of the sample was analyzed by an energy dispersive spectroscope (EDS, INCA) attached to the SEM. Infrared spectra were recorded on a PE (Spot-light 3000) Fourier transform infrared (FTIR) spectrometer using the KBr disk technique to investigate the different functional groups in the powders before and after annealing. Raman spectroscopy (Spex Raman Log 1403) was employed to verify chemical bonding characteristics of carbon. Thermogravimetric analysis TG-DSC (SETARAM, LABSYS evo) was carried out in the temperature range 30 to 1000 °C at a scanning rate of 10 °C min−1 in air.2.3 Electrochemical measurements
The electrochemical properties of the samples were tested using CR2032 coin-type half-cells, which were assembled in an argon-filled glove box with Li metal foil (Aldrich, USA) as the counter electrode. The working electrodes were prepared by coating homogeneous slurry on a copper foil. The slurry was composed of 85 wt% of active material, 10 wt% of conductivity agent (acetylene black), and 5 wt% of binder (polyvinylidene fluoride, PVDF). Then the electrodes were dried at 80 °C in a vacuum oven for 12 h and pressed to enhance the contact between the active material and the conductive carbons. During the preparation of the electrode, the mass loading of active material in the electrodes is about ∼0.6 mg cm−2. The electrolyte was composed of 1 M LiPF6 and a mixture of ethylene carbonate (EC)/diethyl carbonate (DEC) 1![[thin space (1/6-em)]](https://www.rsc.org/images/entities/char_2009.gif) :
:![[thin space (1/6-em)]](https://www.rsc.org/images/entities/char_2009.gif) 1 (vol%). Discharge–charge cycling tests were carried out at room temperature with a LAND test system, in the voltage range 0.01 V to 3.0 V (vs. Li/Li+). Electrochemical impedance spectroscopy (EIS) was carried out in the frequency range 100 kHz to 10 mHz, and cyclic voltammograms (CVs) were measured with a scan rate of 0.1 mV s−1 in a potential range 1.0 mV to 3.0 V. Both EIS and CV tests were carried out on the IM6 electrochemical workstation (Zahner, Germany) at room temperature.
1 (vol%). Discharge–charge cycling tests were carried out at room temperature with a LAND test system, in the voltage range 0.01 V to 3.0 V (vs. Li/Li+). Electrochemical impedance spectroscopy (EIS) was carried out in the frequency range 100 kHz to 10 mHz, and cyclic voltammograms (CVs) were measured with a scan rate of 0.1 mV s−1 in a potential range 1.0 mV to 3.0 V. Both EIS and CV tests were carried out on the IM6 electrochemical workstation (Zahner, Germany) at room temperature.
3. Results and discussion
3.1 The microstructure the of graphite sheets
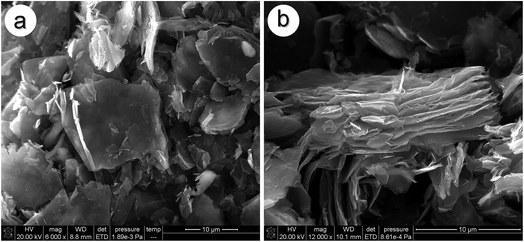
As shown in Fig. 1a, flake graphite with neat edges is densely stacked together and the particle size distribution of flake graphite is in the range 4–10 μm. After the oxidation process, unlike flake graphite, oxidized graphite sheets exhibit a thin layered structure and only loosely connect with each other as shown in Fig. 1b, which suggests that the oxidation process promotes the stripping of flake graphite. The graphite sheets are further explored by FT-IR to evaluate their oxidation degree (Fig. S1†). The band of oxidized graphite sheets around 3150 cm−1 could be attributed to the stretching vibration of C–OH and –OH, which is shifted compared to the absorption peak of flake graphite (3437 cm−1). The absorption peak at around 1733 cm−1 is mainly due to the C![[double bond, length as m-dash]](https://www.rsc.org/images/entities/char_e001.gif) O stretching vibration of carboxyl and carbonyl groups on the oxidized graphite sheets. The peak at approximately 1600 cm−1 is the characteristic O–H bending vibration of the water molecules, and the one near 1570 cm−1 is attributed to C
O stretching vibration of carboxyl and carbonyl groups on the oxidized graphite sheets. The peak at approximately 1600 cm−1 is the characteristic O–H bending vibration of the water molecules, and the one near 1570 cm−1 is attributed to C![[double bond, length as m-dash]](https://www.rsc.org/images/entities/char_e001.gif) C bending vibrations.38 FT-IR results show that the oxidation process can increase the number of oxygen containing groups on the surface of the layers. Moreover, Raman spectra (Fig. S2†) show that both flake graphite and oxidized graphite sheets show characteristic peaks of carbonaceous materials at around 1350 cm−1 (D band) and 1590 cm−1 (G band). The G and D bands are associated with the ordered sp2 carbon and disordered effects and edge carbons, respectively. The ratio of ID/IG is used to measure the disorder in carbonaceous materials. It is obvious that the ID/IG value of oxidized graphite sheets (1.13) is greater than that of flake graphite (0.34), implying that homemade graphite sheets become more disordered after functionalization.18 The graphitization of flake graphite decreases after activation, which is likely due to the more wavy or curly structure in oxidized graphite sheets. The Raman results are consistent with SEM and FT-IR. Thus, more oxygen containing groups are added on graphite sheets by the modified Hummer’s method and the synthetic sandwich structure of graphite sheets can offer many attachment sites at the gaps and limit the reaction in a certain region.
C bending vibrations.38 FT-IR results show that the oxidation process can increase the number of oxygen containing groups on the surface of the layers. Moreover, Raman spectra (Fig. S2†) show that both flake graphite and oxidized graphite sheets show characteristic peaks of carbonaceous materials at around 1350 cm−1 (D band) and 1590 cm−1 (G band). The G and D bands are associated with the ordered sp2 carbon and disordered effects and edge carbons, respectively. The ratio of ID/IG is used to measure the disorder in carbonaceous materials. It is obvious that the ID/IG value of oxidized graphite sheets (1.13) is greater than that of flake graphite (0.34), implying that homemade graphite sheets become more disordered after functionalization.18 The graphitization of flake graphite decreases after activation, which is likely due to the more wavy or curly structure in oxidized graphite sheets. The Raman results are consistent with SEM and FT-IR. Thus, more oxygen containing groups are added on graphite sheets by the modified Hummer’s method and the synthetic sandwich structure of graphite sheets can offer many attachment sites at the gaps and limit the reaction in a certain region.
3.2 The microstructure of the as-prepared Sn–Ni/graphite sheet composite material
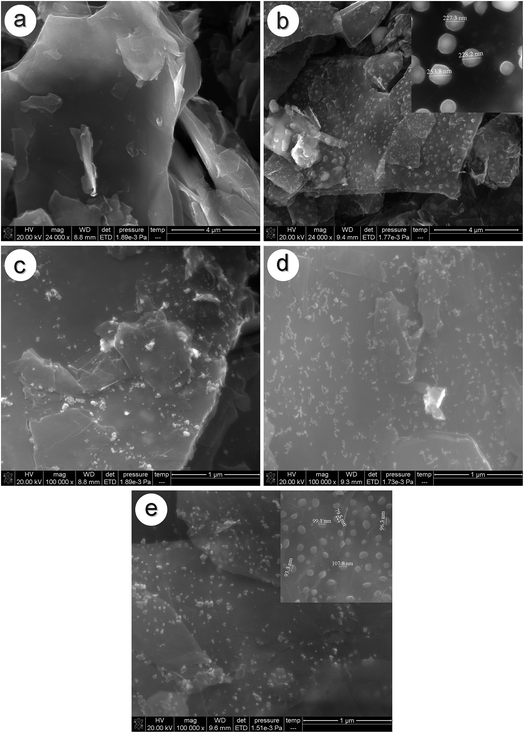
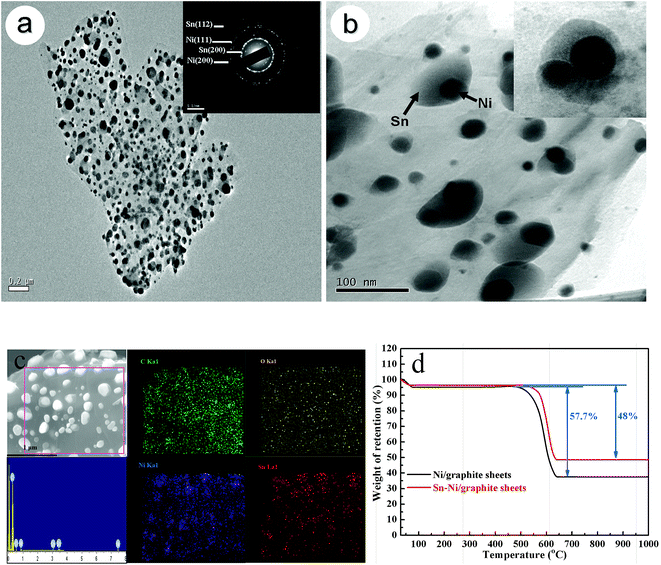
Fig. 2a and b show SEM images of the electroless plated Sn/graphite sheet composite before and after sintering, respectively. In Fig. 2a, no particle is observed on the surface of graphite sheets, indicating that Sn particles do not reunite before heat treatment. However, since the melting point of Sn is only 232 °C, it is easy for Sn to transform into a molten state and gradually blend together under high temperature treatment. Then, molten Sn would reunite into particles when cooled, as shown in Fig. 2b. The size of the Sn particles is about 230 nm, as given in the inset. It indicates that Sn aggregates into large particles on the surface of the graphite sheets after sintering at 600 °C. Fig. 2c displays the electroless Ni/graphite sheet samples before sintering. It can be seen that small floccules disperse uniformly on the graphite sheets. Fig. 2d and e are SEM images of electroless plated Sn–Ni/graphite sheet composites before and after sintering, respectively. Fig. 2d shows that the sample has similar flocculent particles on the surface of the graphite sheets before sintering. Compared to Fig. 2c, the flocculent particles are smaller and distribute more evenly, indicating that the agglomeration of particles is effectively alleviated. This may be because the metallic Ni acts as the active site, which can prevent the particles contacting with each other. Fig. 2e shows that a lot of small spherical particles disperse evenly on the matrix of graphite sheets. Compared to the particles in Fig. 2b, the size of the particles in Fig. 2e is much smaller, with a diameter around 100 nm. This is because Ni has a high melting point, which makes metallic Sn withstand the heat treatment temperature of 600 °C without severe agglomeration. In addition, Ni particles can be used as attachment points for Sn, which means Sn effectively covers the surface of the Ni and is fixed in certain area. Thus, this special “anchor” structure of the Sn–Ni/graphite sheet sample can improve the heat treatment temperature of the composite material and effectively inhibit the accumulation of metallic Sn.In order to investigate the microstructure of the Sn–Ni/graphite sheet composite after sintering at 600 °C, TEM observations were carried out. They revealed clearly that the composite is composed of lots of similar core/shell nanoparticles, in which the Ni particles are dispersed inside and the Sn particles form a shell and cover the Ni particles.22 The Sn–Ni particles uniformly attach to the graphite sheets, as shown in Fig. 3a. The selected area electron diffraction (SAED) pattern proves that the composite material is polycrystalline, shown as an inset in Fig. 3a. These particles are Sn and Ni, which is consistent with the previous reports.22,27 The enlarged image of the composite material in Fig. 3b also shows that Sn–Ni particles with a size of about 100 nm homogeneously disperse on the graphite sheets. It shows that the micro-sized Ni are fully wrapped by the metallic Sn and the shell thickness of Sn is about 70 nm. The enlarged image of the composite is shown as an inset in Fig. 3b, and further proves that the Sn particles cover the Ni particles, forming Sn–Ni particles. It is proven by the EDS (Fig. 3c) that the nano-composite mainly contains a homogeneous spatial distribution of C, O, Sn and Ni, and the content of each element is 40.8%, 15.5%, 31.4%, and 12.3%, respectively. It also verifies that the nickel metal and metallic tin were effectively deposited on the graphite sheet surface by electroless plating. The composite material contains some oxygen, which is because oxygen-containing groups are not completely removed at 600 °C. Fig. 3d shows the TGA curves of Ni/graphite sheets and Sn–Ni/graphite sheets in air in the temperature range of room temperature to 1000 °C with a heating rate of 10 °C min−1. The first mass loss in the region 30–100 °C is ascribed to the release of adsorbed water and the second mass loss in the region 100–600 °C may be correlated to the removal of the graphite sheets. Therefore, the weight fraction of the graphite sheets is about 48% by weight. From Fig. 3d, it can be estimated that the amount of NiO and SnO2 in the Sn–Ni/graphite sheets is about 37.7% and 10.8%, respectively. Based on the weight ratio of NiO and SnO2, the loading ratio of Ni and Sn by weight was calculated to be 29.6% and 8.5%, respectively, which is consistent with the EDS results.
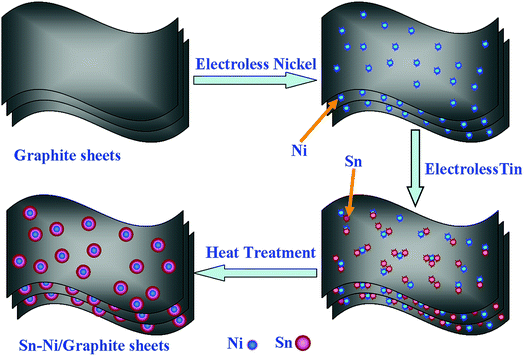
The deduced formation mechanism of the Sn–Ni/graphite sheet composite is presented schematically in Scheme 1. Firstly, homemade graphite sheets with a layered structure are prepared by a modified Hummer’s method and are expected to increase the surface area of the composite material and alleviate the volume effect of the metallic Sn. After the graphite sheets have been activated, Pd active sites are distributed evenly on the graphite sheets. Subsequently, metallic Ni is deposited on the surface of the pretreatment graphite sheets by electroless plating, then metallic Sn is deposited on the surface of the Ni. The volume effect of the Sn in the as-prepared composite material is constrained by the interaction between the Ni and the graphite sheets. The metallic Ni acts as attachment sites, which makes the Sn gather around the metallic Ni. The Ni tightly connects the graphite sheets and the metallic Sn, and the high melting point of Ni improves the heat resistance of the composite material and prevents the melting Sn from aggregating under high heat treatment temperature. The good wettability between Sn and Ni in the as-prepared composite may help to reduce the impedance value of the composite. The good electrical conductivity of Ni, high specific capacity of Sn and excellent cycling capability of graphite sheets will be synergistically conducive in improving the electrochemical properties of the Sn–Ni/graphite sheet composite.
3.3 Electrochemical properties of the Sn–Ni/graphite sheet composite
The CV curves of the first three cycles for the Sn–Ni/graphite sheets, Sn/graphite sheets and Ni/graphite sheets at a scan rate of 0.1 mV s−1 in the range 1.0 mV to 3.0 V are shown in Fig. 4a–c, respectively. As shown in Fig. 4, all the cells display a similar broad peak within the range of 0.30–0.70 V during the first reduction process which then disappears in the subsequent two cycles, which is in accordance with the decomposition of the electrolyte and the subsequent formation of solid electrolyte interphase (SEI) films. In Fig. 4a, there is no obvious peak near 0.8 V in the cathodic process in the first cycle. This phenomenon is mainly due to the poor wetness of the electrolyte on the active substance, which impedes the embedding process of the lithium ion into Sn. A sharp peak appears near 0.01 V, which is attributed to the insertion of Li+ into the graphite layers to form LixC. In the anodic process, the peak at around 0.25 V corresponds to the process of lithium ion extraction from the graphite sheets. On the next two cycles, it can be seen that two peaks appear at about 0.75 and 0.25 V in the cathodic process, which are consistent with the reaction of Li with Sn. The subsequent anodic curves show two peaks at approximately 0.80 and 0.15 V, which are attributed to the extraction of Li from LixSn and the graphite sheets, respectively. The CV curves of the Sn/graphite sheets are displayed in Fig. 4b. The Sn/graphite sheets show similar peaks at about 0.80, 0.25, 0.01 V in the cathodic process, which can be ascribed to the formation of the LixSn alloy and Li+ insertion into the graphite sheets. The peaks at approximately 0.85 and 0.25 V represent Li+ deinsertion from the LixSn alloy and Li+ extraction from the graphite sheets, respectively. Comparing Fig. 4a and b, the introduction of metallic nickel not only maintained the behavior of insertion/deinsertion from the LixSn alloy, but also improved the reversibility of the reaction in the cyclic voltammetry, especially in the second and third cycle. As shown in Fig. 4c, the Ni/graphite sheets composite material shows better reversibility than the graphite sheets composite material (see Fig. S3 in the ESI †), agreeing well that the introduction of nickel can improve the electrochemical reversibility of the Sn–Ni/graphite sheets. These results further indicate that nickel and tin have been successfully deposited on the graphite sheets by electroless plating. It confirms that lithium ions can not only be inserted into and extracted from the graphite layer, but also react with tin. Additionally, it verifies that nickel can enhance the electrochemical reversibility of the Sn–Ni/graphite sheets.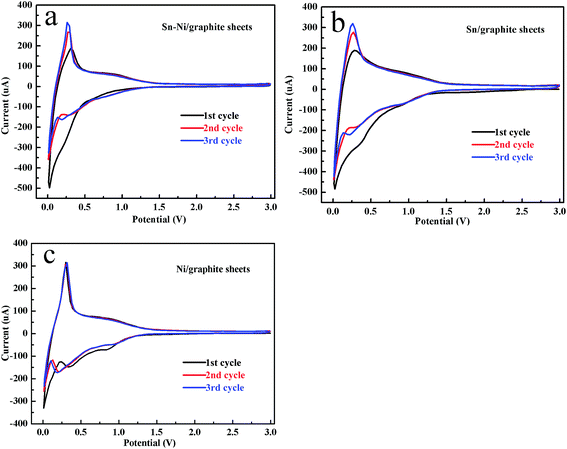 | ||
| Fig. 4 The first three CV curves of the Sn–Ni/graphite sheets (a), the Sn/graphite sheets (b) and the Ni/graphite sheets (c) with a scan rate of 0.1 mV s−1 between 1.0 mV and 3.0 V. | ||
Fig. 5 shows the discharge–charge curves of the Sn–Ni/graphite sheets, Sn/graphite sheets and Ni/graphite sheets electrodes at the 1st, 2nd, 10th cycle between 0.01–3.0 V with a current density of 0.1 A g−1. For the Sn–Ni/graphite sheets in Fig. 4a, the charge and discharge curves show a wide potential plateau at 0.25 to 0.01 V, corresponding to the process of lithium ion intercalation and deintercalation from the graphite sheets. The steep profile of 0.85 to 0.25 V is related to the processes of the lithium ions being embedded into the Sn and extracted from LixSn. The above results are consistent with the results of the CVs in Fig. 4a. The Sn–Ni/graphite sheets show discharge and charge capacities during the first cycle of 1208.9 and 633.4 mA h g−1, respectively, and the coulombic efficiency in the first charge/discharge cycle is 52.4%. This large irreversible capacity during the initial cycle may be caused by the formation of solid electrolyte interphase (SEI) or associated with the trapping of Li ions in the defects of the composite material. However, in the subsequent charge–discharge cycles, the coulombic efficiency of the 10th cycle increases to 98.7% (the 10th cycle discharge and charge capacities are 633.8 and 642.2 mA h g−1), indicating that the capacities of the composite material electrode are highly reversible and that the electrode tends to be stable. For comparison, the Sn/graphite sheets exhibit initial discharge and charge capacities of 958.0 and 530.7 mA h g−1, respectively. The Ni/graphite sheets display initial discharge and charge capacity of 881.1 and 499.9 mA h g−1, respectively. In subsequent cycles, the Sn/graphite sheets and Ni/graphite sheets 10th cycle charge capacities are 466.9 and 428.4 mA h g−1, respectively. Therefore, the Sn–Ni/graphite sheets show higher capacity than the other samples (the 1st, 2nd and 10th discharge–charge capacities are shown in Fig. S4†), which may be due to the introduction of metallic Ni alleviating the volume effect of Sn, thereby increasing the reversible capacity of the composite material.
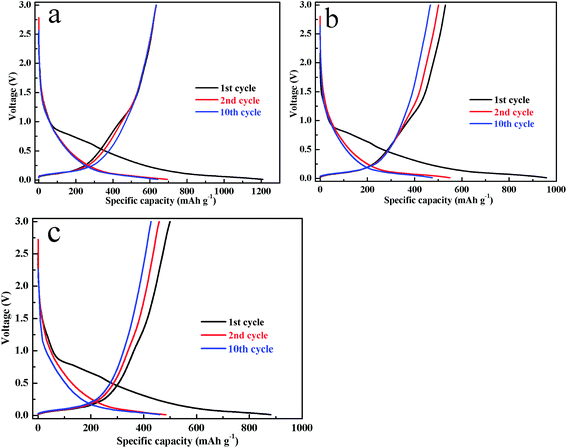 | ||
| Fig. 5 The 1st, 2nd and 10th discharge–charge curves of the Sn–Ni/graphite sheets (a), the Sn/graphite sheets (b) and the Ni/graphite sheets (c). | ||
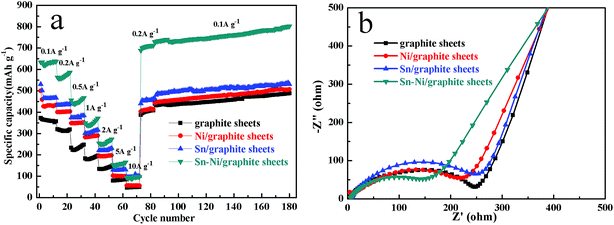
In order to further investigate the electrochemical performance of the graphite sheets, Sn/graphite sheets, Ni/graphite sheets and Sn–Ni/graphite sheet electrodes, rate performance and continuous cycling tests of different electrodes were carried out, and the results are shown in Fig. 6a. All of the cells are first activated by cycling at current densities of 0.025 A g−1 and 0.05 A g−1, respectively. Then the cells are cycled at current densities of 0.1 A g−1 to 10 A g−1, returned to 0.2 A g−1 and continuously cycled at a current density of 0.1 A g−1. It can be seen that the capacity decreases with an increase in rate, and the capacity increases again after the rate is reversed back to 0.2 A g−1. Furthermore, all the electrodes show excellent rate capability at each rate. Obviously, compared to the other electrodes, the Sn–Ni/graphite sheets electrode displays the most excellent lithium storage capacity at each current density. With increasing current density of 0.1, 0.2, 0.5, 1.0, 2.0, 5.0 and 10 A g−1, the capacities at the end of each rate were measured as 637.4, 586.3, 466.7, 371.5, 273.6, 165.3 and 97.3 mA h g−1, respectively. When the current density returned to 0.2 A g−1, the Sn–Ni/graphite sheet electrode still displayed an impressive specific capacity of 712.3 mA h g−1, higher than the capacity of 586.3 mA h g−1 at 0.2 A g−1 displayed at the beginning. This could be attributed to the metallic nickel, metallic tin and graphite sheets synergistically increasing the lithium storage capacity by expanding the ion transmission channels facilitating lithium ions to transfer into deeper regions, so the electrode could be activated during the cycle. After cycling at each rate, the electrodes continued to cycle for another 100 cycles at 0.1 A g−1, and the capacity of the Sn–Ni/graphite sheet electrode retained a capacity as high as 802.4 mA h g−1. For comparison, the capacities at the end of each rate and continuous cycling test for the graphite sheets, Sn/graphite sheets, and Ni/graphite sheets are also provided in Table S4,† which reveal that the introduction of metallic tin or metallic nickel can improve the rate performance and cycling performance of the composites. The above results prove that the as-prepared Sn–Ni/graphite sheets possess high rate capability and good cycling performance for potential application in lithium ion batteries.
Electrochemical impedance spectra (EIS) measurements were recorded for the graphite sheets, Sn/graphite sheets, Ni/graphite sheets and Sn–Ni/graphite sheets after 3 cycles to further expound the electrochemical kinetics. As shown in Fig. 6b, both of the Nyquist plots display a semicircle in the high frequency region and a sloping straight line in the low frequency region. The semicircle implies the charge-transfer process between the active material and the electrolyte (Rct).31 Compared to the graphite sheets and the Sn/graphite sheets, the impedance value of the Ni/graphite sheets and the Sn–Ni/graphite sheets is much smaller in the high-medium frequency region. Obviously, the resistance of the Sn–Ni/graphite sheets is the smallest because of the introduction of nickel, which could be attributed to the high conductivity of Ni and the synergistic effects between each component effectively decreasing the resistance of the composites. The straight line indicates the typical characteristics of the Warburg impedance Zw, generally representing the presence of Li+ diffusion in the coatings of the active material.39,40 It can be seen that the different electrodes exhibit different slopes, suggesting lithium ions have different diffusion coefficients in the graphite sheets, Sn/graphite sheets, Ni/graphite sheets and Sn–Ni/graphite sheets.41 The curves of all the as-prepared materials have a similar slope, suggesting all of them possess good ion diffusion performance. The results above show that the introduction of nickel can reduce the impedance of the composites and remarkably enhance the electron and Li+ ion transport performance of the Sn–Ni/graphite sheets in LIBs.
4. Conclusions
In summary, Sn–Ni/graphite sheet materials are successfully synthesized by a simple electroless plating method followed by heat-treatment. The structure design not only integrates the excellent conductivity of Ni and graphite sheets, but also integrates the buffering effects of Ni and graphite sheets, which is proven to be an effective way to improve the electrochemical performance of anode materials for LIBs. The results show that the rate performance and the cycling performance of the composite are improved significantly and a capacity of 802.4 mA h g−1 is obtained after rate cycling and continued cycling for another 100 cycles. Facile synthesis of the Sn–Ni/graphite sheets by electroless plating provides a strategy for improving the electrochemical performance of anode materials for Li-ion batteries.Conflicts of interest
There are no conflicts to declare.Acknowledgements
This research was supported by the Hubei Province Key Science and Technology Support Program (No. 2015BCE072), the Outstanding Young Science and Technology Innovation Team Program of Hubei Province Colleges and Universities (No. T201514), the Scientific Research and Technological Development Program of Guilin (2016010502-2), the “1020” Innovation-Driven Plan of Guilin (20160211), and the Department of Education of Guangxi Zhuang Autonomous Region (A-2905-14-000008).References
- K. Cao, P. Li, Y. Zhang, T. Chen, X. Wang, S. Zhang, J. Liu and H. Wang, Nano Energy, 2017, 40, 187–194 CrossRef CAS.
- J. Chen and K. Yano, ACS Appl. Mater. Interfaces, 2013, 5, 7682–7687 CAS.
- Y. Cheng, Z. Yi, C. Wang, Y. Wu and L. Wang, Chem. Eng. J., 2017, 330, 1035–1043 CrossRef CAS.
- J. Leng, Z. Wang, X. Li, H. Guo, H. Li, K. Shih, G. Yan and J. Wang, J. Mater. Chem. A, 2017, 5, 14996–15001 CAS.
- T. Li, X. Li, Z. Wang, H. Guo, Y. Li and J. Wang, J. Mater. Chem. A, 2017, 5, 13469–13474 CAS.
- W. Yue, S. Yang, Y. Ren and X. Yang, Electrochim. Acta, 2013, 92, 412–420 CrossRef CAS.
- D. B. Polat, J. Lu, A. Abouimrane, O. Keles and K. Amine, ACS Appl. Mater. Interfaces, 2014, 6, 10877–10885 CAS.
- J. Qin, X. Zhang, N. Zhao, C. Shi, E. Liu, J. Li and C. He, RSC Adv., 2014, 4, 49247–49256 RSC.
- H. Liu, R. Hu, W. Sun, M. Zeng, J. Liu, L. Yang and M. Zhu, J. Power Sources, 2013, 242, 114–121 CrossRef CAS.
- P. Wu, H. Wang, Y. Tang, Y. Zhou and T. Lu, ACS Appl. Mater. Interfaces, 2014, 6, 3546–3552 CAS.
- X. Shi, H. Song, A. Li, X. Chen, J. Zhou and Z. Ma, J. Mater. Chem. A, 2017, 5, 5873–5879 CAS.
- Z. Wang, S. Luo, F. Chen, D. Wang, Y. Liu, X. Qi, C. Shi and N. Zhao, RSC Adv., 2016, 6, 54718–54726 RSC.
- K. Wang, Y. Huang, D. Wang, Y. Zhao, M. Wang, X. Chen and H. Wu, RSC Adv., 2016, 6, 23260–23264 RSC.
- Z. Yan, Q. Hu, G. Yan, H. Li, K. Shih, Z. Yang, X. Li, Z. Wang and J. Wang, Chem. Eng. J., 2017, 321, 495–501 CrossRef CAS.
- J. Wang, G. Zhang, Z. Liu, H. Li, Y. Liu, Z. Wang, X. Li, K. Shih and L. Mai, Nano Energy, 2018, 44, 272–278 CrossRef CAS.
- Q.-c. Pan, Y.-g. Huang, H.-q. Wang, G.-h. Yang, L.-c. Wang, J. Chen, Y.-h. Zan and Q.-y. Li, Electrochim. Acta, 2016, 197, 50–57 CrossRef CAS.
- D. Jiang, X. Ma and Y. Fu, J. Appl. Electrochem., 2012, 42, 555–559 CrossRef CAS.
- B. Lee, S. C. Han, M. Oh, M. S. Lah, K.-S. Sohn and M. Pyo, Electrochim. Acta, 2013, 113, 149–155 CrossRef CAS.
- M. P. B. Glazer, J. Wang, J. Cho, J. D. Almer, J. S. Okasinski, P. V. Braun and D. C. Dunand, J. Power Sources, 2017, 367, 80–89 CrossRef CAS.
- P. Dou, Z. Cao, J. Zheng, C. Wang and X. Xu, J. Alloys Compd., 2016, 685, 690–698 CrossRef CAS.
- H. Shi, A. Zhang, X. Zhang, H. Yin, S. Wang, Y. Tang, Y. Zhou and P. Wu, Nanoscale, 2018, 10, 4962–4968 RSC.
- R. Hu, H. Liu, M. Zeng, H. Wang and M. Zhu, J. Mater. Chem., 2011, 21, 4629–4635 RSC.
- D. Wang, X. Li, J. Yang, J. Wang, D. Geng, R. Li, M. Cai, T. K. Sham and X. Sun, Phys. Chem. Chem. Phys., 2013, 15, 3535–3542 RSC.
- J. Wang, D. Li, X. Fan, L. Gou, J. Wang, Y. Li, X. Lu and Q. Li, J. Alloys Compd., 2012, 516, 33–37 CrossRef CAS.
- S. Liang, X. Zhu, P. Lian, W. Yang and H. Wang, J. Solid State Chem., 2011, 184, 1400–1404 CrossRef CAS.
- Z. Wen, S. Cui, H. Kim, S. Mao, K. Yu, G. Lu, H. Pu, O. Mao and J. Chen, J. Mater. Chem., 2012, 22, 3300–3306 RSC.
- H. Guo, H. Zhao and X. Jia, Electrochem. Commun., 2007, 9, 2207–2211 CrossRef CAS.
- J. Chen, S. J. Bull, S. Roy, A. Kapoor, H. Mukaibo, H. Nara, T. Momma, T. Osaka and Y. Shacham-Diamand, Tribol. Int., 2009, 42, 779–791 CrossRef CAS.
- L. Ouyang, J. Huang, H. Wang, J. Liu and M. Zhu, Mater. Chem. Phys., 2017, 200, 164–178 CrossRef CAS.
- S.-W. Woo, N. Okada, M. Kotobuki, K. Sasajima, H. Munakata, K. Kajihara and K. Kanamura, Electrochim. Acta, 2010, 55, 8030–8035 CrossRef CAS.
- B. D. Polat, A. Abouimrane, N. Sezgin, O. Keles and K. Amine, Electrochim. Acta, 2014, 135, 585–593 CrossRef CAS.
- J. Liang, Y. Zhao, L. Guo and L. Li, ACS Appl. Mater. Interfaces, 2012, 4, 5742–5748 CAS.
- H.-Q. Wang, G.-H. Yang, Y.-G. Huang, X.-H. Zhang, Z.-X. Yan and Q.-Y. Li, Mater. Chem. Phys., 2015, 167, 303–308 CrossRef CAS.
- H. Liu, J. Huang, X. Li, J. Liu, Y. Zhang and K. Du, Phys. E, 2012, 44, 1931–1935 CrossRef CAS.
- L.-M. Ang, T. S. Andy Hor, G.-Q. Xu, C.-H. Tung, S. Zhao and J. L. S. Wang, Chem. Mater., 1999, 11, 2115–2118 CrossRef CAS.
- J. Li, M. Moskovits and T. L. Haslett, Chem. Mater., 1998, 10, 1963–1967 CrossRef CAS.
- J. Guerra and M. Herrero, Nanoscale, 2010, 2, 1390–1400 RSC.
- H. Liu, J. Huang, X. Li, J. Liu, Y. Zhang and K. Du, Appl. Surf. Sci., 2012, 258, 4917–4921 CrossRef CAS.
- J. Zhu, D. Wang, L. Wang, X. Lang and W. You, Electrochim. Acta, 2013, 91, 323–329 CrossRef CAS.
- J.-Y. Lin, M.-H. Chou and Y.-C. Kuo, J. Alloys Compd., 2014, 589, 472–478 CrossRef CAS.
- P. Guo, H. Song and X. Chen, Electrochem. Commun., 2009, 11, 1320–1324 CrossRef CAS.
Footnote |
| † Electronic supplementary information (ESI) available. See DOI: 10.1039/c8ra01940a |
| This journal is © The Royal Society of Chemistry 2018 |

