 Open Access Article
A nano-magnetic electrochemical sensor for the determination of mood disorder related substances†
Fernando H. Cincotto *a,
Daniel A. S. Carvalhoa,
Thiago C. Canevarib,
Henrique E. Tomac,
Orlando Fatibello-Filho
 a and
Fernando C. Moraes*a
aChemistry Department, Federal University of São Carlos, 13565-905, São Carlos, SP, Brazil. E-mail: fernandocincotto@gmail.com; fcmoraes@ufscar.br
bEngineering School, Mackenzie Presbyterian University, 01302-907, São Paulo, SP, Brazil
cInstitute of Chemistry, University of São Paulo, 05508-000, São Paulo, SP, Brazil
First published on 16th April 2018
Abstract
The simultaneous electrochemical detection of mood disorder related substances, such as amitriptyline, melatonin and tryptophan, was successfully achieved by using a novel nano-magnetic electrochemical sensor design, encompassing Fe3O4 nanoparticles decorated with carbon quantum dots (MagNPs/Cdots). The magnetic composite was characterized using HR-TEM microscopy, XRD and Raman spectroscopy, and was applied onto a glassy carbon electrode using a miniature neodymium magnet. The determination of amitriptyline, melatonin and tryptophan was performed by monitoring oxidation promoted by MagNPs/Cdots in BR-buffer at pH 3.0, which proceeded according to well-defined differential pulse voltammetry peaks, with detection limits of 5.9, 4.4 and 4.2 nmol L−1, respectively. No significant interference was seen from biological interferents such as uric acid, ascorbic acid, dopamine, estriol and 17β-estradiol. The magnetic hybrid material was highly stable in solution, opening exciting opportunities for the development of low cost and practical electrochemical sensors for the determination of mood disorder related substances in real clinical samples.
Introduction
More than 300 million people in the world are affected by depression, which is often associated with symptoms such as anxiety, insomnia or other mood disorders.1 Generally, the clinical symptoms of depression generate serious psychological and metabolic disorders in the human body.2–4 This can lead to a variation in the levels of several substances that regulate the human nervous system, such as serotonin, tryptophan and melatonin.5,6 Melatonin (ML) is a hormone secreted by the pineal gland and has the function of regulating the circadian biological clock that controls neural physiologic processes.7 During depression, the ML concentration is decreased, causing insomnia or sleep disorders.8 Another important substance that has variations in its levels in the human body is tryptophan (TP). TP is an amino acid that acts on protein synthesis, and together with other substances, like magnesium and vitamins B3, B6 and B12, produces the neurotransmitter serotonin.9 Subsequently, serotonin in the presence of folic acid and vitamins B5, B6 and B12 produces melatonin.10 Thus, an individual with depression presents a harmful cycle, in which there is a drastic decrease in the level of tryptophan, minimizing serotonin levels and compromising ML secretion, leading to several mood disorders. In order to treat depression cases or minimize its effects, antidepressants such as amitriptyline (AMP) have been used. AMP belongs to the tricyclic class of drugs, and has a two-mode action in humans. In the pre-synaptic mode, it acts directly on serotonin blocking11 and in post-synaptic mode, it regulates levels of beta-adrenergic, histamine and cholinergic blockers. However, AMP, similar to many other tricyclic antidepressants, has several side-effects.12 Depending on the dosage of AMP in the blood, it may affect the production of melatonin and tryptophan, worsening some symptoms such as insomnia, seizures, and respiratory problems.13,14 Therefore, in this case, an AMP controlled dosage is required in the human body.Tadayon et al.15 developed an electrochemical sensor based on a nitrogen doped graphene/CuCo2O4 nanocomposite for the simultaneous determination of melatonin and tryptophan. The developed sensor was then employed for the simultaneous determination of target analytes with a linear range of 0.010–3.0 μM, using differential pulse voltammetry. Detection limits of 0.0049 and 0.0041 μM were achieved for melatonin and tryptophan, respectively. In another work, Zeinali et al.16 developed a sensor for the simultaneous determination of tryptophan and melatonin. The proposed sensor was an ionic liquid carbon paste electrode modified with reduced graphene oxide decorated with SnO2–Co3O4 nanoparticles. A linear response was obtained in the range of 0.02 to 6.00 μmol L−1 with detection limits of 4.1 and 3.2 nmol L−1 for melatonin and tryptophan, respectively.
Carbon nanoparticles are increasingly being used as electrode modifiers, because they enlarge the active surface area, introducing new functionalities and also improving interfacial electron transfer.17–19 A special kind of carbon material that has attracted attention in recent years is carbon quantum dots (Cdots). This nanomaterial consists of very small spherical nanoparticles (<10 nm), in which carbon atoms are linked by a combination of sp2 and sp3 bonds. Some relevant characteristics of Cdots are their surface stabilization by carboxylic groups, and that they exhibit a high surface area, low toxicity and outstanding optical properties (e.g., stable and strong fluorescence emission).20 For this reason, Cdots are suitable for application to surface modification procedures. In addition, their very small diameters may also lead to quantum confinement effects.
On the other hand, magnetic Fe3O4 nanoparticles (MagNPs)21 form another relevant class of nanomaterial, introducing additional advantages such as: non-toxic behavior and facile functionalization;22 a large specific surface area which allows binding to large amounts of (bio)molecules; and good magnetic performance when submitted to a miniature, external magnet. Furthermore, a large number of hydroxyl and carboxyl groups can be found on the surface of MagNP prepared in the aqueous phase, favouring the binding of molecules to their surface and facilitating electron transfer at the electrode/solution interface.23
In the present work, a combination of Fe3O4 magnetic nanoparticles (MagNPs) with carbon nanoparticles (Cdots) was used to generate a versatile electrocatalytic agent, which can be kept on the glassy carbon electrode surface through the application of an external, miniature magnet. This new design of nano-magnetic sensor was employed to quantify amitriptyline in the presence of melatonin and tryptophan, using the nano-magnetic electrochemical sensor, revealing good electroanalytical performance.
Experimental
Reagents
All solutions were prepared using purified water from a Barnstead Nanopure system (Thermo Scientific, USA) with a resistivity ≥18.2 MΩ cm. The following analytical grade reagents were purchased from Aldrich and used without further purification: FeSO4·7H2O (≥99.0%); FeCl3 (97%); KOH (≥85%); tetrabutylammonium chloride (≥97.0%); acetone (≥99.9%); amitriptyline (reference standard); melatonin (≥98%); tryptophan (reference standard); H3BO3 (≥99.5%); and H3PO4 (analytical grade). CH3COOH (reference standard) and n-propanol (anhydrous, 99.7%) were purchased from Synth.Apparatus and electrochemical measurements
X-ray powder diffraction (XRD) analysis was performed on a Bruker Phaser diffractometer using a Cu Kα radiation source (λ = 1.54 Å). Raman spectra were recorded using a Horiba/Join YvonLabran dispersive Raman spectrometer. The spectra were collected over a range from 0 to 2500 cm−1, for 10 s and 10 cycles of exposure with 520 nm excitation. High-resolution transmission electron microscopy (HR-TEM) images were obtained with a JEOL transmission electron microscope, operating at 200 kV. Samples of the nanomaterials were dispersed in 1-propanol and then the solutions were dripped onto copper grids covered with ultra-thin carbon film. The electrochemical measurements were performed using an Autolab model PGSTAT 128N potentiostat (Eco Chemie, Utrecht, Netherlands). The electrochemical cell used was based on an arrangement of three electrodes: a working glassy carbon electrode (GCE), encompassing a disk-shaped magnet from behind (as displayed in Scheme 1), for concentrating MagNPs or MagNPs/Cdots, separately, on the surface; Ag/AgCl (3.0 mol L−1 KCl), as a reference electrode; and a platinum wire, as the auxiliary electrode. Cyclic voltammetry (performed over a potential range from 0.0 to 1.15 V vs. Ag/AgCl, at a scan rate of 20.0 mV s−1), differential pulse voltammetry (performed over a potential range from 0.4 to 1.1 V vs. Ag/AgCl in 3.0 mol L−1 KCl), step potential, pulse amplitude and scan rate measurements were carried out in 5.0 mL of 0.1 mol L−1 Briton–Robinson buffer solution (BR), at pH 3.0.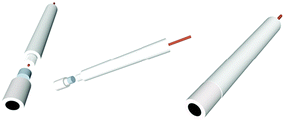 | ||
| Scheme 1 Architectural illustration of the working electrode, showing a disk-shaped miniature neodymium magnet behind the glassy carbon. | ||
Synthesis of the MagNPs magnetic nanoparticles
The iron oxide magnetic nanoparticles (MagNPs) were synthesized using a co-precipitation method.24 First, 500 mL of an aqueous solution was prepared via mixing 0.05 mol L−1 FeCl3 with 0.025 mol L−1 FeSO4·7H2O, under stirring and N2 was bubbled for 30 min. Then, 5.0 g of KOH was added and the solution was kept under stirring for 1 h. After this, 5.0 mL of tetrabutylammonium chloride was added and the mixture was kept under stirring for another 10 min. Finally, the MagNPs nanoparticles were separated using an external magnet and washed with two aliquots of acetone and two aliquots of water.Preparation of the MagNPs/Cdots hybrid material
Carbon nanoparticles (Cdots) were synthesized via the amperometrically controlled electrolysis of a propanol solution, for 8 h, as previously reported.25 This method produces highly stable, electroactive and luminescent carbon nanoparticles, surface functionalized with oxygenated groups, in the form of special carboxylates. The association of Cdots with MagNPs was carried out according to the following procedure. 3.0 g of MagNPs were dispersed in 10.0 mL of the n-propanol containing Cdots. The mixture was placed in an ultrasonic bath for 30 min and kept in a closed bottle for 24 h. The anchoring of Cdots on the MagNPs surfaces proceeds spontaneously because of the favourable interactions promoted by the surface functional groups, as well as the electrostatic attraction from the remaining tetrabutylammonium species on the MagNPs surfaces. This new material was denominated MagNPs/Cdots. After association, MagNPs/Cdots were magnetically confined and washed with water in order to remove any excess free Cdots from the hybrid material.Electrode preparation
To prepare the electrode, the GCE was polished to a mirror-like finish using 0.3 μm alumina slurry and sonicated in ultrapure water and ethanol. The electrode was first coated with MagNPs/Cdots by depositing a 10 μL aliquot of a 0.5 mg mL−1 aqueous dispersion of the nanocomposite on the electrode surface. The electrode was immersed in water to remove the particles that were not fixed by the magnet contained behind the electrode (see Scheme 1). For comparison, GCE/MagNPs without Cdots were also prepared as described above.Results and discussion
Characterization of nanomaterials
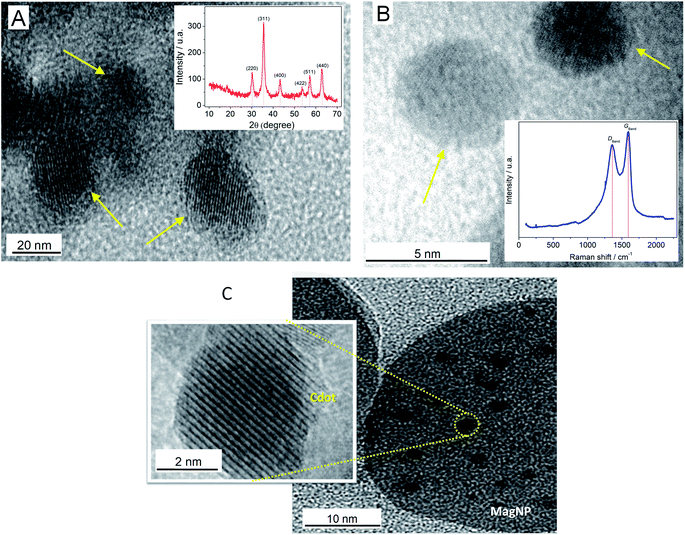
The iron oxide magnetic nanoparticles (MagNPs), Cdots and MagNPs/Cdots composite were characterized using HR-TEM microscopy, XRD patterns and Raman spectroscopy, as shown in Fig. 1.A HR-TEM micrograph of MagNPs is shown in Fig. 1A, with corresponding crystalline spherical nanoparticles with an average size of 20 nm indicated by arrows. It is possible to observe the interplanar distance, which is close to 0.30 nm, corresponding to the (220) plane of the spinel structure presented by MagNPs.21 The inset of Fig. 1A shows the XRD pattern of the iron oxide (Fe3O4) magnetic nanoparticles (MagNPs). The fingerprint peaks of Fe3O4 were observed in the following 2θ sequence: (220) at 30.1°; (311) at 35.5°; (400) at 43.2°; (422) at 53.5°; (511) at 57.2°; and (440) at 62.8°. These results are consistent with those reported in the literature26,27 for Fe3O4.
Fig. 1B shows an HR-TEM microscopy image of Cdots, as prepared, exhibiting an average size smaller than 5.0 nm and a crystalline structure with an interplanar distance close to 0.2 nm, corresponding to the (102) diffraction plane, which is attributed to the graphitic phase.20 A typical Raman spectrum of Cdots is exhibited in the inset of Fig. 1B. The D and G bands at 1360 and 1593 cm−1, respectively, can be seen, with an ID/IG ratio estimated at 0.89. The DBand magnitude could be related to the presence of defects attributed to the oxygenated functional groups on the material surface and the small size of the particles.28,29 Comparing with other reports in the literature,30,31 the ID/IG ratio, and the shapes and positions of the appearing bands in the spectrum are coherent with the nature of Cdots. A HR-TEM microscopy image of the MagNPs/Cdot material is shown in Fig. 1C. The Fe3O4 magnetic nanoparticles have a size close to 30.0 nm, and it is possible to visualize that Cdots are supported on MagNPs.
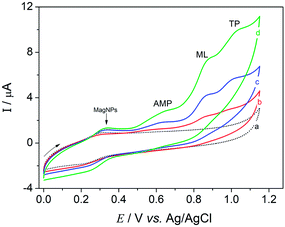
The electrochemical behavior of a 10.0 μmol L−1 mixture containing amitriptyline (AMP), melatonin (ML) and tryptophan (TP) was evaluated using a bare GC electrode, GC/MagNPs and GC/MagNPs/Cdots. The cyclic voltammograms shown in Fig. 2 were obtained in 0.1 mol L−1 Britton–Robinson buffer solution (BR-buffer), at pH 3.0, over a potential range from 0.0 to +1.15 V, with a scan rate of 20 mV s−1.
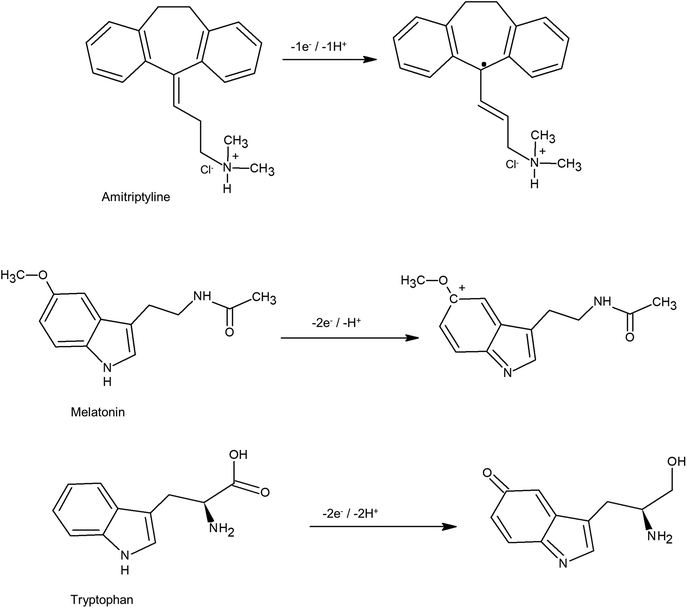
In Fig. 2 (curve a), no electrochemical processes were observed in the voltammetric response of GC/MagNPs/Cdots in the absence of the AMP, ML and TP standard solution. However, in curve (d), which results from GC/MagNPs/Cdots, the electrochemical response in the presence of a solution containing 10.0 μmol L−1 AMP, ML and TP reveals three well-defined irreversible oxidation peaks at +0.63 V, +0.85 V, +1.01 V, corresponding to the oxidation of AMP, ML and TP, respectively. It has been reported32–34 that these electrochemical processes correspond to the oxidation processes represented in Scheme 2.
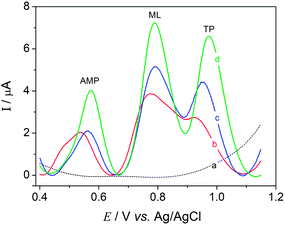
Differential pulse voltammetry (DPV) experiments were carried out in order to obtain a better observation of the voltammetric processes involved in the simultaneous quantification of AMP, ML and TP. They used the DPV parameters of a potential range from 0.0 to +1.2 V, a potential scan rate of 5 mV s−1, a step potential of 2 mV, and a pulse amplitude of 50 mV. The measurements were performed in 0.1 mol L−1 BR-buffer at pH 3.0 containing a 10.0 μmol L−1 mixed solution of amitriptyline, melatonin and tryptophan.
It can be observed in Fig. 3 that the voltammetric profiles exhibit peaks at almost constant potentials around +0.57 V, 0.79 V, and 0.97 V vs. Ag/AgCl, corresponding to AMP, ML and TP species, respectively, for all electrodes studied. However, the GC/MagNPs/Cdots composite electrode (curve d) displayed a higher anodic current magnitude for the mixed solution in comparison to the current observed from the other electrodes. GC/MagNPs/Cdots yielded excellent peak separation, accompanied by an almost 2.5-fold increase in the oxidation peak currents from the analytes, as compared to the electrode prepared in the absence of Cdots (curve c). The current increase seems to reflect the increase in the electroactive surface area from the MagNPs/Cdots composite. Such properties make the GCE/MagNPs/Cdots composite electrode a promising choice for the simultaneous determination of amitriptyline, melatonin and tryptophan in real samples.
The analytical technique used for the simultaneous quantification of AMP, ML and TP was DPV. Thus, in order to observe the improvement from electrode modification, the influence of the differential pulse voltammetry (DPV) parameters was then investigated. First, the effect of potential scan rate was studied over a range from 2.0 to 15 mV s−1, with the step potential kept constant at 2 mV with an amplitude of 50 mV. A scan rate of 5 mV s−1 was chosen because it exhibited a higher anodic peak current (ESI Fig. 1S†). Higher scan rates caused a loss of peak definition and a lower anodic peak current from mixture oxidation. The next step was to keep the step potential constant at 2 mV and the scan rate at 5 mV s−1 while the amplitude was varied from 10 to 100 mV (ESI Fig. 2S†). No significant increase in peak width was observed for mixture oxidation, even at amplitudes greater than 50 mV. Since the peak currents were proportional to the increase in amplitude, 50 mV was chosen as the optimized DPV amplitude. The final experiment involved holding the amplitude constant at 50 mV and the potential scan rate at 5 mV s−1, and studying the effects of step potential changes over a range from 1 to 10 mV (ESI Fig. 3S†). For step potentials greater than 2 mV, deformation of the voltammetric profiles was observed and the anodic peak current for a mixed solution decreased in height, so a step potential increment of 2 mV was chosen.
Selectivity studies
The ability to determine a mixed solution of amitriptyline, melatonin and tryptophan in the presence of other compounds was investigated. The selectivity of the GC/MagNPs/Cdots composite was evaluated by measuring the DPV responses generated by 4 different potential interfering substances at a 20 μmol L−1 concentration, and comparing these with that obtained for a 10 μmol L−1 concentration of the mixture, under similar measuring conditions. Very low analytical signals were recorded for ascorbic acid (0.6%), uric acid (0.8%), dopamine (1.4%), estriol (0.2%) and 17β-estradiol (0.3%), suggesting the high selectivity of the GC/MagNPs/Cdots composite electrode (ESI Table 1S†).Analytical characteristics
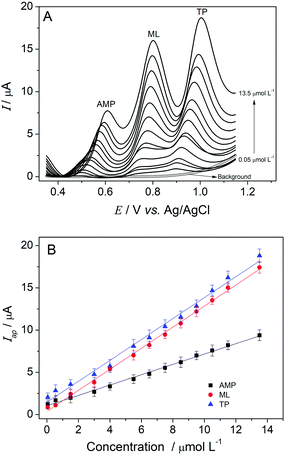
DPV experiments were carried out in triplicate using the optimized experimental parameters to obtain an analytical curve for the simultaneous determination of amitriptyline, melatonin and tryptophan with the GC/MagNPs/Cdots composite electrode in 0.1 mol L−1 BR-buffer at pH 3.0. To evaluate the performance of the composite, determinations of individual analytes were performed in the presence of the other two studied substances. The analytical curve obtained for amitriptyline exhibited a linear range from 0.05 to 7.5 μmol L−1 (R2 = 0.9975) in the presence of melatonin and tryptophan, each at 4.0 μmol L−1, as shown in ESI Fig. 4S(A and B).† The limit of detection (LOD) for amitriptyline was calculated as 8.1 nmol L−1, and a sensitivity of 0.37 μA μmol−1 L−1 was obtained. Similarly, an analytical curve for melatonin over a range from 0.05 to 12.50 μmol L−1 (R2 = 0.9988) was performed in the presence of amitriptyline and tryptophan, each at 4.0 μmol L−1 (ESI Fig. 5S(A and B)†). The LOD for melatonin was calculated as 7.8 nmol L−1 and a sensitivity of 0.38 μA μmol−1 L−1 was obtained. Also for collecting individual analytical curves in the presence of the other two analytes, an analytical curve for tryptophan over a range from 0.05 to 19.50 μmol L−1 (R2 = 0.9989) was obtained in the presence of amitriptyline and melatonin, each at 4.0 μmol L−1 (ESI Fig. 6S(A and B)†). The LOD for tryptophan was calculated as 6.0 nmol L−1 and a sensitivity of 0.49 μA μmol−1 L−1 was obtained.Fig. 4 shows the DPV response for the simultaneous determination of amitriptyline melatonin and tryptophan using the GC/MagNPs/Cdots composite electrode in 0.1 mol L−1 BR-buffer at pH 3.0. The study was conducted between −0.35 and 1.25 V, and the electrochemical oxidation of the analytes was performed at variable concentrations, each over the range from 0.05 to 13.5 μmol L−1.
As in the individual determinations of the analytes, it was possible to observe an increase in the analytical signal upon an increase in the concentration of each analyte (amitriptyline, melatonin and tryptophan). Fig. 4B shows analytical curves for each analyte, determined simultaneously in the same sample matrix.
The following equations have been obtained for the determination of each analyte (amitriptyline, melatonin and tryptophan) in the sample matrix:
| (AMP) Iap (μA) = 1.04 (μA) + 0.61 (μA μmol−1 L−1) [amitriptyline] (μmol L−1), with R2 = 0.996 and n = 13 |
| (ML) Iap (μA) = 0.37 (μA) + 1.24 (μA μmol−1 L−1) [melatonin] (μmol L−1), with R2 = 0.998 and n = 13 |
| (TP) Iap (μA) = 1.46 (μA) + 1.23 (μA μmol−1 L−1) [tryptophan] (μmol L−1), with R2 = 0.995 and n = 13 |
The detection limits for the simultaneous determination of AMP, ML and TP were calculated as recommended by IUPAC,35 using the 3σ/slope ratio, (where σ is the standard deviation of the mean current over 10 differential pulse voltammograms of a blank), and they were respectively equal to 5.9 nmol L−1 for amitriptyline, 4.4 nmol L−1 for melatonin and 4.2 nmol L−1 for tryptophan.
Table 1 summarizes a comparison of the analytical characteristics of different electrochemical sensors described previously for amitriptyline, melatonin and tryptophan determination, and the results obtained in this work.
| Material | Amitriptyline | Melatonin | Tryptophan | Reference | |||
|---|---|---|---|---|---|---|---|
| Linear range (μmol L−1) | LOD (μmol L−1) | Linear range (μmol L−1) | LOD (μmol L−1) | Linear range (μmol L−1) | LOD (μmol L−1) | ||
a LOD: limit of detection; AuNPs@bPEI-CHS![[thin space (1/6-em)]](https://www.rsc.org/images/entities/char_2009.gif) : :![[thin space (1/6-em)]](https://www.rsc.org/images/entities/char_2009.gif) Nafion-gold nanoparticles@branched polyethyleneimine-derived carbon hollow spheres; AMT-MT: amitriptyline-molybdotungstate; GRT/SiO2/Al2O3/Nb2O5/DNA: graphite and silica modified with niobium oxide, alumina and DNA; SnO2–Co3O4@rGO/IL/CPE: ionic liquid carbon paste electrode modified with SnO2–Co3O4 and reduced graphene oxide; CuCo2O4/N-RGO/CPE: nitrogen-doped graphene nanosheets/CuCo2O4 nanoparticles/carbon paste electrode; and ZnFe2O4 NPs/CPE: carbon paste electrode modified with zinc ferrite nanoparticles. Nafion-gold nanoparticles@branched polyethyleneimine-derived carbon hollow spheres; AMT-MT: amitriptyline-molybdotungstate; GRT/SiO2/Al2O3/Nb2O5/DNA: graphite and silica modified with niobium oxide, alumina and DNA; SnO2–Co3O4@rGO/IL/CPE: ionic liquid carbon paste electrode modified with SnO2–Co3O4 and reduced graphene oxide; CuCo2O4/N-RGO/CPE: nitrogen-doped graphene nanosheets/CuCo2O4 nanoparticles/carbon paste electrode; and ZnFe2O4 NPs/CPE: carbon paste electrode modified with zinc ferrite nanoparticles. |
|||||||
| AuNPs@bPEI-CHS | 0.1–700.0 | 0.034 | — | — | — | — | 36 |
| AMT-MT | 100.0–10![[thin space (1/6-em)]](https://www.rsc.org/images/entities/char_2009.gif) 000.0 000.0 |
67.3 | — | — | — | — | 37 |
| GRT/SiO2/Al2O3/Nb2O5/DNA | 10.0–80.0 | 0.13 | — | — | — | — | 38 |
| SnO2–Co3O4@rGO/IL/CPE | — | — | 0.02–6.00 | 0.0041 | 0.02–6.00 | 0.0032 | 16 |
| CuCo2O4/N-RGO/CPE | — | — | 0.010–3.000 | 0.0049 | 0.010–3.000 | 0.0041 | 15 |
| ZnFe2O4 NPs/CPE | — | — | — | — | 0.1–200.0 | 0.040 | 39 |
| GCE/MagNPs/Cdots | 0.05–13.50 | 0.0059 | 0.05–13.50 | 0.0044 | 0.05–13.50 | 0.0042 | This work |
According to Table 1, the GC/MagNPs/Cdots composite electrode for amitriptyline, melatonin and tryptophan detection shows a good limit of detection and a wide linear range from using the new and easy-to-prepare nanomaterial. This work represents the first proposal for an electrochemical sensor for the simultaneous detection of amitriptyline, melatonin and tryptophan, suggesting the potential to improve the selectivity of this sensor in comparison to others based on non-selective nanomaterials.
The inter-assay precision (reproducibility) of the GC/MagNPs/Cdots composite electrode was measured from eleven experiments, in which each experiment consisted of seven sequential DPV voltammograms. These measurements were performed on different days. The DPV voltammograms were performed in 0.1 mol L−1 BR-buffer, at pH 3.0, containing a 10.0 μmol L−1 mixed solution of amitriptyline, melatonin and tryptophan. The RSD was calculated as 2.1%. In addition, intra-assay precision tests (repeatability) were performed from eleven DPV voltammograms of that same solution. The RSD was found to be 0.85%. Another important result is that the sensor remained stable, exhibiting the same electrochemical response for more than 3 weeks (from about thirty determinations using immobilized material on the electrode surface). The electrode was stored in a desiccator when not in use.
Conclusions
The hybrid particles synthesized (MagNPs/Cdots) were composed of magnetic Fe3O4 (particles with an average diameter size of 20 nm) decorated with carbon dots (Cdots) (crystalline structure and a diameter of around 5.0 nm), as shown using HR-TEM microscopy, XRD patterns and Raman spectroscopy. The magnetic hybrid material presented a good electrochemical response during the simultaneous electrochemical detection of the amitriptyline (AMP) antidepressant drug, in the presence of the melatonin (ML) hormone and tryptophan (TP) amino acid. The MagNP/Cdot hybrid material showed high sensitivity and excellent selectivity for such species, with a low detection limit of 5.9 nmol L−1 for amitriptyline, 4.4 nmol L−1 for melatonin, and 4.2 nmol L−1 for tryptophan. No significant interference was observed from potential biological interferents such as uric acid, ascorbic acid, dopamine, estriol and 17β-estradiol. In addition, the magnetic hybrid material was highly stable in solution, and can suggest exciting perspectives for developing electrochemical sensors for the determination of AMP, ML and TP in real clinical samples.Conflicts of interest
There are no conflicts to declare.Acknowledgements
The authors gratefully acknowledge the Brazilian agencies FAPESP for funding resources to Cincotto, F. H. (2016/16565-5), Moraes, F. C. (2016/12926-3), Canevari, T. C. (2016/12519-9), Toma, H. E. (2013/24725-4), Fatibello-Filho (2011/13312-5), CAPES and CNPq (444150/2014-5, 400412/2016-0) and Mackpesquisa for financial support.References
- United Nations News Centre, http://www.un.org/apps/news/story.asp?NewsId=56230#.WdI3mGhSwdW 2017
.
- S. J. Mathew and M. Lijffijt, Am. J. Psychiatry, 2017, 174, 3–5 CrossRef PubMed
.
- A. Pan, N. Keum, O. I. Okereke, Q. Sun, M. Kivimaki, R. R. Rubin and F. B. Hu, Diabetes Care, 2012, 35, 1171–1180 CrossRef PubMed
.
- A. Pan and F. B. Hu, Response to Comment on: Pan et al. Bidirectional association between depression and metabolic syndrome: A systematic review and meta-analysis of epidemiological studies, Diabetes Care, 2012, 35, 1171–1180 (Diabetes Care, 2013, 36) CrossRef PubMed
.
- P. Brunault, A. L. Champagne, G. Huguet, I. Suzanne, J. L. Senon, G. Body, E. Rusch, G. Magnin, M. Voyer, C. Réveillère and V. Camus, Psycho-Oncol., 2016, 25, 513–520 CrossRef PubMed
.
- P. J. Cowen, M. Parry-Billings and E. A. Newsholme, J. Affective Disord., 1989, 16, 27–31 CrossRef CAS PubMed
.
- Z. Akpinar, S. Tokgöz, H. Gökbel, N. Okudan, F. Uǧuz and G. Yilmaz, Psychiatry Res., 2008, 161, 253–257 CrossRef CAS PubMed
.
- E. A. Ogłodek, M. J. Just, A. R. Szromek and A. Araszkiewicz, Psychiatry Res., 2016, 68, 945–951 Search PubMed
.
- L. Melamud, D. Golan, R. Luboshitzky, I. Lavi and A. Miller, J. Neurol. Sci., 2012, 314, 37–40 CrossRef CAS PubMed
.
- S. N. Young and M. Leyton, Pharmacol., Biochem. Behav., 2002, 71, 857–865 CrossRef CAS
.
- K. H. Lu and J. Meites, Endocrinology, 1973, 93, 152–155 CrossRef CAS PubMed
.
- D. S. Charney, G. R. Heninger and D. E. Sternberg, Arch. Gen. Psychiatry, 1984, 41, 359–365 CrossRef CAS PubMed
.
- C. B. Brink, J. D. Clapton, B. E. Eagar and B. H. Harvey, J. Neural Transm., 2008, 115, 117–125 CrossRef CAS PubMed
.
- R. I. Shader and D. J. Greenblatt, J. Clin. Psychopharmacol., 1987, 7, 65 CAS
.
- F. Tadayon and Z. Sepehri, RSC Adv., 2015, 5, 65560–65568 RSC
.
- H. Zeinali, H. Bagheri, Z. Monsef-Khoshhesab, H. Khoshsafar and A. Hajian, Mater. Sci. Eng., C, 2017, 71, 386–394 CrossRef CAS PubMed
.
- F. H. Cincotto, D. L. C. Golinelli, S. A. S. Machado and F. C. Moraes, Sens. Actuators, B, 2017, 239, 488–493 CrossRef CAS
.
- T. M. Prado, F. H. Cincotto, F. C. Moraes and S. A. S. Machado, Electroanalysis, 2017, 29, 1278–1285 CrossRef CAS
.
- E. Povedano, F. H. Cincotto, C. Parrado, P. Díez, A. Sánchez, T. C. Canevari, S. A. S. Machado, J. M. Pingarrón and R. Villalonga, Biosens. Bioelectron., 2017, 89, 343–351 CrossRef CAS PubMed
.
- T. C. Canevari, F. H. Cincotto, M. Nakamura, S. A. S. Machado and H. E. Toma, Anal. Methods, 2016, 8, 7254–7259 RSC
.
- T. C. Canevari, F. H. Cincotto, D. Gomes, R. Landers and H. E. Toma, Electroanalysis, 2017, 29, 1968–1975 CrossRef CAS
.
- V. Serafín, R. M. Torrente-Rodríguez, M. Batlle, P. García
de Frutos, S. Campuzano, P. Yáñez-Sedeño and J. M. Pingarrón, Microchim. Acta, 2017, 1–8, DOI:10.1007/s00604-017-2455-1
.
- P. Yáñez-Sedeño, S. Campuzano and J. M. Pingarrón, Anal. Chim. Acta, 2017, 960, 1–17 CrossRef PubMed
.
- M. Yamaura, R. L. Camilo, L. C. Sampaio, M. A. Macêdo, M. Nakamura and H. E. Toma, J. Magn. Magn. Mater., 2004, 279, 210–217 CrossRef CAS
.
- T. C. Canevari, M. Nakamura, F. H. Cincotto, F. M. De Melo and H. E. Toma, Electrochim. Acta, 2016, 209, 464–470 CrossRef CAS
.
- N. C. C. Lobato, M. B. Mansur and A. De Mello Ferreira, Mater. Res., 2017, 20, 736–746 CrossRef
.
- A. K. Swain, L. Pradhan and D. Bahadur, ACS Appl. Mater. Interfaces, 2015, 7, 8013–8022 CAS
.
- H. Li, Z. Kang, Y. Liu and S. T. Lee, J. Mater. Chem., 2012, 22, 24230–24253 RSC
.
- F. C. Moraes, R. G. Freitas, R. Pereira, L. F. Gorup, A. Cuesta and E. C. Pereira, Carbon, 2015, 91, 11–19 CrossRef CAS
.
- H. Ding, L. W. Cheng, Y. Y. Ma, J. L. Kong and H. M. Xiong, New J. Chem., 2013, 37, 2515–2520 RSC
.
- P. Atienzar, A. Primo, C. Lavorato, R. Molinari and H. García, Langmuir, 2013, 29, 6141–6146 CrossRef CAS PubMed
.
- R. A. De Toledo, L. H. Mazo, M. C. Dos Santos, K. M. Honório, A. B. F. Da Silva and É. T. G. Cavalheiro, Quim. Nova, 2005, 28, 456–461 CrossRef CAS
.
- A. Levent, Diamond Relat. Mater., 2012, 21, 114–119 CrossRef CAS
.
- S. Shahrokhian and L. Fotouhi, Sens. Actuators, B, 2007, 123, 942–949 CrossRef CAS
.
- A. M. Committee, Analyst, 1987, 112, 119 Search PubMed
.
- Z. R. Zad, S. S. H. Davarani, A. R. Taheri and Y. Bide, Biosens. Bioelectron., 2016, 86, 616–622 CrossRef CAS PubMed
.
- N. Rahman and S. Khan, J. Electroanal. Chem., 2016, 777, 92–100 CrossRef CAS
.
- J. P. Marco, K. B. Borges, C. R. T. Tarley, E. S. Ribeiro and A. C. Pereira, J. Electroanal. Chem., 2013, 704, 159–168 CrossRef CAS
.
- S. M. Ghoreishi and M. Malekian, J. Electroanal. Chem., 2017, 805, 1–10 CrossRef CAS
.
Footnote |
| † Electronic supplementary information (ESI) available. See DOI: 10.1039/c8ra01857j |
| This journal is © The Royal Society of Chemistry 2018 |

