
 Open Access Article
 This Open Access Article is licensed under a Creative Commons Attribution-Non Commercial 3.0 Unported Licence
Differential CRABP-II and FABP5 expression patterns and implications for medulloblastoma retinoic acid sensitivity
Song Zhang†
ab,
Huan Liu†a,
Hong Lia,
MoLi Wua,
Yang Yua,
FengZhi Lia and
XiaoXin Cheng *a
*a
aDepartment of Cell Biology and Liaoning Laboratory of Cancer Genetics and Epigenetics, Dalian Medical University, Liaoning 116044, China. E-mail: xiaoxincheng@yahoo.com
bQiqihar Medical University, Heilongjiang 161006, China
First published on 16th April 2018
Abstract
Medulloblastoma (MB) cells exhibit different responses to retinoid acid (RA) for reasons that are poorly understood. RA signaling can be transduced by two approaches that are mediated by cellular retinoic acid-binding protein 2 (CRABP-II) as a tumor-suppressive pathway, and by fatty acid-binding protein 5 (FABP5) as a tumor-promoting pathway. The biological effects of RA on cancer cells are largely determined by the patterns of CRABP-II and FABP5 expression. This study aims to profile the statuses of CRABP-II and FABP5 expression in MB and to evaluate their correlation with RA sensitivities using RA-sensitive (Med-3) and RA-insensitive (UW228-2, UW228-3) MB cells. Our results show that CRABP-II is distinctly expressed and the level of FABP5 is extremely low in Med-3 cells, while the patterns of CRABP-II and FABP5 expression are reversed in UW228-2 and UW228-3 cells. RA up-regulates CRABP-II expression in Med-3 cells, whereas it up-regulates FABP5 expression in the other two cell lines. The FABP5-specific inhibitor BMS309403 increases the RA sensitivity of UW228-2 cells (p < 0.01). Tissue microarray-based immunohistochemical staining showed CRABP-II/FABP5 expression patterns in MB that were variable (CRABP-II−/FABP5−, CRABP-II−/FABP5+, CRABP-II+/FABP5− and CRABP-II+/FABP5+) and imbalanced (CRABP-II↑/FABP5↓ and CRABP-II↓/FABP5↑). MB cases exhibited patterns ofCRABP-II−/FABP5− (12.24%, 6/49), CRABP-II−/FABP5+ (30.61%, 15/49) or CRABP-II↓/FABP5↑ (12.24%, 6/49), implicating unresponsiveness or insensitivity to RA. In conclusion, the ratios of CRABP-II/FABP5 levels are closely related to the RA sensitivities of MB cells. The differential CRABP-II and FABP5 expression patterns are prospective parameters, and of potential value in personalized RA therapy for MB.
Introduction
Medulloblastoma (MB) accounts for about 20% of all central nervous system tumors in children and is characterized by aggressive intracranial growth and high recurrence. Surgery combined with radiotherapy and chemotherapy is the main means of clinical treatment of MB.1 Although advances in radiation oncology and chemotherapy have led to somewhat improved therapeutic outcomes for MB, patients suffer from long-term sequelae and have poor prognoses.2 Studies indicate that MB responds to different drug treatments,3 suggesting that it is necessary to explore the underlying molecular elements that determine its chemo-sensitivities.Retinoic acid (RA), the active metabolite of vitamin A, regulates multiple biological processes including cell proliferation, differentiation, and apoptosis.4 It has been extensively investigated for use in the prevention and treatment of cancer because of its ability to inhibit proliferation and induce cellular differentiation. Evidence has shown that RA can induce apoptosis and suppress growth in several cancers. In clinical practice, RA is successfully used in the treatment of cutaneous T cell lymphoma and acute promyelocytic leukemia.5 However, in some cancers, RA appears to promote, rather than inhibit, cell survival. For example, RA treatment leads to the survival and growth of HaCat cells derived from mammary tumors that arise in MMTV-neu mice.6 Studies in MB cells have reported the ability of RA to induce cell cycle arrest and apoptosis.7 However, in some MB cells, RA can promote cell survival and hyperplasia.8 Thus, it is of clinical value to evaluate the suitability of RA in MB management.
The RA signal can be transduced by two pathways that are mediated by RA receptors (RAR) and peroxisome proliferator-activated receptors β or δ (PPARβ/δ). Whereas transcriptional activation of RAR by RA leads to growth arrest and apoptosis, activation of PPARβ/δ induces the expression of prosurvival genes. Partitioning of RA between RAR versus PPARβ/δ is regulated by the relative levels of two intracellular lipid binding proteins: cellular RA binding protein 2 (CRABP-II) and fatty acid binding protein 5 (FABP5).6 Therefore, the patterns/levels of CRABP-II and FABP5 expression in MBs may determine, at least largely, the RA sensitivities of MB. This notion has been partly proven by our previous findings: that CRABP-II is expressed in RA-sensitive Med-3 but methylated in RA-resistant UW228-2 MB cells.8 However, the statuses of FABP5 expression, as another critical determinant of RA sensitivity in MB cells in vivo and in vitro, remain unknown. It would be of translational value to address this issue because RA can enhance the proliferation of cancer cells when FABP5 becomes predominant.9 The current study thus aims to profile FABP5 expression patterns and the ratios of CRABP-II and FABP5 levels in MB specimens and cell lines.
Materials and methods
Cell culture and RA treatment
A Med-3 MB cell line was kindly provided by the doctors at the Department of Neurosurgery, Kobe University School of Medicine.10 Cell lines for UW228-2 and UW228-3 were established and provided by the Department of Neurological Surgery, University of Washington at Seattle.11 Med-3 cells were cultured in MEM (Invitrogen, California, USA) containing 10% fetal bovine serum (FBS, Gibco Life Science, Grand Island, NY). The UW228-2 and UW228-3 cells were grown in DMEM (Invitrogen) supplemented with 10% FBS at 37 °C with 5% CO2. All-trans retinoic acid (RA; Sigma Aldrich, St. Louis, USA) was dissolved in dimethylsulfoxide (DMSO, Sigma-Aldrich) to a stock concentration of 50 mM and diluted with culture medium to an optimal working concentration of 10 μM. The treatments lasted for 3 d and the cells were observed at 24 h intervals. Cells cultured in conventional medium with 0.2‰ DMSO supplementation were cited as controls. For morphologic evaluation and immunofluorescence (IF) staining, coverslips were put into the dishes before initial cell seeding and collected regularly during the experiments.Cell proliferation assays
Cell viability was evaluated using a 3-(4,5-dimethylthiazol-2-yl)-2,5-diphenyl-tetrazolium bromide (MTT) assay. Cells (5 × 10³ per well) were plated in 96-well flat-bottomed culture plates (Falcon, Becton–Dickinson Labware, Franklin Lakes, NJ, USA) and routinely cultured in 200 μl DMEM medium for 24 h. The cultures were then treated with 10 μM RA for 24, 48 and 72 h. After the treatment, MTT reagent was added to each well and the plate was incubated for 4 h at 37 °C. The plate was left at room temperature until completely dry. DMSO was added and the optical density (OD) of the sample plate was measured at 492 nm in a microplate reader. The result for each experimental condition was verified a minimum of three times.FABP5 inhibitor treatment
Cells were treated with FABP5 inhibitor BMS309403 (Santa Cruz) as described in our previous study.12 Briefly, BMS309403 was dissolved in DMSO (25 mM) and diluted to a working concentration of 25 μM with culture medium. Four experimental groups were set as follows. Group 1: treatment with 1.2‰ DMSO (as a control group); Group 2: 25 μM BMS309403 treatment for 72 h; Group 3: treatment with 10 μM RA for 72 h; and Group 4: 25 μM BMS309403 pretreatment for 6 h followed by 10 μM RA treatment for 72 h. The responses of UW228-2 cells to the treatments were elucidated by MTT cell viability assay. Results were expressed as percentage cell survival relative to control cells (representing 100% survival). Cell counting (Automated Cell Counter, Bio-Rad, Singapore) was performed to evaluate cell growth after treatment.Real-time PCR quantification of CRABP-II and FABP5 expression
After 3 d of RA treatment, total RNA samples were isolated from the cells using Trizol solution (Life Tech, Texas, USA). Then, 1 μg of total RNA was subjected to reverse transcription using PrimeScript™ RT Master Mix (Takara, Dalian Branch, Dalian, China). Real-time quantitative PCR was conducted following the protocol supplied with the SYBR® Premix Dimer Eraser™ kit (Takara, Dalian Branch, Dalian, China). Gene specific primers used in this study for select genes were described previously,13,14 The sequences of primer were as follows: CRABP-II forward 5′-TGCTGAGGAAGATTGCTGTG-3′; CRABP-II reverse 5′-CCCATTTCACCAGGCTCTTA-3′; FABP5 forward 5′-GAGTGGGATGGGAAGGAAAG-3′; FABP5 reverse 5′-GATCCGAGTACAGGTGACATTG-3′; β-actin forward 5′-TGGCACCCAGCACAATGAA-3′; β-actin reverse 5′-CTAAGTCATAGTCCGCCTAGAAGCA-3′. The PCR conditions were 95 °C for 30 s, 40 cycles of 95 °C for 5 s, 55 °C for 30 s, and 72 °C for 30 s. The relative expression of target mRNA was determined using the comparative threshold (CT) method by normalizing target mRNA CT values to those for β-actin (ΔCT). To determine relative expression levels, the following formula was used: ΔΔCT = ΔCT sample −ΔCT calibrator. This value was used to plot the gene expression employing the formula: 2−ΔΔCT.Immunofluorescence staining
Cells cultured on 24 well plates were fixed with 4% paraformaldehyde for immunofluorescence staining. Rabbit polyclonal antibodies against CRABP-II (ProteinTech 10225-1-AP) or FABP5 (ProteinTech 12348-1-AP), were applied overnight at 4 °C. Then the appropriate fluorophore-conjugated secondary antibodies1![[thin space (1/6-em)]](https://www.rsc.org/images/entities/char_2009.gif) :200 (ProteinTech SA00006-2) were applied and the nuclei were counterstained with 4,6 diamidino-2-phenylindole dihydrochloride (Dapi). Controls were performed with species-specific IgG or sera and with inappropriate secondary anti-bodies. Both showed negligible background.
:200 (ProteinTech SA00006-2) were applied and the nuclei were counterstained with 4,6 diamidino-2-phenylindole dihydrochloride (Dapi). Controls were performed with species-specific IgG or sera and with inappropriate secondary anti-bodies. Both showed negligible background.
Protein preparation and western blotting
Cells were harvested in ice-cold lysis buffer (Beyotime P0013B). Equivalent amounts of total protein extracted from each sample were mixed with sample buffer, boiled, and loaded onto SDS polyacrylamide gels. Electrophoretic separation of the extracts was typically performed on 7.5–15% discontinuous acrylamide gels (depending on the molecular weight of the protein of interest) under denaturing conditions. Proteins were then transferred to polyvinylidene fluoride membrane (Amersham, Buckinghamshire, UK) and probed with primary antibodies raised against RAR (Santa Cruz sc551), PPAR (Santa Cruz sc7197), CRABP-II (ProteinTech 10225-1-AP) and FABP5 (12348-1-AP). In addition, an antibody against β-actin (ProteinTech 66009-1) was used as a loading control. Appropriate secondary HRP-conjugated antibodies were used for detection with chemiluminescent ECL reagents (Roche GmbH, Mannheim, Germany).Tissue microarray-based immunohistochemical staining
The protocol of this study was reviewed by the Ethics Committee of Dalian Medical University before experiments commenced. Some 49 paraffin-embedded MB specimens were collected from the Clinical Pathology Departments, the First Affiliated Hospital of Dalian Medical University and Shen-Jing Hospital of China Medical University at Shenyang. Written informed consent was obtained from all patients. This study was approved by the hospital institutional review board (IRB), and was performed in accordance with the ethical guidelines of the Declaration of Helsinki.The expression levels and patterns of CRABP-II and FABP5 in the three subtypes of MB (classical, large cell and nodular) were profiled immunohistochemically, using paraffin-mounted sections of the constructed MB microarrays. The antibodies used were rabbit anti-human CRABP-II (ProteinTech 10225-1-AP) and FABP5 (12348-1-AP) at dilutions of 1:100 and 1:80, respectively. Color reaction was developed using 3, 39-diaminobenzidine tetrahydrochloride (DAB). The sections without the first antibody incubation were used as the background control. Based on the labeling intensity, two independent researchers evaluated the staining results and scored them as negative (−), weakly positive (+), moderately positive (++) and strongly positive (+++).
Statistical analysis
Data were analyzed for statistical significance using one-way analysis of variance (ANOVA) and independent-samples t-tests. Data are presented as the mean ± standard error of the mean (SEM). Values of p < 0.05 were considered statistically significant.Results
Differential responses of MB cells to RA
Hematoxylin-Eosin (HE) staining revealed no morphologic changes in RA-treated UW228-2 and UW228-3 cells, while Med-3 cells showed neuronal-like morphologies with elongated processes (Fig. 1A). In order to assess the effects of RA on cell proliferation, an MTT assay was conducted to test the inhibitory effect at three time points. The results revealed that RA-treated UW228-2 and UW228-3 cells displayed a 1–5% increase in cell viability compared with their control cells at the 24, 48 and 72 h time points (Fig. 1C and D). No statistical significance was identified for UW228-2 or UW228-3 cells (p > 0.05). In contrast, RA-treated Med-3 cells showed distinct growth arrest and decreased fractions of viable cells (p < 0.05). The above results suggest that Med-3 is RA-sensitive while UW228-2 and UW228-3 are RA-resistant or -insensitive medulloblastoma cells.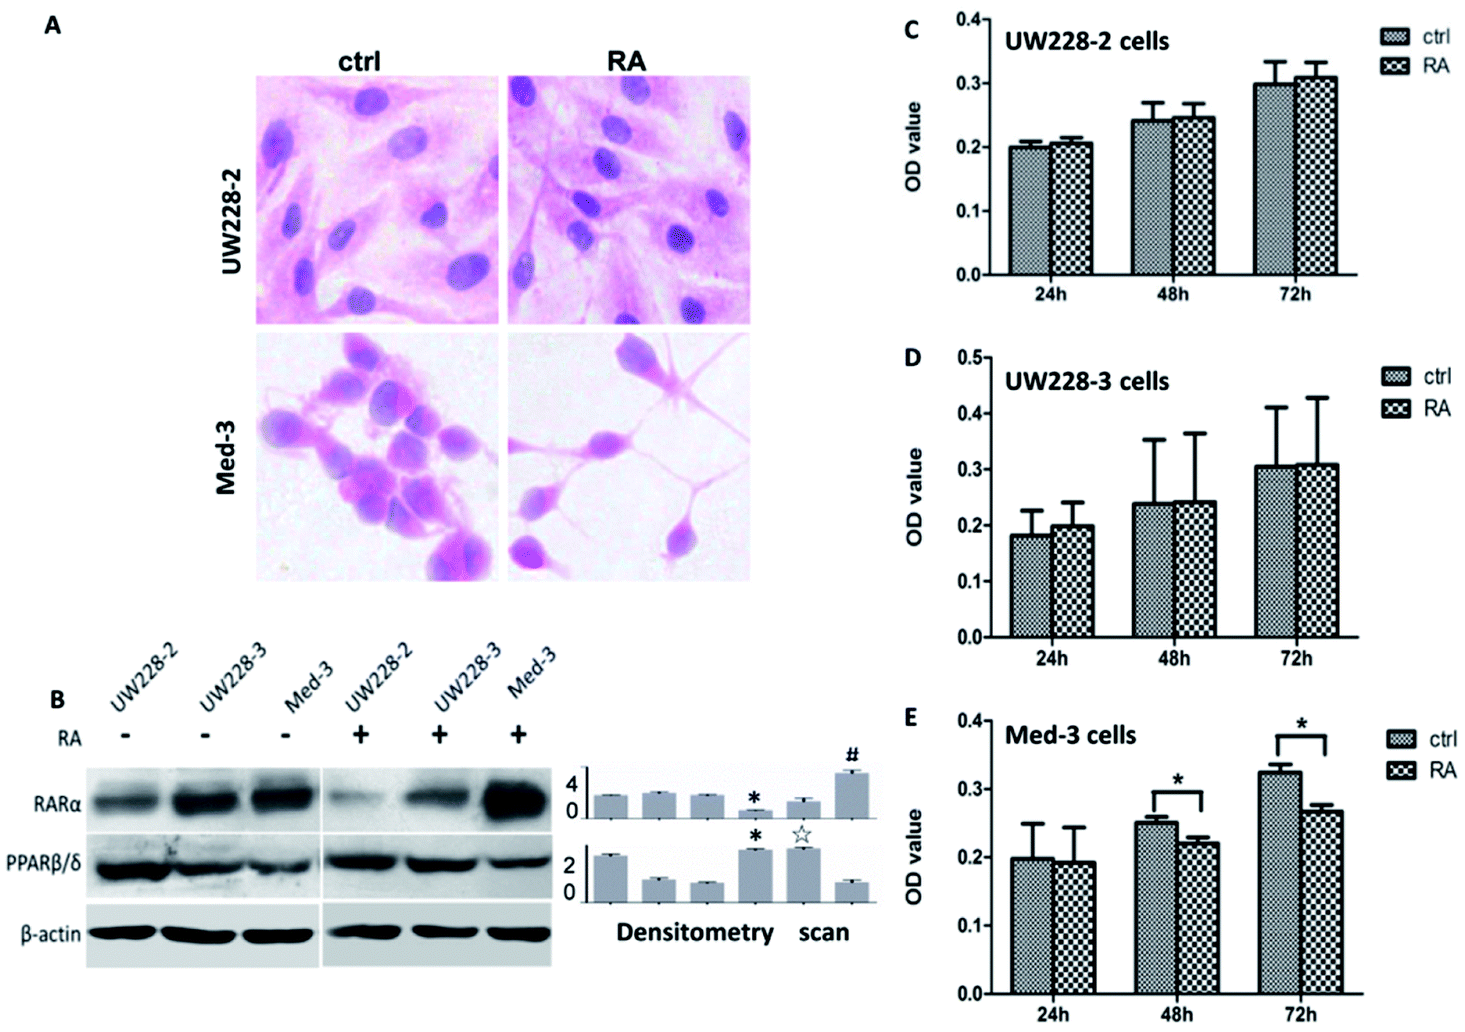 | ||
| Fig. 1 Expression of RA receptors in MB cells and in vitro responsiveness to RA. (A) HE morphological staining was performed on UW228-2 and Med-3 cells that were either untreated (control) or treated with 10 μM RA for 72 h. (B) Western blotting profiling of RARα and PPARβ/δ expression in UW228-2, UW228-3 and Med-3 before and after RA treatment. Grayscale quantitative analysis was performed on the western blot results. *p < 0.05, compared with untreated UW228-2 cells; ☆p < 0.05, compared with untreated UW228-3 cells; #p < 0.05, compared with untreated Med-3 cells. (C, D and E) Evaluation of the responses of UW228-2, UW228-3 and Med-3 to 10 μM RA for 72 h using an MTT assay. *p < 0.05, compared with control. | ||
Variable RARs and PPARβ/δ levels in MB cells
Because RARs and PPAR transmit CRABP-II- and FABP-5-mediated RA signals, respectively, and lead to different biological consequences,6 the statuses of their expressions in the three MB cell lines were examined. Both RAR-α and PPARβ/δ were expressed in those cell lines but their levels were related to RA-sensitivity (Fig. 1B). RA-sensitive Med-3 cells showed higher RAR-α and lower PPARβ/δ levels, while RA-insensitive UW228-2 and UW228-3 cells expressed higher PPARβ/δ and lower RAR-α levels. After RA treatment, PPARβ/δ was further upregulated and RAR-α decreased in UW228-2 and UW228-3 cells. In contrast, RAR-α was increased and PPARβ/δ was decreased in RA-treated Med-3 cells.Differential response of FABP5 and CRABP-II to RA treatment
The FABP5 and CRABP-II expression patterns in Med-3 and UW228-2 cells were evaluated before and after RA treatment by real-time RT-PCR, western blotting and immunofluorescent staining. As shown in Fig. 2A, increased CRABP-II (19.02 ± 2.18-fold change; p < 0.01) and decreased FABP5 transcription (0.51 ± 0.17-fold change; p < 0.01) were found in RA-treated Med-3 cells compared to control cells. Relative CRABP-II transcription was higher than that of FABP5 in Med-3 cells after RA treatment because the ratio of the 2−ΔΔCT values of CRABP-II and FABP5 was greater than 1 (40.13 ± 14.28). Increased CRABP-II and FABP5 transcription was also found in RA-treated UW228-2 cells (1.58 ± 0.25- and 3.33 ± 0.30-fold changes, respectively) but the ratio of the 2−ΔΔCT values of CRABP-II and FABP5 was less than 1 (0.48 ± 0.11). Thus, relative FABP5 transcription was higher than that of CRABP-II in UW228-2 cells after RA treatment. The real-time PCR results of UW228-3 cells were similar to those of UW228-2 cells (data not shown). The results of immunofluorescent staining and immunoblotting are in accordance with the above findings in terms of imbalanced CRABP-II and FABP5 expression patterns in MB cells (Fig. 2B and C).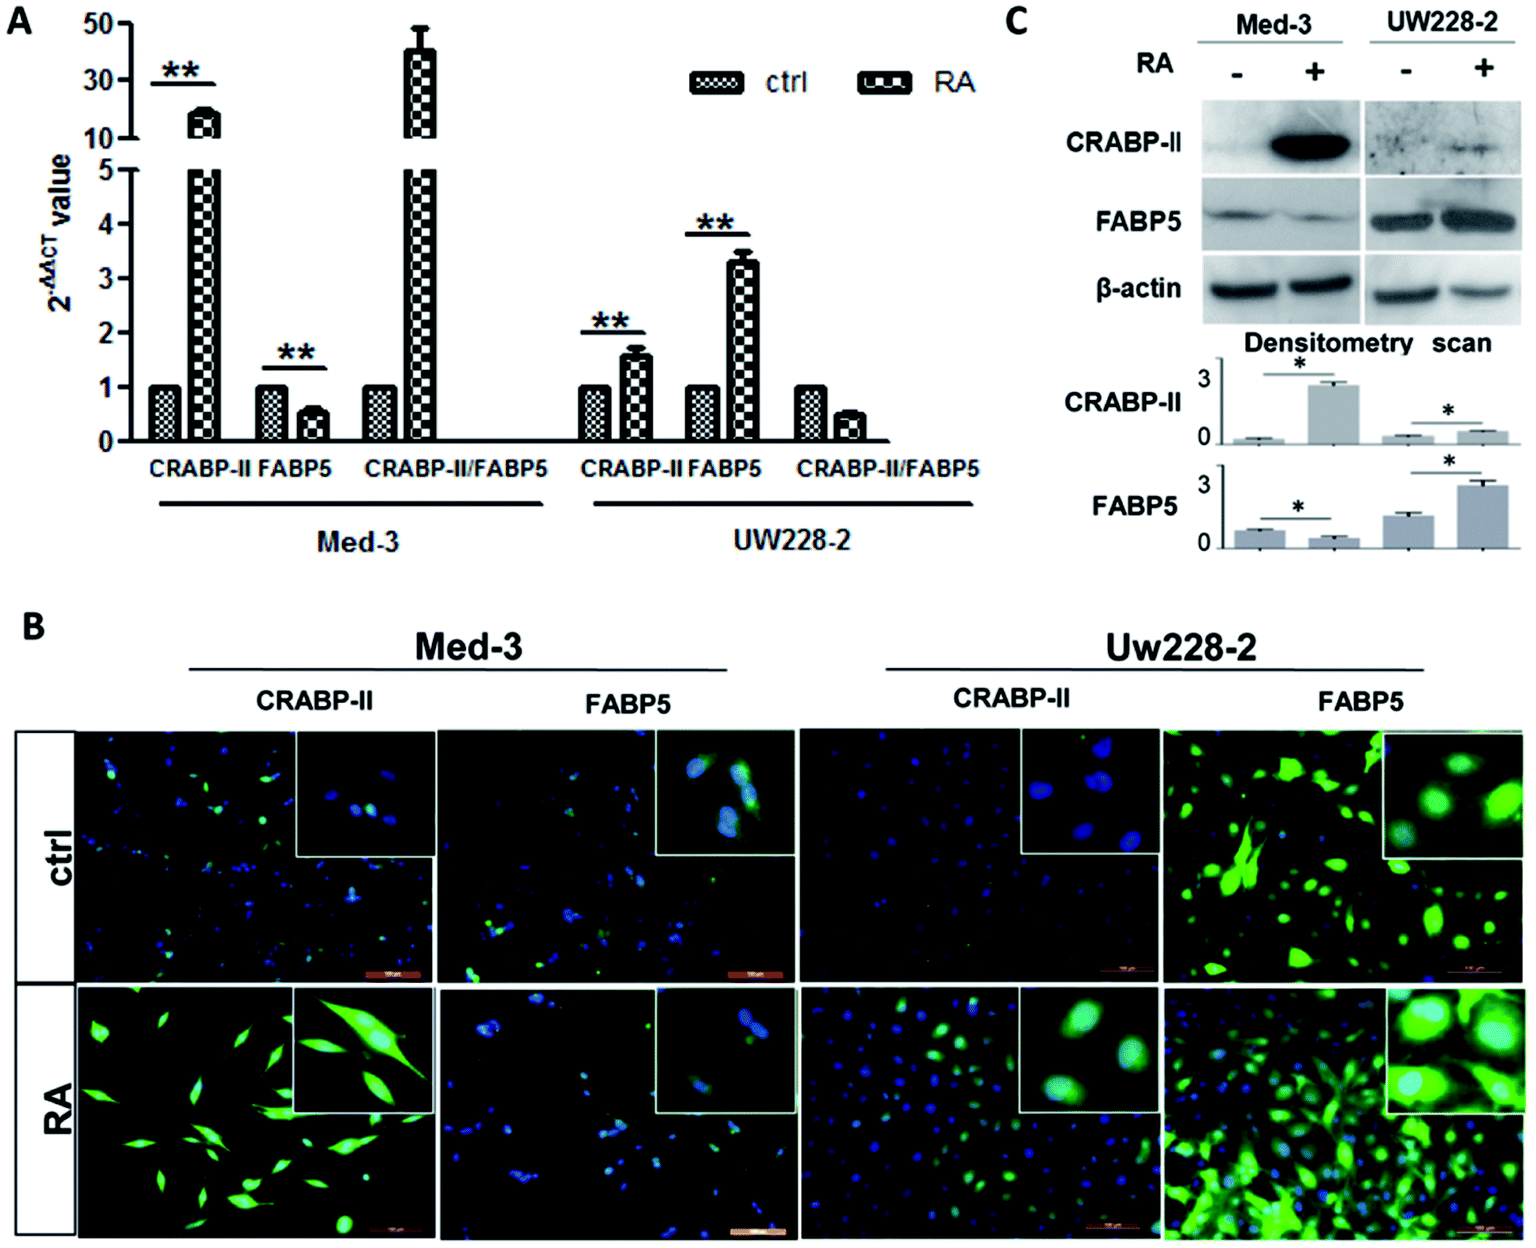 | ||
| Fig. 2 CRABP-II and FABP5 expression patterns in MB cells with and without RA treatment. (A) CRABP-II and FABP5 mRNA expressions were measured using real-time RT-PCR. **p < 0.01. (B) Immunofluorescence staining for CRABP-II and FABP5 in RA-treated MB cells. Magnified regions of each image are shown in the insets. (C) Western blot analysis of UW228-2 and Med-3 cells treated with and without RA. Grayscale quantitative analysis was performed on the Western blot results. *p < 0.05. Scale bar = 100 μm. | ||
FABP5 inhibitor improved RA resistance of UW228-2 cells
Because a predominance of FABP5-PPARβ/δ-mediated RA signaling conferred RA resistance on cancer cells,15 the relevance of FABP5 upregulation to the RA-insensitivity of UW228-2 cells was investigated using a specific FABP5 inhibitor, BMS309403. Staining with HE revealed similar morphologies in normally-cultured cells and cells treated by BMS309403, RA, and their combination (Fig. 3A). The MTT assay showed that treatment with RA or BMS309403 had no inhibitory effect on cell viability for 72 h (101.39% and 100.68%, respectively), while their combination decreased cell viability by 28.23% compared with that of normally-cultured cells (p < 0.01, Fig. 3B). The results of cell counting showed that the number of BMS309403 + RA-treated cells decreased by 26.46% compared to control cells (p < 0.01; Fig. 3C).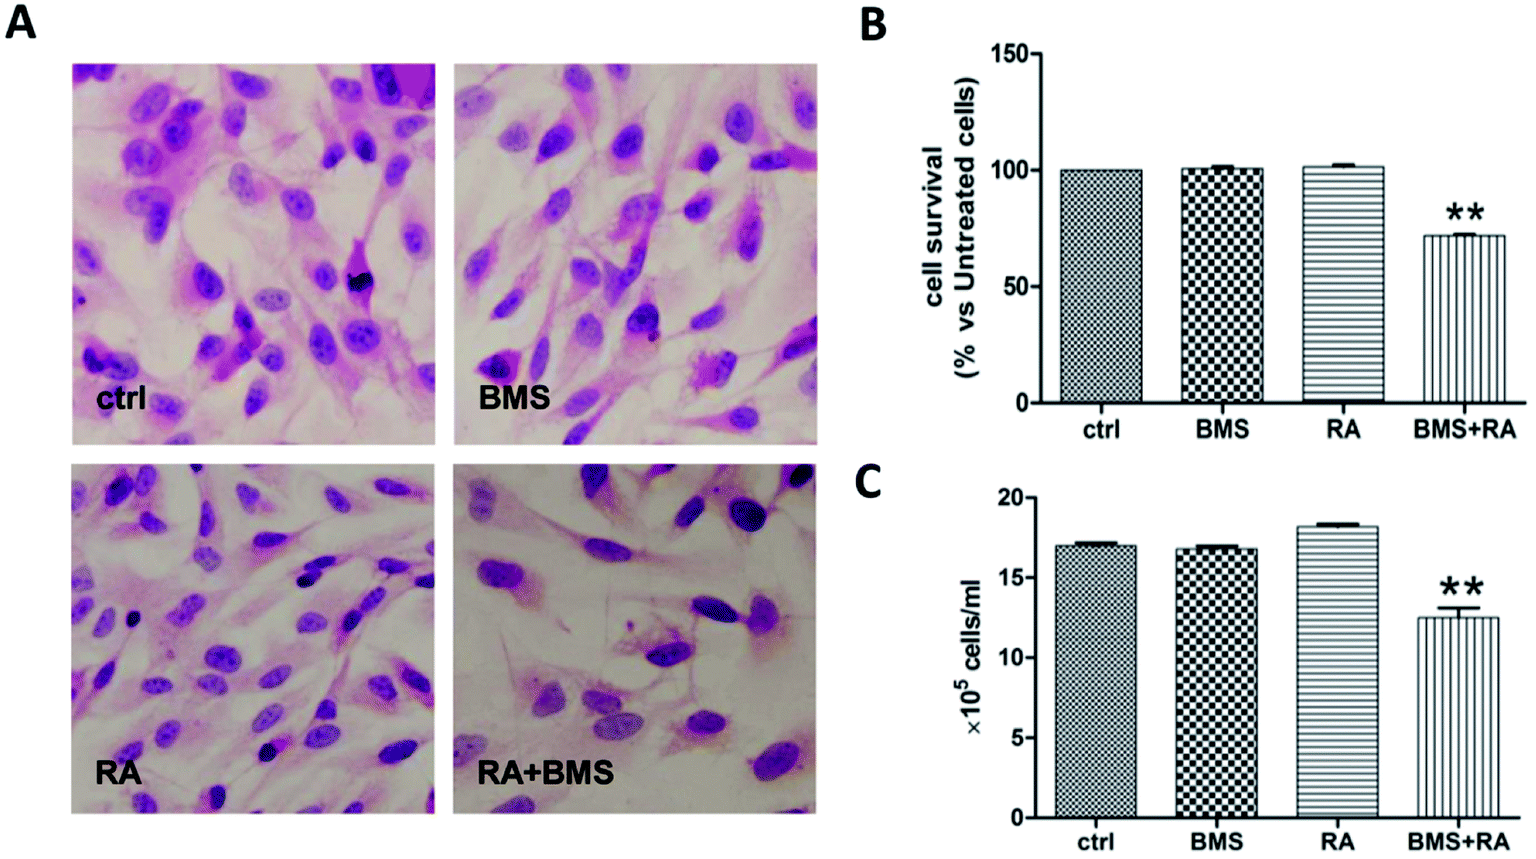 | ||
| Fig. 3 Effect of FABP5 inhibitor BMS309403 on the growth and survival of MB cells treated with RA. (A) HE morphological staining performed on UW228-2 cells under the following conditions: normal culture (ctrl); 25 μM BMS309403 treatment; 10 μM RA treatment; 25 μM BMS309403 pretreatment for 6 h followed by 10 μM RA treatment (RA + BMS309403). (B and C) Evaluation of RA responses by MTT and cell counting. **p < 0.01. | ||
Variety of FABP5 and CRABP-II expression patterns in MB tissues
The tissue microarrays constructed with 49 MB specimens were used in immunohistochemical profiling of CRABP-II and FABP5 expression (Fig. 4; Table 1). According to the WHO classification criterion,16 21 MB cases were diagnosed as classic, 20 as large cell and 8 as the nodular subtype. As shown in Table 1, CRABP-II and FABP5 were expressed in 61.9% (13/21) and 95.2% (20/21) of the classic MBs, 70% (14/21) and 80% (16/20) of the large-cell MBs, and 12.5% (1/8) of nodular MBs, respectively. The expression levels of CRABP-II and FABP5 in both classic and large-cell MBs were significantly higher than that in nodular MBs (p = 0.0147 and p = 0.0028, respectively). No significant difference in CRABP-II and FABP5 expression was established between classic and large-cell MBs. According to the presence (+) or absence (−) of their immuno-labeling, the diversity of CRABP-II and FABP5 expression patterns in each group were summarized as the four patterns CRABP-II−/FABP5−, CRABP-II−/FABP5+, CRABP-II+/FABP5−, and CRABP-II+/FABP5+. As shown in Fig. 4B, the CRABP-II+/FABP5+ pattern was distributed in 57% (12/21) of the classic, 50% (10/20) of the large-cell and 0% (0/8) of the nodular MBs.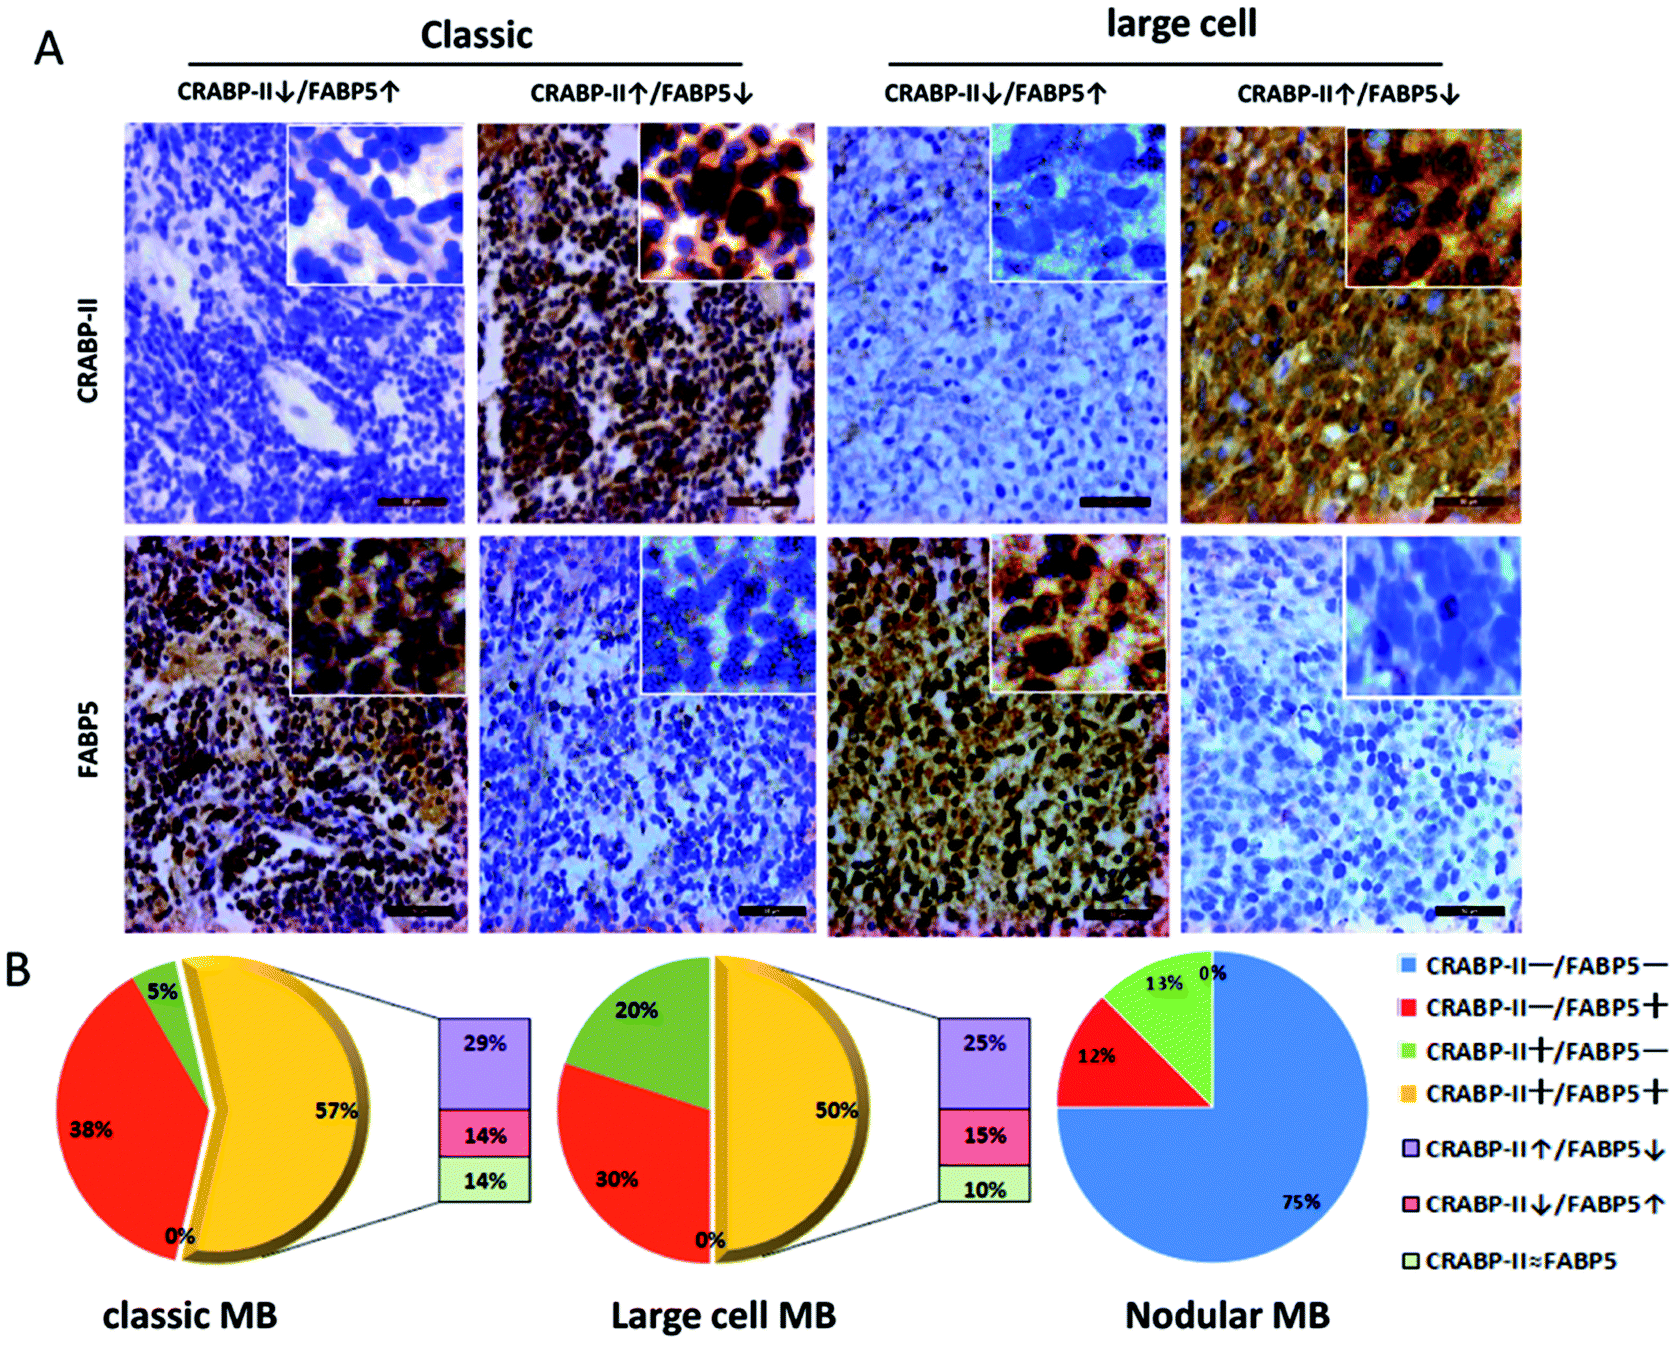 | ||
| Fig. 4 Expression patterns of CRABP-II and FABP5 in MB tissues. Immunohistochemical profiling of CRABP-II and FABP5 expression patterns in classic and large-cell MBs. The staining patterns were scored as CRABP-II↑/FABP5↓ (FABP5 down-regulated) and CRABP-II↓/FABP5↑ (FABP5 up-regulated) based on the labeling intensity of these two proteins in individual cases. The insets illustrate regions at higher magnification. Scale bar = 50 μm. | ||
| Histology | n | CRABP-II | FABP5 | ||||||||
|---|---|---|---|---|---|---|---|---|---|---|---|
| Positive rate (%) | − | + | ++ | +++ | Positive rate (%) | − | + | ++ | +++ | ||
| a *p < 0.05 compared with classic and anaplastic MBs. | |||||||||||
| Medulloblastomas | 49 | 57.1 | 21 | 3 | 12 | 13 | 75.5 | 12 | 7 | 15 | 15 |
| Classic | 21 | 61.9 | 8 | 2 | 4 | 7 | 95.2 | 1 | 5 | 6 | 9 |
| Large cell | 20 | 70 | 6 | 0 | 8 | 6 | 80 | 4 | 2 | 8 | 6 |
| Nodular | 8 | 12.5a | 7 | 1 | 0 | 0 | 12.5a | 7 | 0 | 1 | 0 |
Imbalanced CRABP-II and FABP5 levels in medulloblastomas
To identify MB subsets that might be predicted to be sensitive to RA, the expression patterns of CRABP-II and FABP5 were further analyzed according to the labeling intensity of these two proteins in individual cases (Fig. 4B). Because CRABP-II mediates tumor inhibition and FABP5 mediates tumor proliferation in RA signaling pathways, the CRABP-II+/FABP5+ cases were further grouped into CRABP-II↑/FABP5↓ (imbalanced due to FABP5 down-regulation) as RA-sensitive, CRABP-II↓/FABP5↑ (imbalanced due to FABP5 up-regulation) as RA-resistant, and CRABP-II ≈ FABP5 (balanced) as sensitivity uncertain. The results showed that 43% of the classic and 40% of the large-cell MBs displayed imbalanced CRABP-II and FABP5 patterns of which 29% and 25% belonged to CRABP-II↑/FABP5↓, and 14% and 15% belonged to CRABP-II↓/FABP5↑, respectively (Fig. 4B). Furthermore, the relative expressions of CRABP-II and FABP5 were summarized in all cases. As shown in Table 2, 65.3% of the MB cases were presented as FABP5 up-regulated (including CRABP-II−/FABP5+ and CRABP-II↓/FABP5↑ cases) or CRABP-II ≈ FABP5 patterns, which were supposed to be RA-resistant or RA-insensitive. Alternatively, 34.7% of MB cases presented as CRABP-II up-regulated and RA-sensitive patterns (Table 2).| Expression pattern | n (%) | Predicted outcome |
|---|---|---|
| CRABP-II+/FABP5− and CRABP-II↑/FABP5↓ | 17 (34.7) | Sensitive |
| CRABP-II−/FABP5+ and CRABP-II↓/FABP5↑ | 21 (42.9) | Resistant |
| CRABP-II−/FABP5− and CRABP-II ≈ FABP5 | 11 (22.4) | Uncertain |
Discussion
Medulloblastomas are a group of primitive neuroectodermal malignancies that originate from immature or embryonic cells at the earliest stage of development.17 It is, therefore, possible to promote MB cells to a more differentiated state using suitable differentiation inducers.18–20 Retinoic acid is able to inhibit cancer growth by promoting cell differentiation and apoptosis.21 However, its effects are not identical and may even be reversed. For instance, RA enhances mammary cancer growth in the MMTV-neu mouse model of breast cancer and exerts little inhibitory effect on human glioblastoma growth.22 The responses of MB cells to RA are highly variable.8,20 As demonstrated in the current study, Med-3 cells are sensitive to RA in terms of neuronal-like differentiation and growth suppression upon treatment; in contrast, RA exerts little influence in UW228-3 and especially UW228-2 cells. These findings suggest that RA should be selectively used in the clinical treatment of MB. To reach that goal, it is necessary to investigate the underlying reasons leading to the differential responses of MB cells to RA.There are two well-characterized RA signal transduction pathways that are mediated by CRABP-II and FABP5. RA functions through RAR and is a proapoptotic agent in cell with high CRABP-II/FABP5 ratio, but it signals through PPAR and promotes survival in cells that highly express FABP5.6,15 Thus, the expression levels of CRABP-II and FABP5 may determine the RA sensitivities and outcome of cancer cells treated with RA. Because imbalanced CRABP-II and FABP5 expression patterns may lead to different fates of RA-treated cells, the levels of CRABP-II and FABP5, as well as their corresponding effectors RAR-α and PPARβ/δ, in RA-sensitive Med-3 and RA-resistant UW228-2 and -3 cells, without and with RA treatment, were elucidated concurrently. The results clearly reveal predominant CRABP-II/RAR-α expression in Med-3, and FABP5/PPARβ/δ in the other two MB cell lines. It therefore suggests the importance of the CRABP-II- and FABP5-mediated RA signaling transduction pathways in determining the RA sensitivities in MB cell systems.
Our previous findings demonstrate that the presence of CRABP-II would be critical in determining RA sensitivities of MB cells.8 Evidence supporting a role for FABP5 in MB is limited. The results of this study show that relative FABP5 expression is higher than that of CRABP-II in RA-resistant UW228-2 cells with RA treatment. That the FABP5 inhibitor BMS309403 partly overcomes the RA resistance of UW228-2 cells further supports the above notions and confirms the active role of FABP5 in promoting cell growth and/or preventing cell death. However, our previous studies indicate that CRABP-II and FABP5 levels or ratios are not associated with the responsiveness of human glioblastoma cells and squamous carcinomas cells to RA. Moreover, neither inhibition of FABP5 nor restoration of CRABP-II can overcome RA resistance of these two types of cancer cells.12,23 These findings contradict the results from this study, suggesting that various expression patterns of RA signaling molecules are found in different cells. The above in vitro findings also suggest that there is a necessity to profile CRABP-II and FABP5 expression patterns in MB specimens for more reliable treatment, because RA may not be suitable for cases with predominant FABP5 and/or absent CRABP-II expressions.
Medulloblastomas are classified into the nodular, classic and large cell histological subtypes. Patients with the latter two subtypes usually have poorer prognoses due to more aggressive cell growth and more frequent MB recurrence.3 Therefore, post-operative adjuvant therapies should be employed to prevent tumor relapse. Although MB cells possess differentiation potential,24,25 and RA is a potent differentiation inducer,26,27 RA-based chemotherapy has not yet been widely used in clinical management of MB due to the uncertainty of its efficacy and the lesser-known mechanisms related to RA sensitivities.28,29 Given the evidence of a close correlation between CRABP-II and FABP5 expression patterns inMed-3 and UW228 cell responses to RA, the expression of these two genes in the three MB subtypes was profiled by tissue microarray-based immunohistochemical staining. Our results show highly variable expression of CRABP-II and FABP5 in tumor tissues in the forms of CRABP-II+/FABP5−, CRABP-II−/FABP5+, CRABP-II−/FABP5− and CRABP-II+/FABP5+which, according to the biological functions of CRABP-II and FABP5, are presumably considered to be sensitive, resistant, lack of, and case-by-case/uncertain responses to RA, respectively. Because CRABP-II and FABP5 levels are expressed but may not be identical, the CRABP-II+/FABP5+ pattern was further classified to CRABP-II↑/FABP5↓ as potentially RA-sensitive, CRABP-II↓/FABP5↑ as RA insensitive and CRABP-II ≈ FABP5 as uncertain subgroups. It has been reported that the binding affinity of CRABP-II-RAR for RA exceeds that of FABP5-PPAR.30,31 Therefore, high CRABP-II levels result in cytoplasmic sequestration of FABP5 and preferential activation of the RA/CRABP-II/RAR tumor suppression pathway. In this context, it may be predicted that 34.7% of MB cases with up-regulated CRABP-II expression in the forms of CRABP-II+/FABP5− or CRABP-II↑/FABP5↓ would be suitable for RA therapy, whereas the remaining cases (65.3%) should be treated by alternative regimens.
It has been proposed that CRABP-II and FABP5 are significant prognostic factors associated with poor survival in certain cancers such as glioblastoma and breast cancer.32,33 Our results show that the expression levels of CRABP-II and FABP5, in both classic and large-cell MBs, were significantly higher than those in nodular MBs. Due to the classic and large-cell histological subtypes presenting worse clinical outcomes than the nodular subtype, up-regulated CRABP-II and FABP5 may be related to prognosis in MB patients. Moreover, in this study, a variety of CRABP-II/FABP5 expression patterns were observed within the classic and large-cell groups, suggesting the necessity of personalized RA therapy for MB cases, even those with the same histology. Although there was no distinct difference in imbalanced CRABP-II/FABP5 expression between the classic and large-cell groups, these results provide further evidence that MB is a heterogeneous disease with different phenotypes and therapeutic outcomes.
Conclusions
In conclusion, this study demonstrates, for the first time, the highly variable expression patterns of CRABP-II and FABP5 in the three histologic subtypes of MBs and their correlation with RA sensitivities. Our results thus explain, at least in part, the reason for different responses of MB cells to RA, and suggest that CRABP-II and FABP5 are valuable as paired biomarkers in personalized RA therapy for MB patients.Conflicts of interest
There are no conflicts to declare.Acknowledgements
This study was supported by a grant of the National Natural Science Foundation of China (81373399), Natural Science Foundation of Liaoning Province of China (2013023038) and Program Fund for the outstanding scholars from Dalian Medical University.References
- L. J. Klesse and D. C. Bowers, CNS Drugs, 2010, 24, 285–301 CrossRef CAS PubMed.
- A. M. Martin, E. Raabe, C. Eberhart and K. J. Cohen, Curr. Treat. Options Oncol., 2014, 15, 581–594 CrossRef PubMed.
- T. C. Archer, E. L. Mahoney and S. L. Pomeroy, Neurotherapeutics, 2017, 14, 265–273 CrossRef CAS PubMed.
- M. Theodosiou, V. Laudet and M. Schubert, Cell. Mol. Life Sci., 2010, 67, 1423–1445 CrossRef CAS PubMed.
- R. M. Connolly, N. K. Nguyen and S. Sukumar, Clin. Cancer Res., 2013, 19, 1651–1659 CrossRef CAS PubMed.
- T. T. Schug, D. C. Berry, N. S. Shaw, S. N. Travis and N. Noy, Cell, 2007, 129, 723–733 CrossRef CAS PubMed.
- J. Liu, L. Guo, L. Jun-Wei, N. Liu and H. Li, Int. J. Mol. Med., 2000, 5, 145–149 CAS.
- Y. S. Fu, Q. Wang, J. X. Ma, X. H. Yang, M. L. Wu, K. L. Zhang, Q. Y. Kong, X. Y. Chen, Y. Sun, N. N. Chen, X. H. Shu, H. Li and J. Liu, Mol. Oncol., 2012, 6, 48–61 CrossRef CAS PubMed.
- S. Gupta, D. Pramanik, R. Mukherjee, N. R. Campbell, S. Elumalai, R. F. de Wilde, S. M. Hong, M. G. Goggins, A. De Jesus-Acosta, D. Laheru and A. Maitra, Clin. Cancer Res., 2012, 18, 280–289 CrossRef CAS PubMed.
- M. Matsumoto, Nihon Geka Hokan. Archiv Fur Japanische Chirurgie, 1991, 60, 113–121 CAS.
- G. E. Keles, M. S. Berger, J. Srinivasan, D. D. Kolstoe, M. S. Bobola and J. R. Silber, Oncol. Res., 1995, 7, 493–503 CAS.
- S. L. Xia, M. L. Wu, H. Li, J. H. Wang, N. N. Chen, X. Y. Chen, Q. Y. Kong, Z. Sun and J. Liu, Oncotarget, 2015, 6, 5889–5902 Search PubMed.
- B. Campos, F. S. Centner, J. L. Bermejo, R. Ali, K. Dorsch, F. Wan, J. Felsberg, R. Ahmadi, N. Grabe, G. Reifenberger, A. Unterberg, J. Burhenne and C. Herold-Mende, Am. J. Pathol., 2011, 178, 1953–1964 CrossRef CAS PubMed.
- M. T. Do, H. G. Kim, T. T. Tran, T. Khanal, J. H. Choi, Y. C. Chung, T. C. Jeong and H. G. Jeong, Toxicol. Appl. Pharmacol., 2014, 280, 138–148 CrossRef CAS PubMed.
- T. T. Schug, D. C. Berry, I. A. Toshkov, L. Cheng, A. Y. Nikitin and N. Noy, Proc. Natl. Acad. Sci. U. S. A., 2008, 105, 7546–7551 CrossRef CAS PubMed.
- D. N. Louis, H. Ohgaki, O. D. Wiestler, W. K. Cavenee, P. C. Burger, A. Jouvet, B. W. Scheithauer and P. Kleihues, Acta Neuropathol., 2007, 114, 97–109 CrossRef PubMed.
- P. Gibson, Y. Tong, G. Robinson, M. C. Thompson, D. S. Currle, C. Eden, T. A. Kranenburg, T. Hogg, H. Poppleton, J. Martin, D. Finkelstein, S. Pounds, A. Weiss, Z. Patay, M. Scoggins, R. Ogg, Y. Pei, Z. J. Yang, S. Brun, Y. Lee, F. Zindy, J. C. Lindsey, M. M. Taketo, F. A. Boop, R. A. Sanford, A. Gajjar, S. C. Clifford, M. F. Roussel, P. J. McKinnon, D. H. Gutmann, D. W. Ellison, R. Wechsler-Reya and R. J. Gilbertson, Nature, 2010, 468, 1095–1099 CrossRef CAS PubMed.
- A. Rossi, G. Russo, A. Puca, R. La Montagna, M. Caputo, E. Mattioli, M. Lopez, A. Giordano and F. Pentimalli, Int. J. Cancer, 2009, 125, 235–243 CrossRef CAS PubMed.
- L. J. Yu, M. L. Wu, H. Li, X. Y. Chen, Q. Wang, Y. Sun, Q. Y. Kong and J. Liu, Neoplasia, 2008, 10, 736–744 CrossRef CAS PubMed.
- Q. Chang, Z. Chen, J. You, M. A. McNutt, T. Zhang, Z. Han, X. Zhang, E. Gong and J. Gu, J. Neuro-Oncol., 2007, 84, 263–267 CrossRef CAS PubMed.
- H. Kawamata, M. Tachibana, T. Fujimori and Y. Imai, Curr. Pharm. Des., 2006, 12, 379–385 CrossRef CAS PubMed.
- B. Campos, S. Weisang, F. Osswald, R. Ali, G. Sedlmeier, J. Bageritz, J. P. Mallm, C. Hartmann, A. von Deimling, O. Popanda, V. Goidts, C. Plass, A. Unterberg, P. Schmezer, J. Burhenne and C. Herold-Mende, Glia, 2015, 63, 1850–1859 CrossRef PubMed.
- N. N. Chen, Y. Li, M. L. Wu, Z. L. Liu, Y. S. Fu, Q. Y. Kong, X. Y. Chen, H. Li and J. Liu, Exp. Dermatol., 2012, 21, 13–18 CrossRef CAS PubMed.
- J. M. de Bont, R. J. Packer, E. M. Michiels, M. L. den Boer and R. Pieters, Neurooncology, 2008, 10, 1040–1060 CAS.
- L. J. Rubinstein, J. Neurosurg., 1985, 62, 795–805 CrossRef CAS PubMed.
- F. Ravandi, E. Estey, D. Jones, S. Faderl, S. O'Brien, J. Fiorentino, S. Pierce, D. Blamble, Z. Estrov, W. Wierda, A. Ferrajoli, S. Verstovsek, G. Garcia-Manero, J. Cortes and H. Kantarjian, J. Clin. Oncol., 2009, 27, 504–510 CrossRef CAS PubMed.
- F. C. Zusi, M. V. Lorenzi and V. Vivat-Hannah, Drug discovery today, 2002, 7, 1165–1174 CrossRef CAS PubMed.
- S. A. Boorjian, M. I. Milowsky, J. Kaplan, M. Albert, M. V. Cobham, D. M. Coll, N. P. Mongan, G. Shelton, D. Petrylak, L. J. Gudas and D. M. Nanus, J. Immunother., 2007, 30, 655–662 CrossRef CAS PubMed.
- D. M. Shin, B. S. Glisson, F. R. Khuri, J. L. Clifford, G. Clayman, S. E. Benner, A. A. Forastiere, L. Ginsberg, D. Liu, J. J. Lee, J. Myers, H. Goepfert, R. Lotan, W. K. Hong and S. M. Lippman, J. Clin. Oncol., 2002, 20, 364–370 CrossRef CAS PubMed.
- N. S. Tan, N. S. Shaw, N. Vinckenbosch, P. Liu, R. Yasmin, B. Desvergne, W. Wahli and N. Noy, Mol. Cell. Biol., 2002, 22, 5114–5127 CrossRef CAS PubMed.
- F. Sussman and A. R. de Lera, J. Med. Chem., 2005, 48, 6212–6219 CrossRef CAS PubMed.
- R. Z. Liu, S. Li, E. Garcia, D. D. Glubrecht, H. Y. Poon, J. C. Easaw and R. Godbout, Glia, 2016, 64, 963–976 CrossRef PubMed.
- R. Z. Liu, K. Graham, D. D. Glubrecht, D. R. Germain, J. R. Mackey and R. Godbout, Am. J. Pathol., 2011, 178, 997–1008 CrossRef CAS PubMed.
Footnote |
| † Both authors contributed equally to this study. |
| This journal is © The Royal Society of Chemistry 2018 |