 Open Access Article
Free-standing nitrogen-doped graphene paper for lithium storage application†
Hao Wen,
Binbin Guo,
Wenbin Kang and
Chuhong Zhang *
*
State Key Laboratory of Polymer Materials Engineering, Polymer Research Institute of Sichuan University, Chengdu 610065, China. E-mail: chuhong.zhang@scu.edu.cn
First published on 16th April 2018
Abstract
A flexible free-standing nitrogen-doped graphene paper (N-GP) is fabricated via a facile hydrothermal approach with doping reaction occurring at the solid/gas interface of graphene oxide and ammonia vapor. Ammonia not only facilitates the doping of oxidized graphene paper efficiently with a nitrogen doping level of ca. 6.81%, but also promotes its reduction. The electrochemical properties of N-GP as an anode of lithium ion batteries (LIB) are evaluated and N-GP delivers almost doubled reversible discharge capacity compared to the undoped graphene paper (GP) as well as a good cyclic stability and rate performance. The proposed strategy to realize simultaneous reduction and nitrogen doping of graphene oxide via hydrothermal approach at the solid/gas interface offers a green and facile solution to modify graphene paper with desired electrochemical performances for LIB application.
1. Introduction
Graphene, with a one-atom thick and two-dimensional closely packed honeycomb lattice,1,2 has broad application prospects in many fields,3–11 due to its excellent intrinsic carrier mobility, high mechanical strength, superior thermal conductivity, high optical transmittance and so on. The large theoretical specific surface area (2630 m2 g−1) and superior electrical conductivity (106 S cm−1) make it an attractive additive in LIB. When incorporating graphene into traditional electrode materials for LIB by forming hybrid nanocomposites, improved battery performance has been reported.8,12–15 Of particular interest, graphene and its derivatives are reported with a larger theoretical lithium storage capacity compared to pristine graphite.16–20 Free-standing graphene paper has attracted phenomenal attention, among all graphene based battery electrodes, due to its good conductivity that allows for an excellent rate performance and the circumvention of conductive additives, binder and a supporting substrate, which eventually results in significantly increased specific capacity and energy density. Furthermore, the outstanding flexibility of graphene paper enables perfect compatibility with advanced soft electronics and R2R processing that greatly facilitates its application in the flexible electronics industry.12,17,21–23Both theoretical and experimental studies have demonstrated that the incorporation of heteroatoms into the basal plane of the graphene could further improve its electrochemical performances.24 Nitrogen-,25,26 boron-,27 sulfur-,28 and phosphorus-doped graphene29 have been prepared by different methods, and all exhibit enhanced electrochemical performances compared to undoped graphene. Of all the heteroatoms, nitrogen with the highest electronegativity has been proven one of the most effective doping elements for graphene.
Up to now, several methods, including mechanical milling of graphite with dopants,30,31 chemical reduction method in aqueous solution,32–34 thermal treatment with ammonia (NH3),35,36 chemical vapor deposition (CVD),37,38 plasma treatment39,40 have been adopted to prepare N-doped graphene. Mechanical milling of graphite with dopants reported in our earlier work,31 has been applied to produce N-doped graphene on a large scale at low cost, but the post treatment is time-consuming. Chemical reduction of GO in aqueous solution using hydrazine and its derivatives as the reducing agent and dopant is the most widely used method for the preparation of N-doped graphene. However, most of these reduction reagents and dopants are toxic.32–34 Thermal treatment of GO with ammonia gas is easy and efficient. However, a high energy barrier is imposed for the reaction between nitrogen atoms and carbon atoms at the basal plane of graphene. Therefore reaction initiating agents, usually toxic gases, are required at high temperatures to help surmount the barrier and trigger the doping reaction.35,36 CVD method features a direct synthesis process, and is able to prepare graphene doped with nitrogen uniformly in large area. But the CVD method involves costly and complex fabrication processes.37,38 By applying N2 or NH3 plasma on graphene or GO, N-doped graphene could also be prepared and the degree of N-doping can be tailored by the plasma intensity and the reaction time. But the plasma treatment also has the disadvantages involving high processing pressure and low cost efficiency, which severely restrict its scalability.39,40
Over the past few years, hydrothermal or solvothermal methods as green and simple techniques have been proven successful to reduce GO.20,41–43 Unfortunately, despite the multiple advantages of freestanding graphene paper, the reported reaction methods are not suitable for the direct reduction and doping of graphene oxide paper (GOP), because the graphene based paper is prone to lose its mechanical integrity by disassembling in the solvents during reaction under the high temperature and pressure condition.
In this paper, N-GP was prepared from a modified hydrothermal process at the solid/gas interface using GOP and concentrated ammonia water as the raw materials. GOP and ammonia were placed separately in a Teflon-lined autoclave. The concentrated ammonia water in the autoclave plays dual roles as both the doping and reducing agent. This modified hydrothermal process not only obviates harsh doping environments and the employment of toxic dopants but also manages to preserve the mechanical integrity of the freestanding graphene paper which is otherwise difficult to achieve (Fig. S1†). Besides, the facile reaction facilitates effective doping with an obtainable doping level of 6.81% where the doped N is majorly ascribed to electrochemically active pyridinic and pyrrolic N. Therefore, the as-prepared N-GP exhibits enhanced capacity, good cyclic stability and rate performance compared to pristine GP.
2. Experimental section
2.1 Reagents and materials
Graphite powder (325 mesh, purity>99.99%) was purchased from Qingdao huatai company. P2O5, KMnO4, K2S2O8, concentrated H2SO4 (98%), concentrated HCl (36.5%), concentrated ammonia water (28%) and 30% H2O2 aqueous solutions, all of analytical grade were obtained from Chengdu Kelong Chemical Reagents Co. Ultrapure water (18.25 MΩ cm) was used for all experiments.2.2 Preparation of graphene oxide (GO) aqueous solution
Graphite oxide was synthesized from natural graphite by a modified Hummers method as originally presented by Kovtyukhova and colleagues.44,45 Exfoliation of graphite oxide to GO was achieved by ultrasonication of the graphite oxide dispersion using an ultrasonic cleaner (KQ-300D, Kunshan Ultrasonic Cleaner Inc. 300 W) for 1 h. Subsequently, the obtained brown dispersion was subjected to 5 min centrifugation at 3000 r.p.m. to remove the unexfoliated graphite oxide. GO aqueous solution was collected by decanting the supernatant.2.3 Preparation of free-standing N-GP
The free-standing N-GP was prepared by a simple vacuum filtration method and a subsequent hydrothermal process at the solid/gas interface. Firstly, GOP was made by filtering 6 mL GO aqueous solution of 1 mg mL−1 on a filter membrane (mixed cellulose ester, 47 mm in diameter, 0.22 μm in pore size), followed by air drying for 24 h at room temperature and peeling from the filter carefully. Subsequently, the hydrothermal reduction was performed by placing GOP on the top of a glass bottle in a 50 mL Teflon-lined autoclave in which 10 mL concentrated ammonia water was added. The GOP was not allowed to contact the concentrated ammonia water directly. The hydrothermal temperature and reaction time were 220 °C and 12 h, respectively. Finally, the collected N-GP from the autoclaves was rinsed by de-ionized water to remove residual NH3 and dried in a vacuum oven at 80 °C overnight. In comparison, GP was prepared by adding 10 mL de-ionized water to the autoclave, while other conditions maintained the same.2.4 Characterization
X-Ray diffraction (XRD) patterns were recorded on a Rigaku (Smart lab III) using Cu Kα radiation within 2θ = 10–60°. The morphology was characterized from field emission scanning electron microscopy (FESEM, Quanta FEI, America). Raman spectroscopy was performed on a laser Raman spectrometer (LabRAM HR, France) with a He–Ne laser (532 nm) as the excitation source. X-Ray photoelectron spectroscopy (XPS) was conducted on an Escalab 250Xi X-ray photoelectron spectrometer (Thermo, America).2.5 Electrochemical measurements
In order to test the electrochemical performance of the obtained flexible free-standing GP and N-GP, working electrodes were prepared by directly pressing the papers onto the Cu current collector without carbon additives, polymer binders etc., and were assembled in a CR 2032-type coin cell configuration in a highly pure argon-filled glovebox, with a lithium foil as the counter/reference electrode, a polypropylene membrane (Celgard 2325) as the separator, 1 M LiPF6 in ethylene carbonate and diethyl carbonate (EC/DMC, 1![[thin space (1/6-em)]](https://www.rsc.org/images/entities/char_2009.gif) :
:![[thin space (1/6-em)]](https://www.rsc.org/images/entities/char_2009.gif) 1 vol) as the electrolyte. Charge–discharge measurements were done galvanostatically at various current densities in the voltage range of 0.01 V–2.0 V using a battery test system (LAND CT2001A model). Cyclic voltammetry (CV) was carried out in the potential range of 0.01 V–2.5 V (vs. Li/Li+) at a scan rate of 0.2 mV s−1, and electrochemical impedance spectroscopy (EIS) was measured by applying an AC voltage of 5 mV amplitude in the frequency range of 100 kHz to 10 mHz using Biologic VMP3 electrochemical workstation. The electrical conductivity of GP and N-GP (d = 13 mm) was measured using a digital four-point-probe system (Guangzhou four-point-probe technology corporation). The thickness of the graphene based papers was determined from SEM images.
1 vol) as the electrolyte. Charge–discharge measurements were done galvanostatically at various current densities in the voltage range of 0.01 V–2.0 V using a battery test system (LAND CT2001A model). Cyclic voltammetry (CV) was carried out in the potential range of 0.01 V–2.5 V (vs. Li/Li+) at a scan rate of 0.2 mV s−1, and electrochemical impedance spectroscopy (EIS) was measured by applying an AC voltage of 5 mV amplitude in the frequency range of 100 kHz to 10 mHz using Biologic VMP3 electrochemical workstation. The electrical conductivity of GP and N-GP (d = 13 mm) was measured using a digital four-point-probe system (Guangzhou four-point-probe technology corporation). The thickness of the graphene based papers was determined from SEM images.
3. Result and discussion
The reduction process for flexible free-standing GOP by a modified hydrothermal process at the solid/gas interface is schematically illustrated in Fig. 1. In order to avoid the contact between the GOP and the solvent in the autoclave, GOP was placed on the top of a glass bottle. For comparison purpose, concentrated ammonia water and de-ionized water were used as aqueous solutions respectively. When the reaction temperature in the Teflon-lined autoclave is approached, concentrated ammonia water in the glass bottle converts into ammonia vapor which surrounds and reacts with GOP. During the reaction, GOP is reduced under high temperature and high pressure. At the same time, the ammonia molecules dope the GOP to form the C–N bond, thus producing N-GP. GP was also prepared when concentrated ammonia water was replaced by de-ionized water. Both the reduced papers kept their mechanical integrity through this modified hydrothermal process. | ||
| Fig. 1 A schematic illustration of the reduction process of GOP by the modified hydrothermal process at the solid/gas interface. | ||
Fig. 2 and S2† shows the digital and SEM images of GOP, GP and N-GP. As observed from the digital images, both GP and N-GP are flexible. Unlike GOP with a bright yellow surface (Fig. 2a), the GP and N-GP display a dark-brown surface with shiny metallic luster (Fig. 2b and c), which suggests the reduction of GOP from the hydrothermal treatment. SEM analysis reveals that the surface of the GOP is relatively smooth (Fig. 2d) and the cross section exhibits a 2D layered structure (inset of Fig. 2d). After the hydrothermal treatment, the surface of the GP and N-GP forms a wrinkled structure (Fig. 2e and f). Compared to the GOP, the thickness of the GP and N-GP increase slightly (inset of Fig. 2e and f), which is caused by the gas released during graphene oxide reduction that leads to the formation of the corrugated structure. The advantage of the modified hydrothermal process at the solid/gas interface is that the mechanical integrity of the GOP maintains intact after the reaction and that the method is capable of reducing and doping graphene simultaneously as would be characterized below.
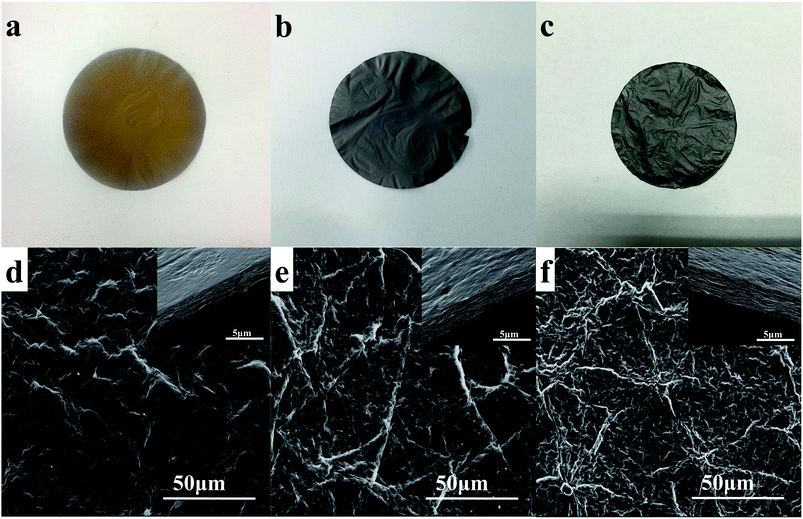 | ||
| Fig. 2 Photographs of (a) GOP, (b) GP and (c) N-GP; top view SEM images of (d) GOP, (e) GP and (f) N-GP. The insets show the related cross section view of each paper. | ||
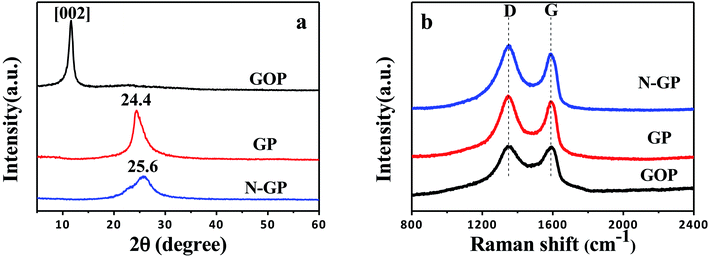
Fig. 3a shows the XRD profiles of GOP, GP and N-GP. As can be seen in Fig. 3a, GOP displays a broad X-ray diffraction peak at around 11.6°, corresponding to the (002) reflection of GO with a layer-to-layer distance (d-spacing) of about 7.7 Å, which means probably a one molecule-thick layer of water existing between the GO nanosheets.46 After the hydrothermal treatment, the peak of GOP disappears, and a new broad diffraction peak appears near 25°, indicating that the GOP is reduced through the hydrothermal process. For GP, the broad peak appears at 24.4°, which corresponds to a d-spacing of 3.65 Å and is close to the d-spacing of the graphite. As the concentrated ammonia water is introduced, the peak at around 25° becomes broader, and the d-spacing is slightly reduced, approaching 3.51 Å. This result suggests that ammonium gas promotes better reduction of graphene oxide.
Raman spectroscopy is utilized to further characterize the significant structural changes that occur during the hydrothermal processing from GOP to GP or N-GP. Fig. 3b shows the Raman spectra of the different papers. The two characteristic peaks at about 1342 and 1589 cm−1 correspond to the vibration caused by the graphene edges (D band) and the in-plane vibration of graphene lattice (G band), respectively. The intensity ratio of the D and G bands (ID/IG) is normally used to characterize the disorder degree of the carbonaceous materials. ID/IG for GOP, GP, N-GP are 1.01, 1.08, 1.13, respectively. Both GP and N-GP have an increased D/G intensity ratio compared to GOP, suggesting a decrease in the average size of the crystalline graphene domains, but an increase in the number of small crystalline graphene domains. In contrast to GP, the introduction of concentrated ammonia water led to a further increase in D/G intensity ratio, which indicates that N-GP has a higher disorder degree and is consistent with the previous XRD results.
The element chemical composition of each paper was analyzed by X-ray photoelectron spectroscopy (XPS). As shown in Fig. 4a, the XPS spectra of all papers exhibit two characteristic peaks at ca. 284.1 and 532.0 eV, corresponding to the C 1s and O 1s, respectively, but only N-GP shows nitrogen signals at 399.1 eV in the XPS spectra, which evidences nitrogen atom doping into the GOP via the hydrothermal process at the solid/gas interface with ammonia. Based on the XPS characterization, the contents of each element in all papers are calculated and shown in Fig. 4b. The content of O atoms is significantly reduced, demonstrating the effective reduction with either concentrated ammonia water or de-ionized water. Compared to GP, N-GP shows a lower ratio of O atom to C atom, which indicates that concentrated ammonia water can further promote the reduction. High resolution XPS spectrum of C 1s can be deconvoluted to four components corresponding to C–C, C–O, C–N, C![[double bond, length as m-dash]](https://www.rsc.org/images/entities/char_e001.gif) O groups as indicated in Fig. 5c. C–O and C
O groups as indicated in Fig. 5c. C–O and C![[double bond, length as m-dash]](https://www.rsc.org/images/entities/char_e001.gif) O mainly come from the residual oxygen containing functional groups in N-GP. Detailed binding configuration of C–N bonds is further investigated by high resolution XPS spectrum of N 1s (Fig. 4c). Curve fitting resolves the N 1s spectrum to three peaks centered at 398.4, 399.6, 401.0 eV representing pyridinic, pyrrolic, and graphitic N atoms doped in the graphene structure, respectively (Fig. 5c).47 The relative quantities of these three states are estimated to be 25.48% pyridinic-N, 54.67% pyrrolic-N and 19.85% graphitic-N, accounting for the total 6.81% (atom content) nitrogen doping level in N-GP. Compared to carbon (electronegativity 3.0), nitrogen has a higher electronegativity (3.5) and a smaller diameter, which are favorable for the intercalation kinetics of positive lithium ions. Pyridinic and pyrrolic N atoms are located at the edges or defects of the graphene, which leads to higher chemical activity than graphite. This has been proven beneficial to the storage of lithium ions and thus a higher reversible capacity in LIB.48
O mainly come from the residual oxygen containing functional groups in N-GP. Detailed binding configuration of C–N bonds is further investigated by high resolution XPS spectrum of N 1s (Fig. 4c). Curve fitting resolves the N 1s spectrum to three peaks centered at 398.4, 399.6, 401.0 eV representing pyridinic, pyrrolic, and graphitic N atoms doped in the graphene structure, respectively (Fig. 5c).47 The relative quantities of these three states are estimated to be 25.48% pyridinic-N, 54.67% pyrrolic-N and 19.85% graphitic-N, accounting for the total 6.81% (atom content) nitrogen doping level in N-GP. Compared to carbon (electronegativity 3.0), nitrogen has a higher electronegativity (3.5) and a smaller diameter, which are favorable for the intercalation kinetics of positive lithium ions. Pyridinic and pyrrolic N atoms are located at the edges or defects of the graphene, which leads to higher chemical activity than graphite. This has been proven beneficial to the storage of lithium ions and thus a higher reversible capacity in LIB.48
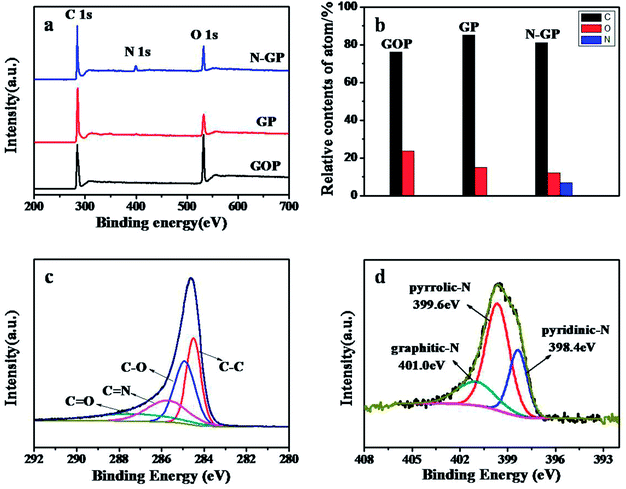 | ||
| Fig. 4 (a) XPS spectra of GO paper, GP, and N-GP; (b) the relative atom contents of all papers; high-resolution (c) C 1s and (d) N 1s XPS spectra of N-GP. | ||
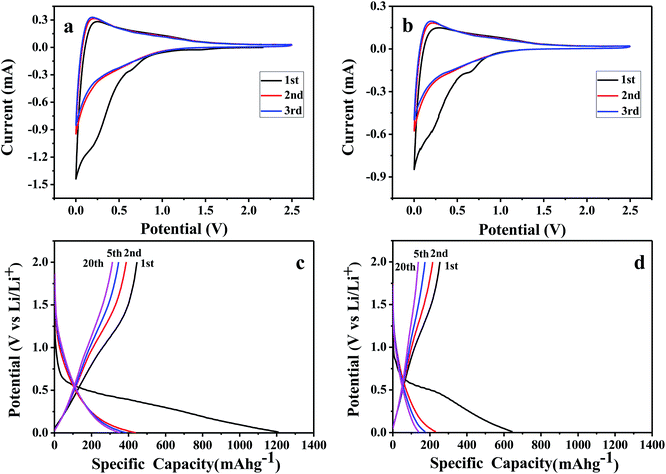
Electrochemical performances of all the prepared papers were first characterized by cyclic voltammetry. N-GP and GP were used as working electrodes with Li as counter and reference electrodes. The cyclic voltammograms (CV) of N-GP and GP electrodes at a scan rate of 0.2 mV s−1 between 0.01 V and 2.5 V are shown in Fig. 5a and b. Both N-GP and GP exhibit similar CV profiles, which means the N-GP and GP have similar Li+ intercalation/deintercalation behaviors. Taking N-GP as an example, there is a prominent peak at around 0.6 V in the first cycle and disappears in the subsequent cycles. This peak is caused by a solid electrolyte interphase (SEI) film forming on the surface of the electrode, and the formed SEI film prevents new SEI film formation in the subsequent cycles. The flatter and broader redox pair peaks close to 0 V were also observed in the CV curves corresponding to a gradual process of lithiation/delithiation for N-GP.49 The major reduction of CV curve area after the first cycle indicates that the irreversible capacity loss mainly occurs due to SEI formation, and N-GP shows a stable cycling performance afterwards.
The galvanostatic charge/discharge profiles of N-GP and GP at a specific current of 100 mA g−1 are shown in Fig. 5c and d. On the first discharge, there is an obvious plateau at around 0.6 V for both samples, but the plateau disappears and is replaced by declining curves in the second and following cycles. The plateau could be attributed to the formation of SEI film and the declining curves are related to the lithiation process for graphene. This feature is consistent with the CV results.
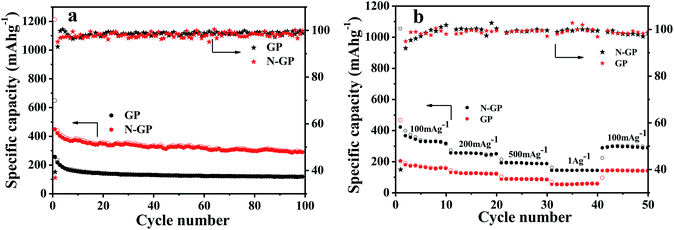
Fig. 6a shows the cycling performances of N-GP and GP, respectively, at a specific current density of 100 mA g−1. As can be seen, the initial discharge and charge specific capacities of N-GP are 1210 mA h g−1 and 445.4 mA h g−1, much higher than those of GP (646.1 mA h g−1 and 254.1 mA h g−1), which benefits from the introduction of N atoms in the basal plane of graphene that creates more active sites and defects for the storage of lithium ions, thus resulting in improved capacity. But on the other hand, the more defects on the basal plane of graphene, account for more surface side reactions (SEI film forming) with the electrolyte leading to a larger irreversible capacity in the first cycle. Therefore, the initial coulombic efficiency of N-GP is 36.81%, lower than that of GP (39.3%). After the first cycle, a stable and dense SEI film is formed stabilizing the reaction interface and the coulombic efficiency of N-GP reaches above 90%, and is constantly increasing with increased cycling numbers. More significantly, even after 100 cycles, a reversible capacity of 287.6 mA h g−1 is maintained for N-GP, which is still higher than the initial charge capacity of GP (254.1 mA h g−1), and almost doubles the latter's capacity after 100 cycles. The increase on reversible capacity associated with N doping has been reported in many cases,31,48,50 and a couple of reasons have been proposed. Firstly, the increased topological defects on N-GP facilitate the Li+ accommodation, which is obviously beneficial to the improved reversible capacity.51 Secondly, different from GP, for which adsorption of Li atoms occurs at the hollow sites of the hexagonal ring on surface, for N-GP, Li atoms favor adsorption at the vacancy site of pyridinic-N and pyrrolic-N due to the strong electrostatic interaction between the adsorbed Li and the N-GP. As a result, a higher adsorption energy and decreased energy barrier for Li+ incorporation, contribute to the higher Li storage capacity of N-GP.52 However, the capacity retention of N-GP at 100th cycle is only 65% of the initial charge capacity, which could be explained by the existence of residual oxygen containing functional groups in N-GP and by the self-restacking of graphene nanosheets upon cycling. Such issues can be easily addressed with approaches like post heat treatment to induce more extensive reduction or incorporation of nanoparticles between graphene nanosheets as spacers to prevent stacking.53,54
Galvanostatic charge/discharge experiments were conducted at various specific currents to investigate the rate capabilities of N-GP and GP. As shown in Fig. 6b, N-GP can be reversibly charged to 315.6 mA h g−1 in the tenth cycle at the current density of 100 mA g−1. With the current density increased to 200, 500, and 1000 mA g−1, the corresponding reversible capacities of N-GP are stabilized at 248.4, 184.4, and 141.0 mA h g−1, respectively. These reversible capacities are much higher than those of GP, and even at the high current density of 1000 mA g−1, the reversible capacity of N-GP is close to the capacity of GP at the slowest current density of 100 mA g−1. More importantly, a specific capacity of 291.0 mA h g−1 can be recovered and stabilized when the current density is restored to the initial 100 mA g−1, demonstrating that N-GP possesses a very good reversibility.
Fig. 7 shows the nyquist plots by measuring the AC impedance spectroscopy of N-GP and GP before cycling and after 5 cycles. It is usually considered that the semicircle in the high/medium frequency range is assigned to the SEI impedance, contact resistance, and charge-transfer resistance at the electrode/electrolyte interface, while the inclined line corresponds to the lithium-diffusion process through electrode material.55 Compared with the electrodes before cycling, the semicircle diameters of both N-GP and GP electrodes at high/medium frequency decrease after 5 cycles due to the better penetration of the electrolyte and the activation of the active materials. Before cycling, N-GP and GP show a similar semicircle which means both electrodes have similar resistances (Fig. 7a). But after 5 cycles, the semicircle diameter of N-GP electrode becomes smaller than that of GP electrode (Fig. 7b), indicating a better ionic conductivity and a lower charge-transfer resistance due to the introduction of nitrogen to the basal plane of the graphene. An equivalent circuit has been used to quantify the influence of N-doping (inset of Fig. 7b), in which Re represents the electrolyte resistance, Rs, Rct, CPE1 and CPE2 are the resistances and capacitances of SEI film and interface, respectively, and Zw is the Warburg impedance. The fitting parameters are listed in Table S1.† As can be seen, the total resistance (Re + Rs + Rct) of the N-GP (54.97 Ω) is half of that of the GP (110.56 Ω). Table 1 also shows the electrical conductivity of N-GP and GP measured from a digital four-point-probe station. It is obvious that the N-GP exhibits a significantly higher electrical conductivity than GP.
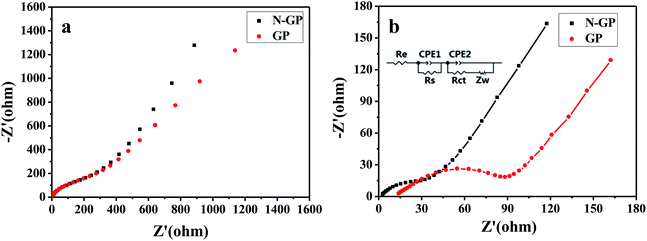 | ||
| Fig. 7 Nyquist plots for N-GP and GP (a) before cycling and (b) after 5 cycles with the fitted curves (inset: equivalent circuit used to fit the experimental data). | ||
| Component | N-GP | GP |
|---|---|---|
| Electrical conductivity (S m−1) | 2000 | 900 |
The improved electrochemical properties of N-GP can be attributed to the introduction of nitrogen to the basal plane of the graphene. Firstly, compared to the carbon atoms, nitrogen atoms produce more lone pair electrons for graphene, thus improving the electronic conductivity and electron mobility of graphene.56 Secondly, the introduction of nitrogen atoms increases the defects of graphene, which is beneficial to the storage of more lithium ions.48 Thirdly, the electronegativity of nitrogen is stronger than that of carbon, leading to the improved adsorption energy and decreased energy barrier for Li+ intercalation.52
4. Conclusions
In summary, N-doped flexible free-standing graphene paper (N-GP) is prepared from a modified hydrothermal process at the solid/gas interface using concentrated ammonia water as the doping precursor. The as-prepared N-GP maintains the intrinsic flexible structure of the initial graphene oxide paper and the nitrogen doping content reaches 6.81%. The majority of the dopants are pyridinic and pyrrolic nitrogen. When used in LIB, this N-GP exhibits a rather high reversible capacity, good rate performance and cycling stability compared to the undoped analogue. All the improved electrochemical properties can be ascribed to the introduction of nitrogen to the basal plane of the graphene, which produces more defects, improved electronic conductivity which are beneficial for Li+ intercalation. The N-GP prepared by this method can be applied as anode for LIB without additives and complex coating technology. The facile reaction route along with the resulted mechanically robust flexible functional paper with enhanced electrochemical performance makes this technique very promising for energy storage applications.Conflicts of interest
There are no conflicts to declare.Acknowledgements
This work was financially supported by the 973 program of Ministry of Science and Technology of the People's Republic of China (No. 2013CB934700), the National Natural Science Foundation of China (No. 51222305 and 51673123) and the Program for New Century Excellent Talents in University (No. NCET-12-0386).References
- A. K. Geim and K. S. Novoselov, Nat. Mater., 2007, 6, 183–190 CrossRef CAS PubMed
.
- K. S. Novoselov, V. I. Fal'Ko, L. Colombo, P. R. Gellert, M. G. Schwab and K. Kim, Nature, 2012, 490, 192–200 CrossRef CAS PubMed
.
- K. P. Loh, S. W. Tong and J. Wu, J. Am. Chem. Soc., 2016, 138, 1095–1102 CrossRef CAS PubMed
.
- C. Petridis, D. Konios, M. M. Stylianakis, G. Kakavelakis, M. Sygletou, K. Savva, P. Tzourmpakis, M. Krassas, N. Vaenas and , E. Stratakis, Nanoscale Horiz., 2016, 1, 375–382 RSC
.
- Y. H. Chang, C. T. Lin, T. Y. Chen, C. L. Hsu, Y. H. Lee, W. Zhang, K. H. Wei and L. J. Li, Adv. Mater., 2013, 25, 756–760 CrossRef CAS PubMed
.
- W. Zhou, J. Zhou, Y. Zhou, J. Lu, K. Zhou, L. Yang, Z. Tang, L. Li and S. Chen, Chem. Mater., 2015, 27, 2026–2032 CrossRef CAS
.
- M. F. Elkady and R. B. Kaner, Nat. Commun., 2013, 4, 1475 CrossRef PubMed
.
- D. Kong, H. He, Q. Song, B. Wang, W. Lv, Q. H. Yang and L. Zhi, Energy Environ. Sci., 2014, 7, 3320–3325 CAS
.
- L. David, R. Bhandavat and G. Singh, ACS Nano, 2014, 8, 1759–1770 CrossRef CAS PubMed
.
- M. B. Lerner, F. Matsunaga, G. H. Han, S. J. Hong, J. Xi, A. Crook, J. M. Perez-aguilar, Y. W. Park, J. G. Saven, R. Liu and A. T. Johnson, Nano Lett., 2014, 14, 2709–2714 CrossRef CAS PubMed
.
- M. Singh, M. Holzinger, M. Tabrizian, S. Winters, N. C. Berner, S. Cosnier and G. S. Duesberg, J. Am. Chem. Soc., 2015, 137, 2800–2803 CrossRef CAS PubMed
.
- H. Gwon, H. S. Kim, K. U. Lee, D. H. Seo, C. P. Yun, Y. S. Lee, B. T. Ahn and K. Kang, Energy Environ. Sci., 2011, 4, 1277–1283 CAS
.
- K. S. Chen, R. Xu, N. S. Luu, E. B. Secor, K. Hamamoto, Q. Li, S. Kim, V. K. Sangwan, I. Balla, L. M. Guiney, J. T. Seo, X. Yu, W. Liu, J. Wu, C. Wolverton, V. P. Dravid, S. A. Barnett, J. Lu, K. Amine and M. C. Hersam, Nano Lett., 2017, 17, 2539–2546 CrossRef CAS PubMed
.
- S. Yang, C. Cao, P. Huang, L. Peng, Y. Sun, F. Wei and W. Song, J. Mater. Chem. A, 2015, 3, 8701–8705 CAS
.
- B. Feng, H. Wang, Y. Zhang, X. Shan, M. Liu, F. Li, J. Guo, J. Feng and H. T. Fang, 2D Mater., 2017, 4, 015011 CrossRef
.
- Y. Liu, V. I. Artyukhov, M. Liu, A. R. Harutyunyan and B. I. Yakobson, J. Phys. Chem. Lett., 2013, 4, 1737–1742 CrossRef CAS PubMed
.
- C. Wang, D. Li, C. O. Too and G. G. Wallace, Chem. Mater., 2009, 21, 2604–2606 CrossRef CAS
.
- D. Cai, S. Wang, L. Ding, P. Lian, S. Zhang, F. Peng and H. Wang, J. Power Sources, 2014, 254, 198–203 CrossRef CAS
.
- D. Cai, L. Ding, S. Wang, Z. Li, M. Zhu and H. Wang, Electrochim. Acta, 2014, 139, 96–103 CrossRef CAS
.
- D. Xiong, X. Li, Z. Bai, H. Shan, L. Fan, C. Wu, D. Li and S. Lu, ACS Appl. Mater. Interfaces, 2017, 9, 10643–10651 CAS
.
- A. Abouimrane, O. C. Compton, K. Amine and S. B. T. Nguyen, J. Phys. Chem. C, 2016, 114, 12800–12804 Search PubMed
.
- Y. Hu, X. Li, D. Geng, M. Cai, R. Li and X. Sun, Electrochim. Acta, 2013, 91, 227–233 CrossRef CAS
.
- H. Bi, J. Chen, W. Zhao, S. Sun, Y. Tang, T. Lin, F. Huang, X. Zhou, X. Xie and M. Jiang, RSC Adv., 2013, 3, 8454–8460 RSC
.
- V. V. Strelko, V. S. Kuts and P. A. Thrower, Carbon, 2000, 38, 1499–1503 CrossRef CAS
.
- Y. Li, Z. Wang and X. J. Lv, J. Mater. Chem. A, 2014, 2, 15473–15479 CAS
.
- M. Du, J. Sun, J. Chang, F. Yang, L. Shi and L. Gao, RSC Adv., 2014, 4, 42412–42417 RSC
.
- Z. S. Wu, W. Ren, L. Xu, F. Li and H. M. Cheng, ACS Nano, 2011, 5, 5463–5471 CrossRef CAS PubMed
.
- W. Ai, Z. Luo, J. Jiang, J. Zhu, Z. Du, Z. Fan, L. Xie, H. Zhang, W. Huang and T. Yu, Adv. Mater., 2014, 26, 6186–6192 CrossRef CAS PubMed
.
- C. Zhang, N. Mahmood, H. Yin, F. Liu and Y. Hou, Adv. Mater., 2013, 25, 4932–4937 CrossRef CAS PubMed
.
- I. Y. Jeon, H. J. Choi, S. M. Jung, J. M. Seo, M. J. Kim, L. Dai and J. B. Baek, J. Am. Chem. Soc., 2013, 135, 1386–1393 CrossRef CAS PubMed
.
- C. Liu, X. Liu, J. Tan, Q. Wang, H. Wen and C. Zhang, J. Power Sources, 2017, 342, 157–164 CrossRef CAS
.
- D. W. Wang, I. R. Gentle and G. Q. Lu, Electrochem. Commun., 2010, 12, 1423–1427 CrossRef CAS
.
- Y. Wang, Y. Shao, D. W. Matson, J. Li and Y. Lin, ACS Nano, 2010, 4, 1790–1798 CrossRef CAS PubMed
.
- D. R. Dreyer, S. Park, C. W. Bielawski and R. S. Ruoff, Chem. Soc. Rev., 2010, 39, 228–240 RSC
.
- H. Liu, Y. Liu and D. Zhu, J. Mater. Chem., 2011, 21, 3335–3345 RSC
.
- G. H. Jun, S. H. Jin, B. Lee, H. K. Bo, W. S. Chae, S. H. Hong and S. Jeon, Energy Environ. Sci., 2013, 6, 3000–3006 CAS
.
- Z. Jin, J. Yao, C. Kittrell and J. M. Tour, ACS Nano, 2011, 5, 4112–4117 CrossRef CAS PubMed
.
- Z. Luo, S. Lim, Z. Tian, J. Shang, L. Lai, B. Macdonald, C. Fu, Z. Shen, T. Yu and J. Lin, J. Mater. Chem., 2011, 21, 8038–8044 RSC
.
- Y. C. Lin, C. Y. Lin and P. W. Chiu, Appl. Phys. Lett., 2010, 96, 133110–133113 CrossRef
.
- H. M. Jeong, J. W. Lee, W. H. Shin, Y. J. Choi, H. J. Shin, J. K. Kang and J. W. Choi, Nano Lett., 2011, 11, 2472–2477 CrossRef CAS PubMed
.
- Y. Xu, K. Sheng, C. Li and G. Shi, ACS Nano, 2010, 4, 4324–4330 CrossRef CAS PubMed
.
- D. Long, W. Li, L. Ling, J. Miyawaki, I. Mochida and S. H. Yoon, Langmuir, 2010, 26, 16096–16102 CrossRef CAS PubMed
.
- L. Sun, L. Wang, C. Tian, T. Tan, Y. Xie, K. Shi, M. Li and H. Fu, RSC Adv., 2012, 2, 4498–4506 RSC
.
- N. I. Kovtyukhova, P. J. Ollivier, B. R. Martin, T. E. Mallouk, S. A. Chizhik, E. V. Buzaneva and A. D. Gorchinskiy, Chem. Mater., 1999, 11, 771–778 CrossRef CAS
.
- W. S. Hummers Jr and R. E. Offeman, J. Am. Chem. Soc., 1958, 80, 1339 CrossRef
.
- D. A. Dikin, S. Stankovich, E. J. Zimney, R. D. Piner, H. B. Dommett, G. Evmenenko, S.T. Nguyen and R. S. Ruoff, Nature, 2007, 448, 457–460 CrossRef CAS PubMed
.
- D. Wei, Y. Liu, Y. Wang, H. Zhang, L. Huang and G. Yu, Nano Lett., 2009, 9, 1752–1758 CrossRef CAS PubMed
.
- H. Wang, C. Zhang, Z. Liu, L. Wang, P. Han, H. Xu, K. Zhang, S. Dong, J. Yao and G. Cui, J. Mater. Chem., 2011, 21, 5430–5434 RSC
.
- H. F. Xiang, Z. D. Li, K. Xie, J. Z. Jiang, J. J. Chen, P. C. Lian, J. S. Wu, Y. Yu and H. H. Wang, RSC Adv., 2012, 2, 6792–6799 RSC
.
- A. L. Reddy, A. Srivastava, S. R. Gowda, H. Gullapalli, M. Dubey and P. M. Ajayan, ACS Nano, 2010, 4, 6337–6342 CrossRef CAS PubMed
.
- N. A. Kaskhedikar and J. Maier, Adv. Mater., 2010, 21, 2664–2680 CrossRef
.
- Y. F. Li, Z. Zhou and L. B. Wang, J. Chem. Phys., 2008, 129, 104703 CrossRef CAS PubMed
.
- C. Wang, D. Li, C. O. Too and G. G. Wallace, Chem. Mater., 2009, 21, 2604–2606 CrossRef CAS
.
- G. Wang, X. Sun, F. Lu, H. Sun, M. Yu, W. Jiang, C. Liu and J. Lian, Small, 2012, 8, 452–459 CrossRef CAS PubMed
.
- Q. Tang, Z. Shan, L. Wang and X. Qin, Electrochim. Acta, 2012, 79, 148–153 CrossRef CAS
.
- J. R. Dahn, T. Zheng, Y. Liu and J. S. Xue, Science, 1995, 270, 590–593 CAS
.
Footnote |
| † Electronic supplementary information (ESI) available. See DOI: 10.1039/c8ra01019f |
| This journal is © The Royal Society of Chemistry 2018 |

