 Open Access Article
Facile synthesis of porous Fe3O4@C core/shell nanorod/graphene for improving microwave absorption properties†
Chen Fu ,
Dawei He*,
Yongsheng Wang and
Xuan Zhao
Key Laboratory of Luminescence and Optical Information, Ministry of Education, Institute of Optoelectronic Technology, Beijing Jiaotong University, Beijing 100044, China. E-mail: dwhe@bjtu.edu.cn; Tel: +86 10 51688018
First published on 24th April 2018
Abstract
Porous Fe3O4@C core/shell nanorods decorated with reduced graphene oxide (RGO) were fabricated through a facile one-pot method. The microwave absorption properties of the samples can be adjusted by the weight ratio of RGO. The addition of RGO not only effectively reduces the agglomeration of Fe3O4@C, but also has a great effect on impedance matching and dielectric loss, resulting in enhanced microwave absorption abilities. The thickness corresponding to optimum reflection loss (RL) decreases as the weight ratio of RGO increases. For the Fe3O4@C/RGO composite, a maximum RL value of −48.6 dB can be obtained at 13.9 GHz with a thickness of 3.0 mm, and the absorption bandwidth with RL below −10 dB is 7.1 GHz from 10.9 GHz to 18 GHz. These results demonstrate a facile method to prepare a highly efficient microwave absorption material with special microstructure.
1. Introduction
More and more microwave radiation is generated through the development of science and technology, causing pollution to the environment and cause harm to human beings. So over the past few years, tremendous research efforts have been focused on the fabrication of microwave absorption materials.1–4 According to absorption mechanism,5 traditional microwave absorption materials can classified into magnetic loss materials such as ferrite6 and magnetic metal powders,7 and dielectric loss materials such as metal oxides,8 carbon materials9 and conduction polymers.10 Compared with conductive loss materials, magnetic loss materials have a high density and a narrow bandwidth.11 It is efficient to combine magnetic loss materials with conductive loss materials in order to enhance microwave absorption ability.5As a traditional microwave absorption material, Fe3O4 has great potential due to its strong absorption properties and low cost.12 However, its high density and narrow absorption frequency bandwidth limit the application of pure Fe3O4 material.13 For a magnetic material Fe3O4 has a relatively small permittivity, which limits its widespread use in the microwave absorption field.14 Meanwhile, the microwave absorption properties of absorbers also depend on their size, structure and morphology.15 Therefore various Fe3O4 of different structures, and its composites combined with ZnO,16 polyaniline,13 graphene,17,18 and other dielectric materials,19,20 have been explored to improve the balance between permittivity and permeability. Liu et al. synthesized heterostructured nanorings of Fe3O4@C and Fe3O4/Fe@C, which show enhanced absorption properties and absorption bandwidth.21 Sun et al. obtained hierarchical dendrite-like materials of Fe3O4, γ-Fe2O3 and Fe with excellent microwave absorption ability at low or middle frequency.22 Core–shell Fe3O4@C composites with different thicknesses of the carbon shell were prepared and the relationship between absorption ability and thickness of the carbon shell was explored according to Du’s work.23
Because of high surface areas, low density and carrier mobilities coupled with abundant defects and hydroxyl, epoxy, and carboxyl groups, reduced graphene oxide (RGO) has received much attention in the microwave absorption field.24 Pristine RGO has unsatisfactory microwave absorption because of agglomeration effects and a permittivity that is too high, which is disadvantage to impedance matching.25 On the other hand, due to its special microstructure RGO can serve as a template for the growth of metal oxide nanoparticles and polymers. Therefore, decorating RGO with magnetic and dielectric materials such as ZnO,26 Fe3O4,27 Co3O4,28 MnO2,29 NiFe2O4,30 and polyaniline,31 is an effective method to solve the problem of impedance matching, and it can also prevent the aggregation of nanoparticles. Ren et al. fabricated a 3D SiO2@Fe3O4 core/shell nanorod array/graphene composite with a maximum RL of −31.9 dB.19
The aim of this work was to synthesize core/shell nanostructures using GO as the template. Herein, porous Fe3O4@C core/shell nanorods decorated with reduced graphene oxide were synthesized by a facile one-pot method. We also explored the microwave absorption properties of Fe3O4@C/RGO for different weight ratios of RGO. The experimental results show that this composite has an enhanced microwave absorption ability with strong absorption (maximum reflection loss of −48.6 dB), small thickness (3.0 mm), and a broad effective absorption bandwidth (7.1 GHz) when RL < 10 dB. The results indicate that porous Fe3O4@C core/shell nanorod/RGO prepared though this facile method, which possesses excellent microwave absorption ability, is an ideal candidate for microwave absorbers.
2. Experimental
All chemicals were obtained from Alfa Aesar and used without further purification except the aniline monomer. The aniline monomer was purified by distillation under the protection of high purity N2 before use. Graphene oxide (GO) was prepared through a modified Hummer’s method.4 Deionized water was prepared by Aquapro EDI2-3002-U.2.1 Synthesis of porous Fe3O4@C core/shell nanorod
0.8 g FeCl3·6H2O, 1.8 g urea and different concentrations of glucose (0.1, 0.2, 0.3 M) were added into 30 ml DI H2O and stirred for 1 hour to ensure full dispersion. The resultant solution was transferred into a 100 ml Teflon-lined stainless steel autoclave and kept at 180 °C for 8 h. The black solution was centrifuged and washed with ethanol and DI H2O, and then dried by vacuum cryogenic desiccation for 12 h. At last, the powders were sintered at the temperature of 400 °C for 1 h under Ar atmosphere. The synthesis method of pure Fe3O4 was the same as for Fe3O4@C, but without glucose.2.2 Synthesis of porous Fe3O4@C core/shell nanorod/graphene (Fe3O4@C/RGO)
A certain amount of GO powder was dispersed in 30 ml DI H2O and stirred for 12 hours under strong magnetic stirring, followed by sonication for 4 hours to obtain a GO suspension of differing concentrations (0.2, 0.4, 0.8, 1.2 mg ml−1). 0.8 g FeCl3·6H2O, 1.8 g urea and 1 g glucose were added into the GO solution and stirred for 1 hour to obtain a clear solution. The resultant solution was transferred into a 100 ml Teflon-lined stainless steel autoclave and kept at 180 °C for 8 h. The black solution was centrifuged and washed with ethanol and DI H2O, and then dried by vacuum cryogenic desiccation for 12 h. As was done for Fe3O4@C, the powders were also sintered at the temperature of 400 °C for 1 h under Ar atmosphere. The samples with different concentrations of RGO were named CFG1 (0.2 mg ml−1), CFG2 (0.4 mg ml−1), CFG3 (0.8 mg ml−1) and CFG4 (1.2 mg ml−1).2.3 Measurements
The morphology of the products was observed by transmission electron microscopy (TEM: 1200EX, JEM) and a high-resolution transmission electron microscope (HRTEM: Tecnai G2 F20 S-TWIN, FEI). The structural and elemental characterization of the samples was carried out by powder X-ray diffraction (XRD: D8 Advance, Bruker) using Co Kα radiation, Raman spectroscopy (Renishaw inVia) and Thermogravimetric Analysis (TGA: TGA/DSC 1 SF/1382, METTLER). The magnetic properties were studied by a vibrating-sample magnetometer (ASM: Squid-VSM, Quantum Design). X-ray photoelectron spectra were obtained using an X-ray photoelectron spectrometer (XPS: Thermo ESCALAB 250XI, Thermo Electron Corporation).The samples for electromagnetic parameter measurement were prepared by mixing paraffin with 40 wt% sample, which was pressed into toroidal shapes of 3 mm in inner diameter, 7 mm in outer diameter, and a thickness of 2 mm. The complex permittivity and complex permeability of the samples was characterized by a HP8722ES vector network analyzer in the frequency range 1–18 GHz. The reflection loss (RL) is calculated according to the following equations:32
 | (1) |
 | (2) |
3. Results and discussion
The morphologies of Fe3O4, Fe3O4@C and Fe3O4@C/RGO were investigated by TEM (Fig. 1 and S1†). As shown in Fig. 1a, the pure Fe3O4 nanorods are like needles 50–90 nm in size. Following the addition of glucose, Fe3O4@C has a porous structure. When the concentration of glucose is 0.1 M (Fig. S1b†), it exhibits no significant change compared with pure Fe3O4. Continuing the increase in concentration of glucose to 0.2 M (Fig. 1b and S1c†), a thin carbon film is coated on the Fe3O4 nanorod with a porous structure. From Fig. S1d,† when the concentration of glucose is larger than 0.3 M, the polymerization of more glucose will link Fe3O4@C together to form a film resulting in an aggregation phenomenon. In order to prevent the aggregation of Fe3O4@C, graphene was introduced into the synthetic system. As shown in Fig. 1c, Fe3O4@C growth on the surface of graphene sheets is relatively scattered compared with that for pure Fe3O4@C (Fig. 1c). More importantly, the HRTEM (Fig. 1d) shows a clear core/shell structure.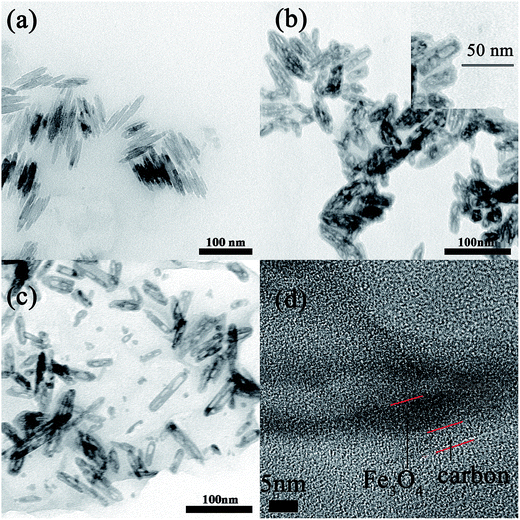 | ||
| Fig. 1 TEM images of (a) Fe3O4 nanorods, (b) Fe3O4@C, (c) Fe3O4@C/RGO (CFG2), and (d) HRTEM of Fe3O4@C/RGO (CFG2). | ||
To further investigate the structure of Fe3O4@C, the samples were subjected to thermal treatments of different temperature under air atmosphere. In this process, the carbon atoms which are coated on Fe3O4 can react with oxygen in the air: C + O2 = CO2. Thus, pure and porous Fe3O4 nanorods without carbon could be obtained. In Fig. 2b, there is still a carbon film coating on the Fe3O4 nanorods following thermal treatment at the temperature of 300 °C. However, following thermal treatment at the temperature of 400 °C, the carbon atoms had reacted sufficiently. But with a further increase to the temperature of thermal treatment the structure of Fe3O4 breaks, which can be obviously seen in Fig. 2d.
The structure and magnetic properties of Fe3O4@C/RGO (CFG2) were investigated by XRD, Raman, TGA and using the magnetisation curve. Fig. 3a demonstrates the X-ray diffraction patterns of Fe3O4@C and Fe3O4@C/RGO. The diffraction peaks of Fe3O4@C are observed at 2θ = 21.2°, 35.1°, 41.4°, 50.4°, 62.9°, 67.2° and 74.2° corresponding to the (1 1 1), (2 2 0), (3 1 1), (4 0 0), (4 2 2), (5 1 1) and (4 4 0) reflections of Fe3O4, respectively. These peak values of Fe3O4 matched the standard XRD pattern (JCPDS no. 19-0629).16 For Fe3O4@C/RGO, the main peaks of Fe3O4@C can be found which prove the successful synthesis of Fe3O4@C and the existence of RGO has no effect on the crystal structure of Fe3O4. In Fig. S2,† two lattice spacings can be seen which correspond to the (2 2 0) and (3 1 1) reflections of Fe3O4. The broad peak appearing at 30° is attributed to amorphous carbon.33 In the Raman spectrum of Fe3O4@C/RGO (Fig. 3b) the D band at 1338.44 cm−1 and the G band at 1584.44 cm−1, which correspond to defects or the edge and vibration of sp2 hybridized carbon–carbon bonds, were observed.12 The TGA pattern of Fe3O4@C/RGO shows two weight losses. The first slow decrease of the TG curve before 230 °C is attributed to the removal of residual functional groups on RGO.34 The second is in the range 230–450 °C, and is due to the decomposition of RGO and other amorphous carbon. After 450 °C the TG curve remains stable, revealing the complete removal of RGO and amorphous carbon. For CFG2, the weight ratio of Fe3O4 is 36.5%. To understand the magnetic properties of Fe3O4@C/RGO, the room-temperature magnetic properties of CFG2 were examined with a magnetometer. As shown in Fig. 3d, significant hysteresis loops in the M–H curve are observed, indicating the ferromagnetic behavior of CFG2. The values of magnetization (Ms) for CFG1, CFG2, CFG3 and CFG4 are 22.0, 24.8, 23.8 and 22.4 emu g−1, which are smaller than the corresponding bulk value (92 emu g−1)35 due to the present of nonmagnetic graphene and amorphous carbon. The higher value of Ms for CFG2 can be attributed to the better dispersion of Fe3O4. The lower value of Ms of CFG3 and CFG4 is due to the increased weight of graphene which influences the Ms more than the dispersion.
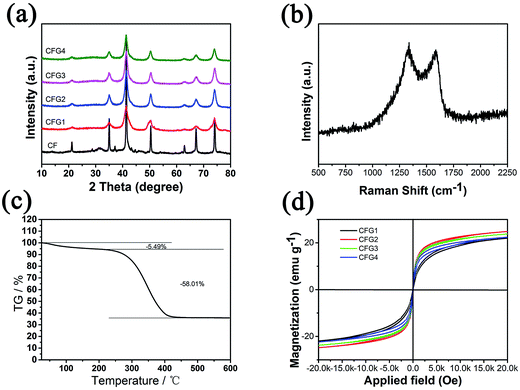 | ||
| Fig. 3 (a) XRD pattern, (b) Raman spectrum, (c) TGA graph, and (d) magnetization curve of CFG, of Fe3O4@C. | ||
The detailed elemental composition of CFG2 was characterized by XPS; the resulting spectra are shown in Fig. 4. In the full scan XPS spectrum (Fig. 4a), four sharp peaks with binding energies of 285, 399, 532 and 711 eV, were attributed to C 1s, N 1s, O 1s and Fe 2p, respectively; this result confirms the presence of C, N, O and Fe elements in the composite. Among these, the presence of N indicates the participation of urea in the synthetic process. For further investigation the electronic states of the elements were determined from the high-resolution spectra. In the C 1s spectrum (Fig. 4b) the fitted peaks with binding energy of 284.7, 285.9 and 288.6 eV can be attributed to C–C, C–O and C![[double bond, length as m-dash]](https://www.rsc.org/images/entities/char_e001.gif) O, respectively. Fig. 4c shows that the Fe 2p spectrum can be divided into two fitted peaks, corresponding to Fe 2p1/2 (725.1 eV) and Fe 2p3/2 (711.1 eV).36 Two peaks are present at 533.4 eV and 532.0 eV in the high resolution spectrum of O 1s in Fig. 4d, which can be attributed to C–O/C
O, respectively. Fig. 4c shows that the Fe 2p spectrum can be divided into two fitted peaks, corresponding to Fe 2p1/2 (725.1 eV) and Fe 2p3/2 (711.1 eV).36 Two peaks are present at 533.4 eV and 532.0 eV in the high resolution spectrum of O 1s in Fig. 4d, which can be attributed to C–O/C![[double bond, length as m-dash]](https://www.rsc.org/images/entities/char_e001.gif) O and Fe3O4. The high-resolution spectrum of N shown in Fig. S3† demonstrates N doping in the composite. From the high-resolution XPS spectrum of N (Fig. S3†), three peaks corresponding to imine (–N
O and Fe3O4. The high-resolution spectrum of N shown in Fig. S3† demonstrates N doping in the composite. From the high-resolution XPS spectrum of N (Fig. S3†), three peaks corresponding to imine (–N![[double bond, length as m-dash]](https://www.rsc.org/images/entities/char_e001.gif) ), amine (–NH–) and protonated amine (–N+–) can be found. The XPS results further confirm the reduction of GO, during which the Fe3O4@C nanorods were formed on the surface of the graphene sheets.
), amine (–NH–) and protonated amine (–N+–) can be found. The XPS results further confirm the reduction of GO, during which the Fe3O4@C nanorods were formed on the surface of the graphene sheets.
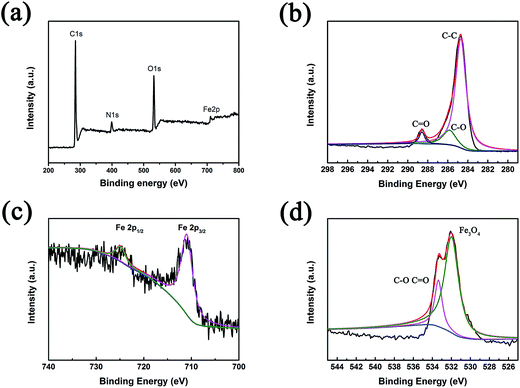 | ||
| Fig. 4 XPS spectra of the CFG2 composite: (a) overview; (b), (c) and (d) are the high-resolution spectra of C, Fe, O, respectively. | ||
To understand the possible microwave absorption mechanism, the relative complex permittivity and permeability of the Fe3O4@C and Fe3O4@C/RGO composites were investigated in the frequency range 1–18 GHz (Fig. 5 and S4†). Fig. 5a and b show the real (ε′) and imaginary (ε′′) parts of the relative complex permittivity (εr = ε′ − jε′′) of the Fe3O4@C/RGO composites with differing compositions of RGO. The values of ε′ and ε′′ prominently increase compared with those of Fe3O4@C (Fig. S4a and b†). For Fe3O4@C/RGO composites, when increasing the content of GO, the value of ε′ shows differing levels of improvement. For CFG1 and CFG2, ε′ slightly increases. But, when further increasing the weight ratio of GO, the ε′ values are obviously enhanced. This is due to a better conducting network, which can be formed when more GO is added into the materials system. The rise in the RGO weight ratio of Fe3O4@C/RGO composites benefits the increase in conductivity, resulting in strong dielectric loss. Two dielectric relaxation peaks can be found in the ε′′ curve ranged from 6–16 GHz, which can be attributed to dipole polarization and interfacial polarization from the interface of Fe3O4 cores, C shells and RGO. Following an increase in the weight ratio of RGO the dielectric relaxation peaks are more notable, which proves that the aggregation of Fe3O4@C can be prevented by the addition of RGO, resulting in more contact interface with microwaves. The real (μ′) and imaginary (μ′′) parts of the relative complex permeability are enhanced by the addition of RGO (Fig. S4c and d†) and Fe3O4@C/RGO (Fig. 5c and d). RGO can prevent the agglomeration of Fe3O4 which enhances the magnetic domain order with better magnetic performance. Fig. S5† shows the dielectric loss tangent (tgδε = ε′′/ε′) and magnetic loss tangent (tgδμ = μ′′/μ′) for Fe3O4@C and Fe3O4@C/RGO composites. The values of tgδε and tgδμ for Fe3O4@C/RGO are larger than those for Fe3O4@C, which can be attributed to the addition of RGO. RGO can increase the conductivity of composites and prevent the agglomeration of Fe3O4@C, resulting in enhanced microwave absorption abilities. Oxygenic functional groups residing on the surface of RGO can also generate dielectric loss.37
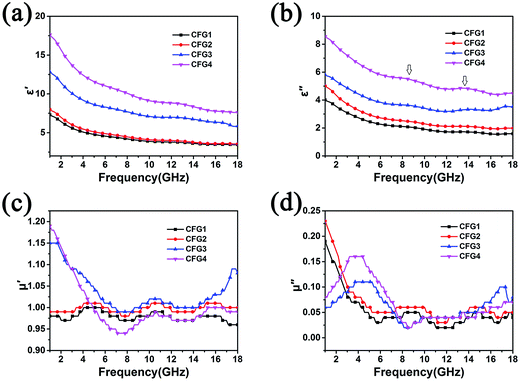 | ||
| Fig. 5 The real part (a) and imaginary part (b) of the permittivity, and the real part (c) and imaginary part (d) of the permeability for Fe3O4@C/RGO composites with different compositions of RGO. | ||
The Debye dielectric relaxation model was adopted to investigate the mechanisms of the permittivity dispersion. According to Debye theory, the relationship between ε′ and ε′′ can be described as:38
 | (3) |
 | (4) |
As shown in Fig. 6a, the α values increase with the increase in composition of RGO, indicating that a high weight ratio of RGO can generate a higher energy attenuation. However, a high dielectric constant also allows for more microwave reflection. Therefore, matching of characteristic impedance is another important factor for microwave absorption materials. According to the principle of impedance matching, when the impedance of incident (Zin) is equal to the impedance of freedom space (Z0), there is no reflection on the interfaces between the materials and air because of optimal impedance matching with the free space. Therefore, the closer the value of |Zin/Z0| is to 1, the better the impedance matching. Fig. 6b shows the value of |Zin/Z0| for Fe3O4@C/RGO for different weight ratio of RGO, and indicates that CFG2 and CFG3 have better impedance matching than CFG1 and CFG4. As a result, more RGO can enhance the energy attenuation, however, it will deteriorate the impedance matching which degrades the microwave absorption performance.
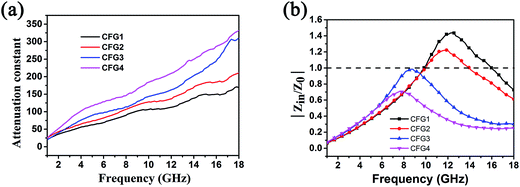 | ||
| Fig. 6 (a) The attenuation constants of Fe3O4@C/RGO with different weight ratios of RGO, and (b) frequency dependencies of |Zin/Z0|. | ||
In order to evaluate the microwave absorption properties of Fe3O4@C and Fe3O4@C/RGO composites, the reflection losses (RL) were calculated. As shown in Fig. S7,† the RL values of Fe3O4@C composite cannot reach −10 dB within the thickness range of 0.5–5.5 mm, and the maximum RL is −5.5 dB at 18 GHz when the thickness is 5.5 mm, revealing poor microwave absorption ability. However, with the addition of RGO, the RL of Fe3O4@C/RGO composites show significant enhancement. Fig. 7 displays the relationship between RL, frequency, and thickness for Fe3O4@C/RGO composites. It can be seen that the microwave absorption properties of the composites show strong dependence upon the weight ratio of RGO. For CFG1 (Fig. 7a), the maximum value of RL is −30.1 dB at 8.0 GHz. When the concentration of GO reaches 0.4 mg ml−1 (Fig. 7b), a maximum RL value of −48.6 dB is obtained at 13.9 GHz with a thickness of 3.0 mm, and the absorption bandwidth with the RL below −10 dB is 7.1 GHz from 10.9 GHz to 18 GHz. Following increase of the concentration of GO to 0.8 mg ml−1 and 1.2 mg ml−1, the maximum RL of CFG3 (Fig. 7c) and CFG4 (Fig. 7d) decrease to −30.4 dB and −15.1 dB, respectively. It is well known that too high a permittivity can result in the strong reflection of microwaves due to harmful impedance matching.24 The maximum RL, corresponding absorption bandwidth, and optimum thickness are shown in Table S1.† It is clearly seen that when increasing the content of RGO, the optimum thickness of composite shifts to a low thickness.
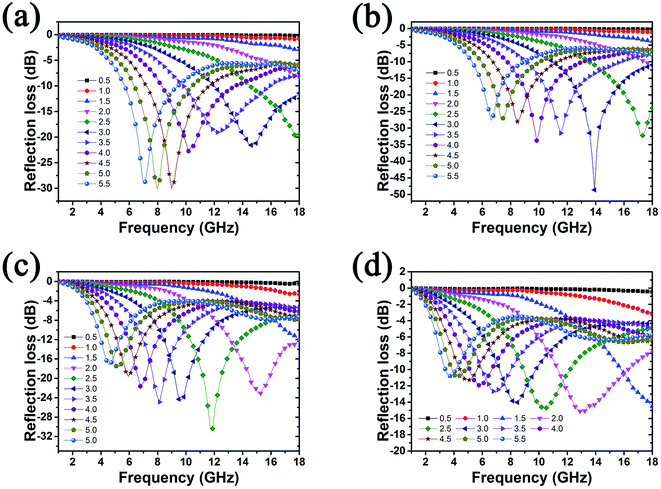 | ||
| Fig. 7 Refection loss of Fe3O4@C/RGO composites with different weight ratios of graphene: (a) CFG1, (b) CFG2, (c) CFG3, and (d) CG4. | ||
Table 1 presents typical Fe3O4-based composites and their corresponding microwave absorption properties, from recently published works. Compared with most of them, the Fe3O4@C/RGO composites show prominent microwave absorption properties and are attractive candidates for microwave absorbers. In this present Fe3O4@C/RGO system, that the Fe3O4@C nanorods with porous structure enhanced the microwave absorption properties can be attributed to the following reasons. Firstly, the porous structure can cause multiple reflections which would enhance the absorption of microwaves.41 Secondly, RGO can be uses as substrate for the deposition of Fe3O4@C to prevent their agglomeration, enhancing the contact area between Fe3O4@C and microwaves. Thirdly, the residual oxygen functional groups on the RGO surface act as polarized centers which improve reflection loss.24 Meanwhile, RGO can enhance the impedance matching of composites due to its improved permittivity.
| Filler | Fill loading | Optimum frequency (GHz) | Optimum thickness (mm) | Maximum RL (dB) | Absorption bandwidth (GHz) (RL < 10) | Ref. |
|---|---|---|---|---|---|---|
| Carbon@Fe@Fe3O4 | 50% | — | 1.5 | −40 | 5.2 | 42 (2015) |
| Fe3O4/SiO2/polyvinylidene fluoride | 40% | 8.1 | 2.5 | −28.6 | — | 43 (2015) |
| Polyvinylidene fluoride/Fe3O4@polypyrrole | — | 16.8 | 2.5 | −21.5 | 6.1 | 44 (2016) |
| Fe3O4@SnO2/RGO | 50% | 6.4 | 4.5 | −45.5 | 3 | 45 (2016) |
| Fe3O4/C | 60% | 3.44 | 6.2 | −55.68 | 9.55 (RL < 20) | 46 (2016) |
| Fe3O4/graphene capsules | 30% | 8.76 | 3.5 | −32 | 11.6 | 47 (2016) |
| Fe3O4@BaTiO3/RGO | 50% | 5 | 4 | −38.2 | 13.9 | 48 (2016) |
| Fe3O4/polypyrrole/carbon nanotube | 20% | 10.2 | 3 | −25.9 | 4.5 | 49 (2016) |
| Fe3O4@MnO2 | 20% | 5.7 | 4 | −42.6 | 6.7 | 50 (2017) |
| Fe3O4@C/RGO | 40% | 13.9 | 3 | −48.6 | 7.1 | This work |
4. Conclusion
In conclusion, porous Fe3O4@C core/shell nanorods decorated with reduced graphene oxide were synthesized by a facile one-pot method. The microwave absorption properties of Fe3O4@C/RGO composites with different weight ratios of RGO were investigated. The weight ratio of RGO has a significant influence on the microwave absorption properties of Fe3O4@C/RGO. When the concentration of GO is 0.4 mg ml−1, the Fe3O4@C/RGO composite exhibits excellent microwave absorption properties. A maximum RL value of −48.6 dB can be obtained at 13.9 GHz with a thickness of 3.0 mm, and the absorption bandwidth with RL below −10 dB is 7.1 GHz from 10.9 GHz to 18 GHz. The enhanced microwave absorption performance of these composites is mainly attributed to enhanced permittivity, improved impedance matching, the relative dispersing of Fe3O4@C compared with pure Fe3O4@C, and the residual functional groups on the reduced graphene oxide surface. It is believed that such composites will find widespread applications in the microwave absorption field.Conflicts of interest
There are no conflicts to declare.Acknowledgements
This work was supported by the National Basic Research Program: (2016YFA0202300, 2016YFA0202302), the National Natural Science Fund Project under Contract no. (61527817, 61335006, 61378073) and the Beijing Science and Technology Committee (Z151100003315006).References
- X. L. Dong, X. F. Zhang, H. Huang and F. Zuo, Appl. Phys. Lett., 2008, 92, 013127 CrossRef.
- X. Bai, Y. Zhai and Y. Zhang, J. Phys. Chem. C, 2011, 115, 11673–11677 CAS.
- V. K. Singh, A. Shukla, M. K. Patra, L. Saini, R. K. Jani, S. R. Vadera and N. Kumar, Carbon, 2012, 50, 2202–2208 CrossRef CAS.
- K. Singh, A. Ohlan, V. H. Pham, R. Balasubramaniyan, S. Varshney, J. Jang, S. H. Hur, W. M. Choi, M. Kumar, S. K. Dhawan, B. S. Kong and J. S. Chung, Nanoscale, 2013, 5, 2411–2420 RSC.
- J. Huo, L. Wang and H. Yu, J. Mater. Sci., 2009, 44, 3917–3927 CrossRef CAS.
- J. Shen, Y. Yao, Y. Liu and J. Leng, J. Mater. Chem. C, 2016, 4, 7614–7621 RSC.
- Q. Liu, Q. Cao, H. Bi, C. Liang, K. Yuan, W. She, Y. Yang and R. Che, Adv. Mater., 2016, 28, 486–490 CrossRef CAS PubMed.
- B. Zhao, B. Fan, Y. Xu, G. Shao, X. Wang, W. Zhao and R. Zhang, ACS Appl. Mater. Interfaces, 2015, 7, 26217–26225 CAS.
- G. Li, T. Xie, S. Yang, J. Jin and J. Jiang, J. Phys. Chem. C, 2012, 116, 9196–9201 CAS.
- X.-J. Zhang, G.-S. Wang, Y.-Z. Wei, L. Guo and M.-S. Cao, J. Mater. Chem. A, 2013, 1, 12115 CAS.
- G. Wang, Z. Gao, G. Wan, S. Lin, P. Yang and Y. Qin, Nano Res., 2014, 7, 704–716 CrossRef CAS.
- C. Hu, Z. Mou, G. Lu, N. Chen, Z. Dong, M. Hu and L. Qu, Phys. Chem. Chem. Phys., 2013, 15, 13038–13043 RSC.
- P. Liu, Y. Huang and X. Zhang, J. Alloys Compd., 2014, 596, 25–31 CrossRef CAS.
- J. Zheng, H. Lv, X. Lin, G. Ji, X. Li and Y. Du, J. Alloys Compd., 2014, 589, 174–181 CrossRef CAS.
- C. Zhou, S. Geng, X. Xu, T. Wang, L. Zhang, X. Tian, F. Yang, H. Yang and Y. Li, Carbon, 2016, 108, 234–241 CrossRef CAS.
- D. Sun, Q. Zou, Y. Wang, Y. Wang, W. Jiang and F. Li, Nanoscale, 2014, 6, 6557–6562 RSC.
- H.-L. Xu, H. Bi and R.-B. Yang, J. Appl. Phys., 2012, 111, 07A522 CrossRef.
- B. Qu, C. Zhu, C. Li, X. Zhang and Y. Chen, ACS Appl. Mater. Interfaces, 2016, 8, 3730–3735 CAS.
- Y. Ren, C. Zhu, S. Zhang, C. Li, Y. Chen, P. Gao, P. Yang and Q. Ouyang, Nanoscale, 2013, 5, 12296–12303 RSC.
- N. Zhang, Y. Huang and M. Wang, Composites, Part B, 2018, 136, 135–142 CrossRef CAS.
- Y. Liu, Y. Li, K. Jiang, G. Tong, T. Lv and W. Wu, J. Mater. Chem. C, 2016, 4, 7316–7323 RSC.
- G. Sun, B. Dong, M. Cao, B. Wei and C. Hu, Chem. Mater., 2011, 23, 1587–1593 CrossRef CAS.
- Y. Du, W. Liu, R. Qiang, Y. Wang, X. Han, J. Ma and P. Xu, ACS Appl. Mater. Interfaces, 2014, 6, 12997–13006 CAS.
- C. Wang, X. Han, P. Xu, X. Zhang, Y. Du, S. Hu, J. Wang and X. Wang, Appl. Phys. Lett., 2011, 98, 072906 CrossRef.
- C. Song, X. Yin, M. Han, X. Li, Z. Hou, L. Zhang and L. Cheng, Carbon, 2017, 116, 50–58 CrossRef CAS.
- M. Han, X. Yin, L. Kong, M. Li, W. Duan, L. Zhang and L. Cheng, J. Mater. Chem. A, 2014, 2, 16403–16409 CAS.
- M. Zong, Y. Huang, Y. Zhao, L. Wang, P. Liu, Y. Wang and Q. Wang, Mater. Lett., 2013, 106, 22–25 CrossRef CAS.
- G.-S. Wang, Y. Wu, Y.-Z. Wei, X.-J. Zhang, Y. Li, L.-D. Li, B. Wen, P.-G. Yin, L. Guo and M.-S. Cao, ChemPlusChem, 2014, 79, 375–381 CrossRef CAS.
- T. K. Gupta, B. P. Singh, V. N. Singh, S. Teotia, A. P. Singh, I. Elizabeth, S. R. Dhakate, S. K. Dhawan and R. B. Mathur, J. Mater. Chem. A, 2014, 2, 4256 CAS.
- F. Yan, D. Guo, S. Zhang, C. Li, C. Zhu, X. Zhang and Y. Chen, Nanoscale, 2018, 10, 2697–2703 RSC.
- H. Yu, T. Wang, B. Wen, M. Lu, Z. Xu, C. Zhu, Y. Chen, X. Xue, C. Sun and M. Cao, J. Mater. Chem., 2012, 22, 21679 RSC.
- B. Liang, S. Wang, D. Kuang, L. Hou, B. Yu, L. Lin, L. Deng, H. Huang and J. He, Nanotechnology, 2018, 29, 085604 CrossRef PubMed.
- X. Zheng, W. Lv, Y. Tao, J. Shao, C. Zhang, D. Liu, J. Luo, D.-W. Wang and Q.-H. Yang, Chem. Mater., 2014, 26, 6896–6903 CrossRef CAS.
- W. Feng, Y. Wang, J. Chen, L. Wang, L. Guo, J. Ouyang, D. Jia and Y. Zhou, Carbon, 2016, 108, 52–60 CrossRef CAS.
- H. Xu, M. Shao, T. Chen, S. Zhuo, C. Wen and M. Peng, Microporous Mesoporous Mater., 2012, 153, 35–40 CrossRef CAS.
- S. Mondal, U. Rana and S. Malik, J. Phys. Chem. C, 2017, 121, 7573–7583 Search PubMed.
- B. Wen, M. Cao, M. Lu, W. Cao, H. Shi, J. Liu, X. Wang, H. Jin, X. Fang, W. Wang and J. Yuan, Adv. Mater., 2014, 26, 3484–3489 CrossRef CAS PubMed.
- M. Zong, Y. Huang, Y. Zhao, X. Sun, C. Qu, D. Luo and J. Zheng, RSC Adv., 2013, 3, 23638 RSC.
- S. He, G.-S. Wang, C. Lu, J. Liu, B. Wen, H. Liu, L. Guo and M.-S. Cao, J. Mater. Chem. A, 2013, 1, 4685 CAS.
- J. N. Ma, X. M. Zhang, W. Liu and G. B. Ji, J. Mater. Chem. C, 2016, 4, 11419–11426 RSC.
- Z. Wang, L. Zhao, P. Wang, L. Guo and J. Yu, J. Alloys Compd., 2016, 687, 541–547 CrossRef CAS.
- H. Lv, G. Ji, W. Liu, H. Zhang and Y. Du, J. Mater. Chem. C, 2015, 3, 10232–10241 RSC.
- X. Liu, Y. Chen, X. Cui, M. Zeng, R. Yu and G.-S. Wang, J. Mater. Chem. A, 2015, 3, 12197–12204 CAS.
- Y. Li, Y. Zhao, X. Lu, Y. Zhu and L. Jiang, Nano Res., 2016, 9, 2034–2045 CrossRef CAS.
- Y. Wang, Z. Peng and W. Jiang, Ceram. Int., 2016 DOI:10.1016/j.ceramint.2016.03.180.
- T. Wu, Y. Liu, X. Zeng, T. Cui, Y. Zhao, Y. Li and G. Tong, ACS Appl. Mater. Interfaces, 2016, 8, 7370–7380 CAS.
- X. Jian, B. Wu, Y. Wei, S. X. Dou, X. Wang, W. He and N. Mahmood, ACS Appl. Mater. Interfaces, 2016, 8, 6101–6109 CAS.
- Z. Peng, W. Jiang, Y. Wang and S. Zhong, J. Mater. Sci.: Mater. Electron., 2015, 27, 1304–1313 CrossRef.
- R.-B. Yang, P. M. Reddy, C.-J. Chang, P.-A. Chen, J.-K. Chen and C.-C. Chang, Chem. Eng. J., 2016, 285, 497–507 CrossRef CAS.
- M. Qiao, X. Lei, Y. Ma, L. Tian, W. Wang, K. Su and Q. Zhang, J. Alloys Compd., 2017, 693, 432–439 CrossRef CAS.
Footnote |
| † Electronic supplementary information (ESI) available. See DOI: 10.1039/c8ra01838c |
| This journal is © The Royal Society of Chemistry 2018 |

