DOI:
10.1039/C8RA01485J
(Paper)
RSC Adv., 2018,
8, 12641-12652
A series of Ln4III clusters: Dy4 single molecule magnet and Tb4 multi-responsive luminescent sensor for Fe3+, CrO42−/Cr2O72− and 4-nitroaniline†
Received
17th February 2018
, Accepted 26th March 2018
First published on 3rd April 2018
Abstract
Five tetranuclear lanthanide clusters of compositions [Ln4L4(NO3)2(Piv)2]·2CH3OH (Ln = Gd (1), Tb (2), Dy (3), Ho (4), Er (5); H2L = 2-(((2-hydroxy-3-methoxybenzyl)imino)methyl)-6-methoxyphenol; Piv = pivalic acid) were synthesized under solvothermal conditions. The structures of 1–5 were characterized by single-crystal X-ray crystallography. Complexes 1–5 possess a zig-zag topology with [Ln4O6] cores being formed by the fusion of oxygen atom-bridged two [Ln2O2] moieties. Direct-current magnetic susceptibility studied in the 2–300 K range revealed weak antiferromagnetic interactions in 1, 2, 4, 5 and ferromagnetic interactions in 3. Complex 3 exhibits single molecule magnet (SMM) behavior. The luminescence studies indicated that complex 2 can serve as highly sensitive and selective luminescent materials for Fe3+, CrO42−, Cr2O72− and 4-nitroaniline (4-NA), demonstrating that complex 2 should be a potential candidate for multi-responsive luminescent sensor.
Introduction
Polynuclear lanthanide clusters have been attracting considerable attention due to their fascinating structures1 as well as potential applications in single molecule magnets (SMMs),2 luminescent devices3 and magnetocaloric materials.4 SMMs are of considerable promise as molecular spintronic devices for high-density data storage.5 The significant anisotropy of lanthanides arising from large unquenched orbital angular momentum2a,2u has made lanthanides to be attractive candidates for SMMs. Recently, the research efforts towards lanthanide SMMs have been devoted to polynuclear complexes with variable nuclearities.2 Moreover, owing to the characteristic sharp emission peaks, a large Stokes shift and a wide emission range, the utilization of lanthanide complexes as luminescent materials, particularly luminescent sensor,6 also attracts intensive interest.
Fe3+ ion plays an important role in industry and in various metabolic processes.7 However, excessive Fe3+ ion probably leads to some diseases, such as Alzheimer's disease, due to production of reactive oxygen species (ROS).8 CrO42− and Cr2O72− ions can cause severe environment pollution,9 gemmulation, renal failure, lung cancer, and skin allergy by prolonged exposure.10 Nitroaromatic compounds (NACs), e.g., nitroaromatic (NB), 4-nitrophenol (4-NP), 4-nitroaniline (4-NA), 4-nitrotoluene (4-NT), 4-nitrochlorobenzene (4-Cl-NB), 2,4-dinitrotoluene (2,4-DNT), 2,4-dinitrophenol (2,4-DNP), etc., are threatening human life.11 Thus, it is of high importance to develop fast and facile methods for detecting those ions and compounds. A number of fluorescence-based sensing materials based on metal–organic frameworks (MOFs),12 coordination polymers,13 and mononuclear compounds14 have been utilized to detect specific target inorganic anions, cations or organic molecules, due to high efficiency, selectivity and simplicity. Whereas, luminescent sensors base on lanthanide polynuclear clusters were rarely studied. The recent advances in this area indicated that they are potential sensors for nitroaromatic explosive compounds15 and F− ion.16
We are interested in designing and synthesizing LnIII clusters supported by o-vanillin-containing Schiff base ligand 2-(((2-hydroxy-3-methoxybenzyl)imino)methyl)-6-methoxyphenol (H2L) and pivalic acid. The selection of both H2L and pivalic acid as the ligands is based on the following considerations. (i) The combination of the o-vanillin-based ligand and pivalic acid fosters the formation of polynuclear clusters owing to the incorporation of the phenolic oxygen atoms from the H2L ligand with the carboxylate group from pivalic acid. (ii) H2L is an electron rich π-conjugated multidentate organic ligand, which can act as antennae to sensitize the weak luminescent metal centres, such as Tb(III). (iii) Although the single molecule magnet behaviours of a series of LnIII clusters have been studied, their multiple fluorescence detection abilities towards Fe3+, CrO42−/Cr2O72−, and NACs have not been reported. In this work, five tetranuclear lanthanide clusters of compositions [Ln4L4(NO3)2(Piv)2]·2CH3OH (Ln = Gd (1), Tb (2), Dy (3), Ho (4), Er (5)) supported by H2L were synthesized via solvothermal method. Complexes 1–5 possess [Ln4O6] cores formed by the fusion of two phenoxide oxygen-bridged two [Ln2O2] moieties. The magnetic studies indicated antiferromagnetic interactions in 1, 2, 4 and 5. Complex 3 exhibits typical single molecule magnet behaviour. The luminescent sensing properties of 2 for selective and sensitive detections of Fe3+, CrO42−/Cr2O72− ions in aqueous solutions and 4-NA in ethanol solutions were also investigated. The low detection limits and high quenching constants KSV indicate that complex 2 may potentially be considered as a multi-responsive luminescence-based sensor for quantitative and highly sensitive detections of 4-NA, Fe3+ and CrO42−/Cr2O72− ions.
Experimental section
Synthesis of 2-(((2-hydroxy-3-methoxybenzyl)imino)methyl)-6-methoxyphenol (H2L)
All solvents and regents were of analytical grade and used as received without further purification. 3-Methoxysalicylamine was prepared according to the reported procedure.17 A solution of methoxysalicylaldehyde (20 mmol) in ethanol was added to a solution of 3-methoxysalicylamine (20 mmol) in 15 mL ethanol. After the reaction mixture was stirred at room temperature for 4 hours, yellow precipitates were formed. The yellow precipitates were isolated, washed with hexane and dried in vacuum to afford the product as a yellow solid (Scheme 1). Yield: 4.76 g (83%). 1H NMR (600 MHz, chloroform-d) δ 8.38 (s, 1H), 6.90–6.84 (m, 3H), 6.83–6.74 (m, 3H), 4.82 (s, 2H), 3.87 (s, 3H), 3.85 (s, 3H). 13C NMR (151 MHz, chloroform-d) δ 165.57, 152.66, 148.63, 146.39, 143.48, 123.64, 123.01, 121.34, 119.66, 118.56, 117.50, 113.90, 109.89, 56.60, 56.06, 56.04. Elemental anal. calcd for C16H17NO4: C, 66.89; H, 5.96; N, 4.88%. Found: C, 66.77; H, 6.23; N, 5.18%. Selected IR data (KBr, cm−1): 3400(w), 1630(m), 1593(w), 1487(m), 1474(s), 1461(m), 1440(m), 1351(w), 1315(w), 1277(m), 1249(s), 1237(s), 1216(m), 1188(m), 1162(m), 1074(m), 993(m), 979(m), 903(m), 842(w), 830(w), 801(w), 785(w), 738(s), 760(s), 743(s), 734(s), 710(w).
 |
| | Scheme 1 Synthesis of the H2L ligand. | |
Physical measurement
Elemental analyses for C, H, and N were carried out with a Perkin-Elmer 2400 analyser. Fourier transform (FT) IR spectra were recorded with a Bruker VERTEX 70 FTIR spectrophotometer in the range of 600–4000 cm−1. Magnetic susceptibility measurements were performed in the temperature range of 2–300 K, using a Quantum Design MPMS XL-7 SQUID magnetometer. Powder X-ray diffraction (PXRD) was obtained from a Rigaku D/Max-2500 diffractometer at 40 kV and 100 mA with a Cu-target tube and a graphite monochromator. Fluorescence spectra for the samples were recorded on a FLS-920 fluorescence spectrophotometer. The UV-Vis absorption spectra were determined with an Agilent Cary-60 spectra photometer at room temperature. X-ray photoelectron spectroscopy (XPS) experiments were carried out by a ESCALAB 250Xi spectrometer using an Al Kα source at room temperature.
X-ray single-crystal data collection and structure determination
The diffraction data for 1–5 were collected on a Bruker D8-VENTURE (120 K) CCD X-ray diffractometer equipped with a graphite monochromated Mo Kα radiation (λ = 0.71073 Å). The ω–2θ scan technique was applied. The crystal structures of all complexes were solved with the Olex2 solve solution program18 using Intrinsic Phasing and refined by full-matrix least-squares minimization using the ShelXL refinement package.19 All H atoms were placed on appropriate positions in theory and their positions were refined using the riding model. The details of the crystal parameters, data collection and refinements for the complexes are summarized in Table 1. Selected bond lengths and angles with their estimated standard deviations are listed in Table S1.†
Table 1 Crystal data and structure refinements for 1–5
| |
1 |
2 |
3 |
4 |
5 |
| Empirical formula |
C76H86N6O28Gd4 |
C76H86N6O28Tb4 |
C76H86N6O28Dy4 |
C76H86N6O28Ho4 |
C76H86N6O28Er4 |
| Formula weight |
2160.50 |
2167.18 |
2181.50 |
2191.02 |
2200.54 |
| Temperature/K |
120 |
120 |
120 |
120 |
120 |
| Crystal system |
Monoclinic |
Monoclinic |
Monoclinic |
Monoclinic |
Monoclinic |
| Space group |
P21/c |
P21/c |
P21/c |
P21/c |
P21/c |
| a/Å |
13.4900(07) |
13.4681(15) |
13.457(03) |
13.4321(16) |
13.4131(7) |
| b/Å |
11.9674(06) |
11.9193(13) |
11.905(02) |
11.8480(14) |
11.8637(7) |
| c/Å |
24.5060(13) |
24.483(3) |
24.500(06) |
24.450(3) |
24.4580(14) |
| α/° |
90 |
90 |
90 |
90 |
90 |
| β/° |
95.961(2) |
95.984(4) |
96.03 |
96.123(4) |
96.222(2) |
| γ/° |
90 |
90 |
90 |
90 |
90 |
| Volume/Å3 |
3934.9(9) |
3908.9(7) |
3903.1(07) |
3868.9(8) |
3869.1(4) |
| Z |
2 |
2 |
2 |
2 |
2 |
| ρcalc g cm−3 |
1.823 |
1.841 |
1.856 |
1.881 |
1.889 |
| μ/mm−1 |
3.413 |
3.661 |
3.872 |
4.133 |
4.381 |
| F(000) |
2128.0 |
2136.0 |
2144.0 |
2152.0 |
2160.0 |
| Crystal size/mm3 |
02 × 0.04 × 0.04 |
0.4 × 0.05 × 0.05 |
0.40 × 0.05 × 0.05 |
0.40 × 0.05 × 0.05 |
0.25 × 0.24 × 0.23 |
| θ Range |
2.28 to 27.502 |
2.287 to 27.565 |
2.928 to 27.488 |
2.501 to 27.63 |
2.394 to 27.605 |
| Index ranges |
−17 ≤ h ≤ 17, −15 ≤ k ≤ 15, −31 ≤ l ≤ 29 |
−17 ≤ h ≤ 17, −15 ≤ k ≤ 15, −31 ≤ l ≤ 31 |
−17 ≤ h ≤ 17, −15 ≤ k ≤ 15, −26 ≤ l ≤ 31 |
−17 ≤ h ≤ 17, −15 ≤ k ≤ 15, −31 ≤ l ≤ 31 |
−17 ≤ h ≤ 16, −15 ≤ k ≤ 15, −28 ≤ l ≤ 31 |
| Reflections collected |
59![[thin space (1/6-em)]](https://www.rsc.org/images/entities/char_2009.gif) 585 585 |
60![[thin space (1/6-em)]](https://www.rsc.org/images/entities/char_2009.gif) 747 747 |
53![[thin space (1/6-em)]](https://www.rsc.org/images/entities/char_2009.gif) 678 678 |
59![[thin space (1/6-em)]](https://www.rsc.org/images/entities/char_2009.gif) 835 835 |
60![[thin space (1/6-em)]](https://www.rsc.org/images/entities/char_2009.gif) 923 923 |
| Independent reflections |
9047 [R (int) = 0.0954] |
8987 [R (int) = 0.0456] |
8994 [R (int) = 0.0408] |
8938 [R (int) = 0.0803] |
8920 [R (int) = 0.0483] |
| Data/restraints/parameters |
9047/18/533 |
8987/12/533 |
8944/12/533 |
8938/12/533 |
8920/12/533 |
| Goodness-of-fit on F2 |
1.093 |
1.116 |
1.182 |
1.058 |
1.206 |
| Final R indexes [I ≥ 2σ (I)] |
R1 = 0.0428, wR2 = 0.0616 |
R1 = 0.0267, wR2 = 0.0513 |
R1 = 0.0311, wR2 = 0.0531 |
R1 = 0.0313, wR2 = 0.0603 |
R1 = 0.0329, wR2 = 0.0546 |
| Final R indexes [all data] |
R1 = 0.0737, wR2 = 0.0682 |
R1 = 0.0405, wR2 = 0.0575 |
R1 = 0.0383, wR2 = 0.0549 |
R1 = 0.0500, wR2 = 0.0685 |
R1 = 0.0413, wR2 = 0.0563 |
| Largest diff. peak/hole/e Å−3 |
0.81/−0.88 |
0.90/−0.77 |
0.85/−1.08 |
0.85/−1.10 |
0.93/−1.41 |
Synthesis of 1–5
A mixture of Ln(NO3)3·6H2O (Ln = Gd, Tb, Dy, Ho, Er) (0.1 mmol), H2L (0.1 mmol), pivalic acid (0.1 mmol), triethylamine (0.2 mmol) and CH3OH (2.5 mL) was sealed in a pyrex-tube (10 mL). The tube was heated for 24 h at 80 °C. After cooling to room temperature, yellow block crystals suitably for X-ray diffraction analysis were obtained.
[Gd4L4(NO3)2(Piv)2]·2CH3OH (1). Yield of 1 is 47% (0.0254 g) based on Gd. Elemental anal. calcd for C76H86N6O28Gd4: C, 42.25; H, 4.01; N, 3.89%. Found: C, 42.44; H, 3.99; N, 4.12%. Selected IR data (KBr, cm−1): 2955(m), 1621(m), 1548(m), 1468(s), 1420(m), 1403(m), 1323(w), 1296(w), 1271(m), 1245(s), 1228(m), 1166(m), 1062(m), 1028(m), 1013(m), 977(w), 951(w), 914(w), 867(m), 785(m), 735(s), 612(w).
[Tb4L4(NO3)2(Piv)2]·2CH3OH (2). Yield of 2 is 53% (0.0287 g) based on Tb. Elemental anal. calcd for C76H86N6O28Tb4: C, 42.12; H, 4.00; N, 3.88%. Found: C, 41.74; H, 4.04; N, 4.07%. Selected IR data (KBr, cm−1): 2956(m), 1622(m), 1549(m), 1469(s), 1420(m), 1402(m), 1323(w), 1288(w), 1271(m), 1245(s), 1229(m), 1166(m), 1063(m), 1028(m), 1013(m), 978(w), 952(w), 914(w), 868(m), 785(m), 735(s), 612(w).
[Dy4L4(NO3)2(Piv)2]·2CH3OH (3). Yield of 3 is 54% (0.0294 g) based on Dy. Elemental anal. calcd for C76H86N6O28Dy4: C, 41.84; H, 3.97; N, 3.85%. Found: C, 41.84; H, 4.05; N, 3.95%. Selected IR data (KBr, cm−1): 2956(m), 1623(m), 1550(m), 1470(s), 1420(m), 1403(m), 1324(w), 1289(w), 1271(m), 1245(s), 1230(m), 1166(m), 1063(m), 1029(m), 1014(m), 979(w), 953(w), 916(w), 868(m), 785(m), 735(s), 613(w).
[Ho4L4(NO3)2(Piv)2]·2CH3OH (4). Yield of 4 is 53% (0.0290 g) based on Ho. Elemental anal. calcd for C76H86N6O28Ho4: C, 41.66; H, 3.96; N, 3.84%. Found: C, 41.47; H, 4.05; N, 4.00%. Selected IR data (KBr, cm−1): 2956(m), 1623(m), 1551(m), 1471(s), 1421(m), 1403(m), 1325(w), 1290(w), 1272(m), 1245(s), 1231(m), 1166(m), 1063(m), 1030(m), 1014(m), 979(w), 953(w), 916(w), 868(m), 785(m), 736(s), 613(w).
[Er4L4(NO3)2(Piv)2]·2CH3OH (5). Yield of 5 is 51% (0.0280 g) based on Er. Elemental anal. calcd for C76H86N6O28Er4: C, 41.48; H, 3.94; N,3.82%. Found: C, 40.83; H, 4.03; N 3.93%. Selected IR data (KBr, cm−1): 2956(m), 1623(m), 1552(m), 1471(s), 1421(m), 1402(m), 1326(w), 1290(w), 1272(m), 1243(s), 1231(m), 1166(m), 1063(m), 1030(m), 1014(m), 980(w), 953(w), 916(w), 868(m), 785(m), 736(s), 613(w).
Results and discussion
Synthesis of complexes
The tetranuclear complexes 1–5 were synthesized under solvothermal conditions. When a mixture of Ln(NO3)3·6H2O (Ln = Gd, Tb, Dy, Ho, Er), H2L (the synthesis of H2L was shown in Scheme 1), and pivalic acid, in a 1![[thin space (1/6-em)]](https://www.rsc.org/images/entities/char_2009.gif) :
:![[thin space (1/6-em)]](https://www.rsc.org/images/entities/char_2009.gif) 1
1![[thin space (1/6-em)]](https://www.rsc.org/images/entities/char_2009.gif) :
:![[thin space (1/6-em)]](https://www.rsc.org/images/entities/char_2009.gif) 1 molar ratio in MeOH/Et3N was sealed in a Pyrex-tube and heated under solvothermal conditions, yellow block crystals were generated after being heated at 353 K for one day. The experimental powder X-ray diffraction patterns matched well with those simulated from the crystal structures, demonstrating the purity of complexes 1–5.
1 molar ratio in MeOH/Et3N was sealed in a Pyrex-tube and heated under solvothermal conditions, yellow block crystals were generated after being heated at 353 K for one day. The experimental powder X-ray diffraction patterns matched well with those simulated from the crystal structures, demonstrating the purity of complexes 1–5.
Description of crystal structure of 1–5
Single crystal X-ray analyses and powder X-ray diffraction analyses indicated that complexes 1–5 are isostructural. They crystalize in the monoclinic P21/c space group (Table 1, Fig. 1). Thus, complex 3 was chosen as a representative for 1–5 to describe the structure in detail. The molecular structure of 3 contains four Dy(III) ions in a zig-zag topology, four L2− ligands, two deprotonated pivalic acids, two NO3− anions and two CH3OH solvate molecules (Fig. 1). Two L2− ligands coordinate in a μ2: η1, η2, η1, η1 fashion whereas the other two L2− ligands coordinate in a μ3: η1, η2, η1, η2, η1 mode (Scheme 2). The structure of 3 is composed by two asymmetric [Dy2] units which are connected by phenolate bridges from the Schiff base ligands with Dy⋯Dy distances of 3.697(2) Å (Dy1⋯Dy2) and 3.839(2) Å (Dy2⋯Dy2A). Dy1 centre is coordinated by two oxygen atoms (O1 and O3) from one ligand, one nitrogen atom (N1) from the same ligand, two oxygen atoms (O5 and O6) from another ligand set, two oxygen atoms (O11 and O12) from one NO3− ion, and one oxygen atom (O10) from a deprotonated pivalic acid, forming a NO7 coordination environment. Dy2 centre was coordinated by two oxygen atoms (O7 and O9) from one ligand, one nitrogen atom (N2) from the same ligand, four oxygen atoms (O7A, O8A, O1 and O2) from another two ligand sets and one oxygen atom (O9) from deprotonated pivalic acid. It also forms a NO7 coordination environment. The Dy1–O bond lengths are in the range of 2.169(3)–2.534(3) Å and the Dy1–N bond is 2.491(3) Å. The Dy2–O bond lengths are in the range of 2.249(3)–2.635(3) Å and the Dy2–N bond is 2.443(3) Å. They are all comparable to those of reported complexes with [DyNO7] units.2o,20 The exact coordination geometries of the octa-coordinated Ln(III) ions were analysed by SHAPE 2.1 software21 and resulting data were shown in Table S2.† The resulting data from the closer analysis reveal that Ln1(III) ion is in a square antiprism (D4d) configuration while Ln2(III) is in a biaugmented trigonal prism (C2V) configuration with a minimum continuous shape measures (CShM) value.
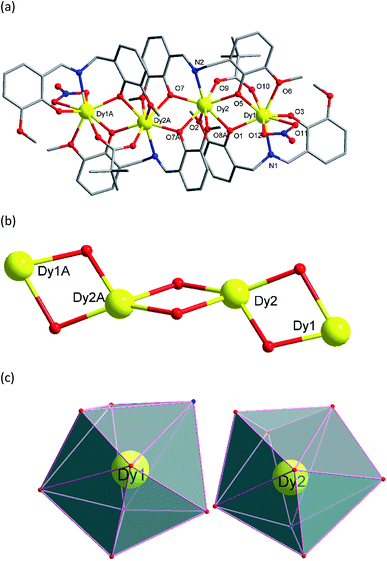 |
| | Fig. 1 (a) Molecular structure of 3. Symmetry code: A = 2 − X, −Y, 1 − Z (hydrogen atoms and solvents have been omitted for clarity). (b) The tetranuclear [Dy4O6] core in 3. (c) Coordination polyhedrons of Dy(III) ions in 3. | |
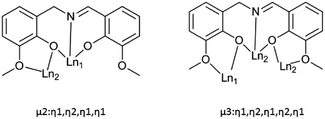 |
| | Scheme 2 The coordination modes of ligand (L2−) in complexes 1–5. | |
Magnetic studies
The magnetic properties of 1–5 were investigated by direct-current (DC) magnetic susceptibility studies under a magnetic field of 1000 Oe in the temperature range 2–300 K. The experimental χMT values at 300 K and magnetic behaviours of 1–5 are shown in Table 2. The χMT versus T plots for 1–5 are shown in Fig. 2. For 1, the room temperature χMT value of 33.41 cm3 K mol−1 is slightly higher than value of 31.52 cm3 K mol−1 expected for four magnetically isolated GdIII ions (8S7/2, g = 2). At 300 K, the χMT values of 46.91 and 58.50 cm3 K mol−1 for complexes 2 and 3 are close to the expected values of 47.20 cm3 K mol−1 for uncoupled TbIII ions (7F6, g = 2) and 56.68 cm3 K mol−1 for uncoupled DyIII ions (8H15/2, g = 4/3). The room temperature χMT values for 4 and 5 are 57.47 and 44.21 cm3 K mol−1, respectively, which are slightly lower than values of 58.28 cm3 K mol−1 expected for four magnetically uncoupled HoIII ions (5I8, g = 5/4) and 45.92 cm3 K mol−1 expected for four magnetically uncoupled ErIII ions (4I15/2, g = 6/5). Upon cooling, the χMT product of 1 stays almost constant in the temperature range of 300–30 K and then decreases rapidly, reaching minimum value of 13.80 cm3 K mol−1 at 2 K. This magnetic behaviour suggests weak antiferromagnetic exchange interactions. The application of a Curie–Weiss law gives values of θ = −1.98 K, C = 32.86 for 1 (Fig. S6†). With the decrease of temperature, the χMT values for 2, 4 and 5 firstly decrease slowly and then decline sharply to minimum values at 2 K. The decrease of χMT values for 2, 4 and 5 is typical for LnIII ions and is due to several factors, namely, the thermal depopulation of the excited mJ sublevels of the 2s+1ΓJ ground state of the LnIII ion originated by a crystal field symmetry, in combination with the weak LnIII–LnIII antiferromagnetic interactions in 2, 4 and 5.22
Table 2 Direct-current (dc) magnetic susceptibilities of 1–5
| Complex |
Metal ions |
Theoretical χMT/cm3 K mol−1 |
Experimental χMT/cm3 K mol−1 at 300 K |
Magnetic behaviour |
| 1 |
Gd |
31.52 |
33.41 |
AF |
| 2 |
Tb |
47.20 |
46.91 |
AF |
| 3 |
Dy |
58.68 |
58.50 |
F |
| 4 |
Ho |
58.28 |
57.47 |
AF |
| 5 |
Er |
45.92 |
44.21 |
AF |
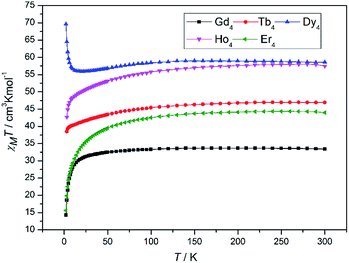 |
| | Fig. 2 Temperature dependence of the χMT products in the range of 2–300 K under 1000 Oe for 1–5. | |
Upon cooling, the χMT value of 3 decreases imperceptibly and reaches minimum value of 55.9 cm3 K mol−1 at 23 K, which is attributed by the thermal depopulation of Stark effect for a single DyIII ion. Continuous being cooled down to 2 K, the χMT product sharply increases to a maximum value of 69.6 cm3 K mol−1. This magnetic phenomenon may be caused by the presence of ferromagnetic interactions between the spin carriers.2g,23
To investigate the dynamic magnetic properties of 3, alternating-current (ac) magnetic susceptibilities were determined under zero-dc field with a 2 Oe oscillating ac field (Fig. 3). The out-of-phase susceptibility (χ′′) displays frequency-dependent phenomenon at low temperatures, which suggests the presence of slow relaxation of the magnetization, typical of SMM behaviour.24 However, the peak maxima are not found. Ac susceptibility measurements of 3 under 0–10![[thin space (1/6-em)]](https://www.rsc.org/images/entities/char_2009.gif) 000 Oe dc field at 1000 Hz were conducted (Fig. S7†). Unfortunately, no optimum field was found. The energy barrier (Ea/KB) and pre-exponential factor (τ0) values were calculated from the frequency-dependent ac susceptibility data by using the Debye model based on the equation ln(χ′′/χ′) = ln(ωτ0) + Ea/KBT.24a The best fitting results give Ea/KB ≈ 1.61 K and τ0 ≈ 7.42 × 10⁻⁶ s (Fig. 4). Apparently, the τ0 value is comparable to the expected values 10−6 to 10−11 for typical SMMs.25
000 Oe dc field at 1000 Hz were conducted (Fig. S7†). Unfortunately, no optimum field was found. The energy barrier (Ea/KB) and pre-exponential factor (τ0) values were calculated from the frequency-dependent ac susceptibility data by using the Debye model based on the equation ln(χ′′/χ′) = ln(ωτ0) + Ea/KBT.24a The best fitting results give Ea/KB ≈ 1.61 K and τ0 ≈ 7.42 × 10⁻⁶ s (Fig. 4). Apparently, the τ0 value is comparable to the expected values 10−6 to 10−11 for typical SMMs.25
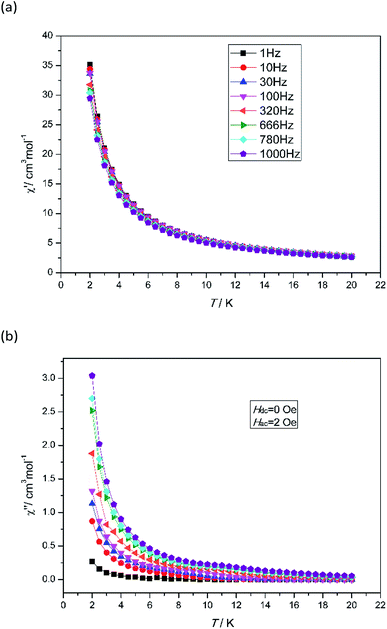 |
| | Fig. 3 Temperature dependence of the in-phase χ′ (a) and out-of-phase χ′′ (b) for 3 under zero dc field at different frequencies in the range of 2–20 K. | |
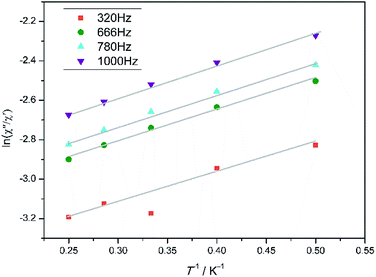 |
| | Fig. 4 Plots of ln (χ′′/χ′) vs. T−1 for 3 in the range 2–4.0 K. The grey solid lines correspond to the best fit result. | |
Luminescent properties
The solid-state luminescent properties of the H2L ligand and 2 were measured at room temperature (Fig. S8†). The H2L ligand displays a broad emission around 544 nm (λex = 467 nm), which is due to the π → π* transition between the ligand orbitals. Complex 1 exhibits a ligand-centred broad band emission at 557 nm and a shoulder at 483 nm (λex = 396 nm), which is attributed to the ligand centred π–π* and charge–transfer transition between ligands and metal centers26 (Fig. S8b†). As shown in Fig. S8,† the solid-state emission spectra of 3–5 (Dy4, Ho4, Er4) display emission bands centred at 482, 482, 480 nm respectively under excitation at 324 nm. The blue shifts of 3–5 are tentatively assigned to the electrostatic interaction between the ligand and metal ions.26b Complex 2 displays four characteristic emission peaks at 490, 544, 584, and 618 nm (λex = 360 nm), corresponding to 5D4 → 7F6, 5D4 → 7F5, 5D4 → 7F4 and 5D4 → 7F3,3b respectively (Fig. S9†). The strongest emission of 2 at 544 nm is responsible for the green emission, which can be observed with the naked eyes. The π-conjugated multidentate organic ligand can act as antennae to sensitize the weak luminescent of Tb(III). Therefore, the strong and sharp luminescence emission of 2 can be visually observed, which allows it to be considered as a fluorescent sensor. The results of the luminescence sensing experiments revealed that complex 2 can be served as a luminescent senior for selectively sensing 4-NA, Fe3+, CrO42− and Cr2O72−.
In order to examine the stability, the PXRD patterns of 2 were measured after being soaked in aqueous solutions with different pH values for several days. The PXRD patterns remained almost unaltered and agreed well with the simulated pattern, revealing the excellent stability of 2 in different solutions (Fig. S10 and S11†). Twenty samples of 2 (2 mg/2 ml suspension) after detection of 4-NA (2 mL, 1 × 10⁻³), Fe3+ (1 mL, 3 × 10⁻³), CrO42− (2 mL, 2 × 10⁻³) and Cr2O72− (2 mL, 2 × 10⁻³) were filtered and dried to recover for PXRD test.
Detection of metal ions
Based on the fact that compound 2 possesses excellent stability in the aqueous solutions with broad pH range, its potential florescent sensing properties towards metal ions were investigated. Firstly, a series of aqueous solutions of 2 were prepared by adding 2 mg of complex 2 into 2 mL of deionized water. Then, the resulting suspensions were sonicated for 8, 10 and 30 minutes, respectively. The sizes of suspensions of particles of 2 were analysed by scanning electron microscopy. The size-distribution histograms were obtained from measuring the diameters of 100 randomly selected particles. According to the histograms of the particle size distributions in Fig. S12,† the average diameters of 2 after being sonicated for 8, 15 and 30 minutes are estimated to be approximately 15.58 ± 3.02, 12.75 ± 2.30 and 7.77 ± 2.62 μm, respectively, of which the sample (2) after being sonicated for 30 minutes displays the smallest particle size. The smaller size of the 2 leading to larger surface areas and more accessible active sites on their surface would be beneficial to realize highly sensitive and fast-response luminescent sensing.27
Therefore, the resulting suspensions were sonicated for 30 minutes. Next, aqueous solutions of nitrate salts (200 μL, 10−2 M) of Na+, K+, Mg2+, Ca2+, Fe2+, Co2+, Ni2+, Cu2+, Zn2+, Cd2+, Pb2+, Al3+, Cr3+ and Fe3+ were added in the above suspensions for fluorescence testing. As shown in Fig. 5, the metal salts slightly altered the luminescent intensity of 2, whereas Fe3+ ion exhibited a significant influence on the luminescence of 2. Concentration-based studies were performed by adding different amount of aqueous solutions of Fe3+ ion into the suspensions of complex 2 (2 mg in 2 mL deionized water). As shown in Fig. 6, the luminescent intensities of 2 progressively decreased as the concentrations of Fe3+ ion increased. The luminescent intensities and the concentrations of Fe3+ ions show good linear relationships at low concentrations. The limit of detection (LOD) value is calculated to be 1 × 10−5 M by 3δ/s, where δ is the standard deviation of fluorescent test for 10 blank measurements and s is the slope of the calibration curve (Fig. S13b†).12i,j In addition, the quenching effect can be explained by the Stern–Volmer equation: I0/I = KSV[Q] + 1, where I0 and I are the luminescent intensities before and after addition of the target analyte, respectively. KSV is the Stern–Volmer quenching constant (M−1) and [Q] is the concentration of the analyte.12p As can be seen from Fig. S13a,† the Stern–Volmer (SV) plot for Fe3+ ion displays nearly linear relationships at low concentration with KSV value of 1.86 × 10⁴ M−1, which is comparable to those of reported fluorescent sensors based on Ln-complexes (Table S3†). The S–V plot deviates from linearity at high concentration (Fig. 6b), which may be attributed to both the occurrence of static and dynamic quenching. Nonlinear S–V curve of 2 can be fitted well by an exponential quenching equation, I0/I = 2.118 exp (4.327[Fe3+]) + 0.199. The possible interference experiments were carried out for complex 2. The selectivity of 2 towards Fe3+ ion over other metal cations was verified by adding Fe3+ ion (10−2 M, 0.2 mL) to the suspensions of 2 (2.4 mL) in which other competitive metal ions (10−2 M, 0.2 mL) were introduced. Then the changes of the emission intensities were recorded. No obvious changes were observed, which suggested that fluorescence detection of 2 could not be interfered by the presence of other cations. Competitive experiments indicated that 2 has great potential as a highly selective sensor for Fe3+ ion (Fig. 7). To study the recycling performance of the fluorescent sensor, Fe3+ ion (10−2 M, 0.2 mL) was introduced to the suspension of complex 2 (2 mL), then washed by water (after Fe3+ ion being detected) with five cycles of sensing experiments. As shown in Fig. 8, the fluorescent intensity of the samples did not drop significantly after five cycles. The resulting KSV, LOD value, high selectivity, stability and recyclable property reveal that complex 2 can be considered as a fluorescent sensor for Fe3+ ion in aqueous system.
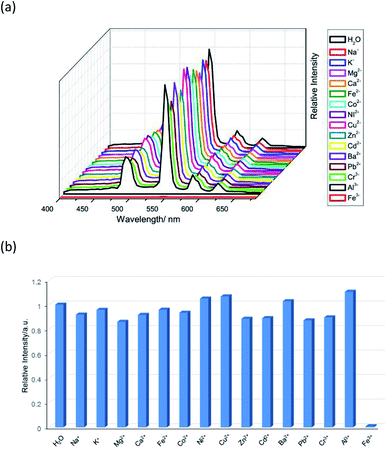 |
| | Fig. 5 (a) The emission spectra and (b) relative intensities at 544 nm (5D4 → 7F5) for 2 which was dispersed in aqueous solutions of different metal ions upon excitation at 360 nm. | |
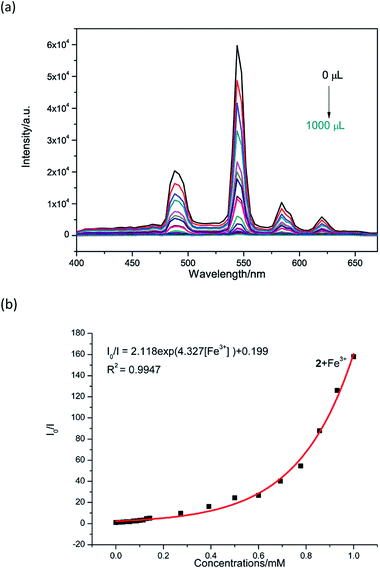 |
| | Fig. 6 (a) Luminescent responses of a water suspension of 2 (2 mg mL−1) towards different concentrations of Fe3+ ions (3 × 10⁻³ M, 0–1000 μL). (b) Nonlinear Stern–Volmer (SV) plot for Fe3+ in the presence of a water suspension of 2 (2 mg/2 mL). | |
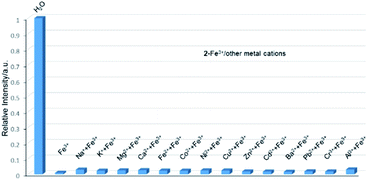 |
| | Fig. 7 Relative luminescent intensities of the suspensions of 2 at 544 nm treated with Fe3+ in the presence of the other metal ions in water. | |
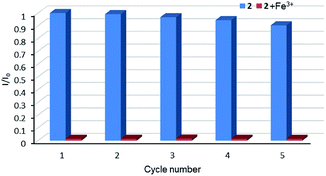 |
| | Fig. 8 Relative luminescent intensity for 5D4 → 7F5 transition of suspension of 2 in the absence and presence of Fe3+ for each cyclic test. | |
As reported, the possible fluorescence quenching mechanism for 2 towards Fe3+ ion mainly rises from three aspects: (a) the collapse of the structure;28 (b) the weak interactions between Fe3+ ion and the methoxy group at the terminal of 2;29 (c) the energy transfer between 2 and Fe3+ ion.30 In order to understand which part was the main contributor, the PXRD, X-ray photoelectron spectroscopy (XPS) and UV-Vis absorption spectra of analytes were determined. By comparing the PXRD pattern (Fig. S15†) of 2 before and after the detection of Fe3+ ion, we found that no obvious changes occurred in this process, which indicated that the structure of 2 did not shatter. Depending on the result of the PXRD patterns, the fluorescence quenching mechanism of structural collapse can be ruled out. As shown in XPS spectrum of 2 (Fig. S14†), after the detection of Fe3+ ion, the O1s peak did not change, demonstrating the nonexistence of the weak interactions between Fe3+ ion and complex 2. However, as shown in Fig. S14,† the absorption band of Fe3+ ion from 250 nm to 400 nm remarkably overlaps the excitation band of 2 from 300 to 400 nm. Consequently, the solution of Fe3+ may absorb the energy of the excitation wavelength, which leads to the luminescence quenching.
Detection of anions
The aqueous solutions (200 μL, 10−2 M) of common sodium salts NayX (X = F−, Cl−, Br−, I−, NO3−, OAc−, SCN−, SO42−, CO32−, Cr2O72−, CrO42−, and PO43− were added in the suspensions of 2 (2 mg complex 2 in 2 mL water, and then being sonicated for 30 minutes) to investigate the luminescence quenching effects. An alluring finding is that CrO42− and Cr2O72− ions showed remarkable turnoff quenching effect on florescent intensities of 2, whereas other tested anions displayed minor effects on the luminescent intensity (Fig. 9). In order to further investigate the sensitivity of 2 toward CrO42− and Cr2O72−, we implemented the titration experiments by adding aqueous solutions of CrO42− or Cr2O72− (2 × 10⁻³ M) to the suspension of complex 2 (2 mg in 2 mL water). The emission titration data were collected. As expected, the fluorescent intensity of 2 gradually decreased with the increase of the concentrations of CrO42− or Cr2O72− (Fig. S16†). Moreover, the S–V curve of 2 (Fig. 10) can be fitted well by an exponential quenching equation, I0/I = 0.897 exp(2.801[CrO42−]) + 0.135 for CrO42− and I0/I = 2.601 exp(2.807[Cr2O72−]) − 1.747 for Cr2O72−. The S–V plot shows good linear relationships at low concentrations (Fig. S17a and S17b†), suggesting that both static and dynamic quenching may happen simultaneously. The quenching constants, KSV, are calculated to be 2.998 × 10³ M−1 (CrO42−) and 7.44 × 10³ M−1 (Cr2O72−) for 2 (Fig. S17a and S17b†). The LOD values calculated according to 3δ/s reach 5.2 × 10⁻⁵ M (CrO42−) and 2.7 × 10⁻⁵ M (Cr2O72−) for 2 (Fig. S17c and S17d†). Competitive experiments were carried out to study the interference of other ions on the fluorescent sensitivity for 2 towards CrO42− or Cr2O72− ions. The fluorescent intensity decreased significantly after adding CrO42− or Cr2O72− (0.2 mL, 10−2 M) into suspensions of 2 (2 mg in 2.2 mL water), in which other anions (0.2 mL, 10−2 M) were also added (Fig. 11). Moreover, recyclability experiments on the detection of CrO42− or Cr2O72− were performed. After five cycles of quenching experiments and regenerations, the quenching efficiency experiences only a minor decrease (Fig. 12). These results showed that complex 2 could be a potential candidate for sensitive and selective detections of CrO42− or Cr2O72− ions. A comparison of florescent sensing properties based on 2, Ln-MOF, and Ln-CP towards Fe3+, CrO42− or Cr2O72− ions is listed in Table S3.†6b,12f–o,13a
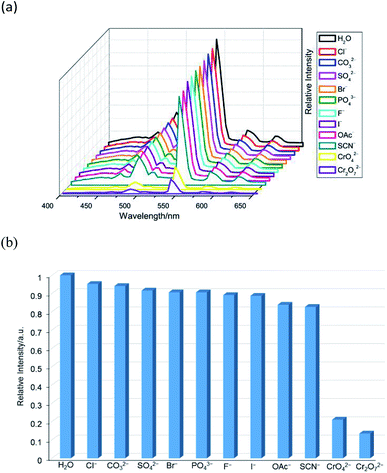 |
| | Fig. 9 (a) The emission spectra and (b) relative intensities at 544 nm (5D4 → 7F5) for 2 dispersed in different anion aqueous solutions upon excitation at 360 nm. | |
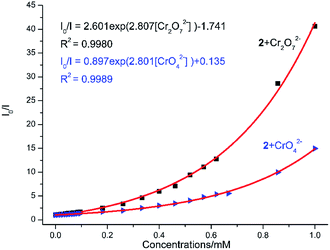 |
| | Fig. 10 Nonlinear Stern–Volmer (SV) plot for CrO42−/Cr2O72− in the presence of a water suspension of 2 (2 mg/2 mL). | |
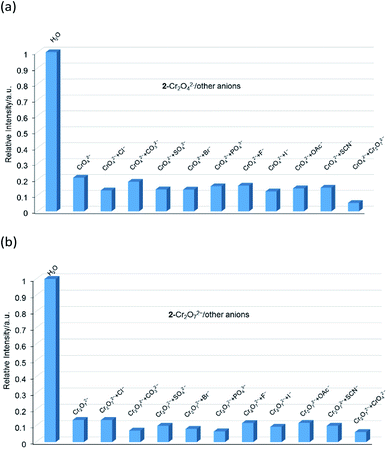 |
| | Fig. 11 (a) Relative luminescent intensities of the suspension of 2 at 544 nm treated with CrO42− in the presence of the other anions in water. (b) Relative luminescent intensities of the suspension of 2 at 544 nm treated with Cr2O72− in the presence of the other anions in water. | |
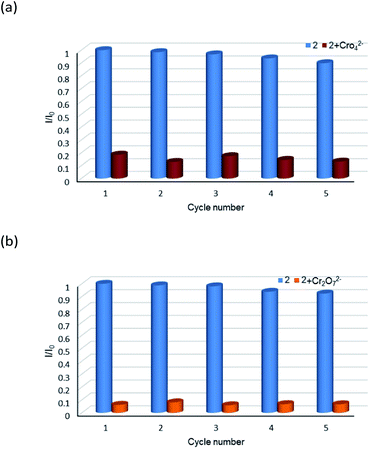 |
| | Fig. 12 Relative luminescence intensity for 5D4 → 7F5 transition of a suspension of 2 in the absence and presence of CrO42− anions (a) and Cr2O72− anions (b) for each cyclic test. | |
After CrO42− and Cr2O72− ions were detected, the PXRD patterns of 2 were measured. The obtained PXRD patterns still well correspond with the original data of 2, which demonstrate that the crystal structure of 2 is retained (Fig. S20†). On the other hand, the UV-Vis spectra of CrO42− and Cr2O72− ions in aqueous solution were determined. As shown in Fig. 13, the absorption bands of CrO42− in the range of 230–450 nm and Cr2O72− in the range of 275–475 nm display extensive overlap with the excitation band of 2. Therefore, luminescence quenching can be attributed to reducing the efficiency of the energy transfer from the ligand to the lanthanide ions, as the energy of the excitation light will be strongly absorbed by CrO42− or Cr2O72−.6b,13e
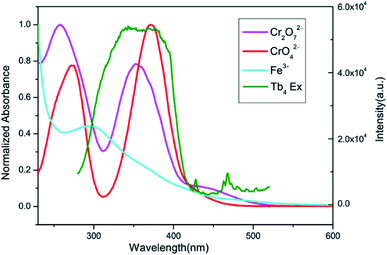 |
| | Fig. 13 Spectral overlap between normalized absorption spectra of solutions of Fe3+, CrO42−, Cr2O72− ions and excitation spectrum of 2 in water. | |
Detection of nitrobenzene derivatives
Complex 2 was dispersed in ethanol and then stirred for three days. It was filtered and dried. The PXRD of 2 (Fig. S20†) after being stirred for three days matched with that of the simulated data, which indicated that complex 2 was stable in ethanol solution. The stable nature of 2 in ethanol solution affords a prerequisite for the detection of nitroaromatics (NACs). Nitrobenzene (NB), 4-nitrophenol (4-NP), 4-nitroaniline (4-NA), 4-nitrotoluene (4-NT), 4-nitrochlorobenzene (4-Cl-NB), 2,4-dinitrotoluene (2,4-DNT) and 2,4-dinitrophenol (2,4-DNP) were selected to explore the potential of 2 as a chemosensor in ethanol solution. Firstly, complex 2 (2 mg) was homogeneously dispersed in a series of ethanol solution (2 mL) and sonicated for 30 minutes to form a uniform suspension. Then, different NACs (10 μL, 10−1 M) was added to the above-mentioned suspensions, respectively. Next, the fluorescent intensities of the resulting mixture were measured. As shown in Fig. 14, the order of quenching extend is as follows: 4-NA > 2,4-DNP > 4-NP > 4-NT > NB > 4-Cl-NB > 2,4-DNT. Concentration-dependent titration experiments of 4-NA were performed to test the influence of concentrations on fluorescent intensity. As the concentration of 4-NA increases, the fluorescent intensity gradually decreased (Fig. S18†). The liner fitting of the S–V plot for 4-NA at low concentrations (Fig. S19a†) gives KSV value of 1.14 × 10⁴ M−1 (4-NA). Nonlinear concentration curve (Fig. 15) can be fitted well by an exponential quenching equation: I0/I = 3.776 exp(5.380[Q]) − 3.131 (Q = 4-NA). The detection limit value (Fig. S19b†) towards 4-NA was calculated by 3δ/s, generating 1.17 ppm (8.5 × 10⁻⁶ M) for 2. Recyclability experiments on the detection of 4-NA were performed. After five cycles of quenching experiments and regenerations, the quenching efficiency experiences only a minor decrease (Fig. 16). To our knowledge, few fluorescent complexes acted as sensors for 4-NA in ethanol system have been reported in the literature (Table S4†).12q–s,13b Compared to luminescent sensors based on transition metal complexes, lanthanide complex 2 has the advantage of characteristic emissions and bright luminescent colour of Tb(III) ion. No lanthanide clusters as sensors for 4-NA have been reported.
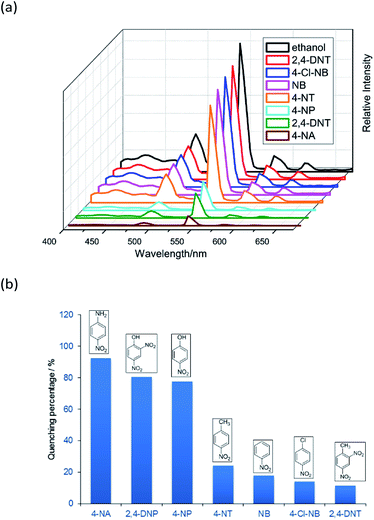 |
| | Fig. 14 (a) The emission spectra and (b) luminescence quenching at 544 nm (5D4 → 7F5) for the suspensions of 2 in the presence of seven different ethanol solutions of NACs (10 μL, 10−1 M) upon excitation at 360 nm. | |
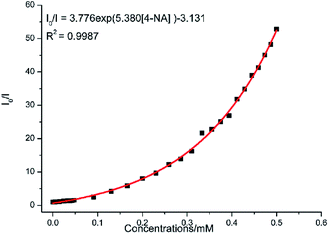 |
| | Fig. 15 Nonlinear Stern–Volmer (SV) plot for 4-NA in the presence of an ethanol suspension of 2 (2 mg/2 mL). | |
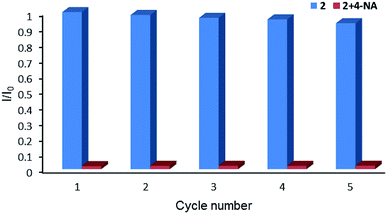 |
| | Fig. 16 Relative luminescence intensity for 5D4 → 7F5 transition of ethanol suspension of 2 in the absence and presence of 4-NA for each cyclic test. | |
As reported, the quenching mechanism of NACs sensors is ascribed to two factors: photo-induced electron transfer (PET) and resonance energy transfer (RET) or their cooperative effect. According to the molecular orbital theory, nitroaromatic compounds are good electron acceptors, due to the substitution of the electron-withdrawing nitro groups on the aromatic ring, which can stabilize the lowest unoccupied molecular orbital (LUMO) of the system via conjugation effect, ultimately leading to the complete or part quenching of luminescence-based sensor.13b,31 The electron transfer originated from the phenyl rings of the ligands of 2 to excellent electron donor nitrobenzene leads to luminescence quenching upon excitation. On the other hand, the UV-Vis results reveal that there are obvious overlaps between the absorption spectrum of NACs especially 4-NA and the emission spectrum of 2 (Fig. 17). This would permit energy transfer from 2 to NACs, thus further improving the luminescence quenching efficiency towards NACs.30b
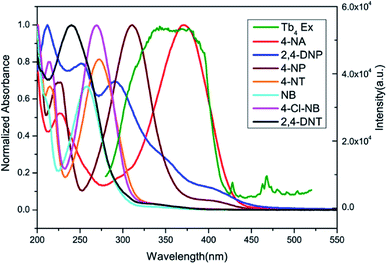 |
| | Fig. 17 Spectral overlap between normalized absorption spectra of seven selected NACs and excitation spectra of 2 in ethanol solution. | |
Conclusions
In summary, five tetranuclear lanthanide clusters have been synthesized by using Ln(NO3)3·6H2O (Ln = Gd, Tb, Dy, Ho, Er), pivalic acid and Schiff base ligand 2-(((2-hydroxy-3-methoxybenzyl)imino)methyl)-6-methoxyphenol (H2L) as starting materials under solvothermal method. Complexes 1–5 possess [Ln4O6] cores formed by the fusion of two phenoxide oxygen bridged two [Ln2O2] moieties. The magnetic properties of 1–5 were investigated. Antiferromagnetic interactions were determined for 1, 2, 4 and 5. Complex 3 displayed typical single molecule magnet behaviour. Considering its low detection limits and high quenching constant Ksv, complex 2 may potentially be utilized as luminescence sensors for quantitative detection of 4-NA, Fe3+ and CrO42−/Cr2O72− ions. Although the design of chemosensors is more based on academic or research interest, the exceptional stability of Tb4 clusters makes it applicable to extreme industrial application.
Conflicts of interest
There are no conflicts to declare.
Acknowledgements
The authors appreciate the financial support from Natural Science Foundation of China (21272167, 21772140), Natural Science Foundation of Jiangsu Province of China (BK20171213), a Project Funded by the Priority Academic Program Development of Jiangsu Higher Education Institution and the project of scientific and technologic infrastructure of Suzhou (SZS201708).
References
-
(a) X. Y. Zheng, Y. H. Jiang, G. L. Zhuang, D. P. Liu, H. G. Liao, X. J. Kong, L. S. Long and L. S. Zheng, J. Am. Chem. Soc., 2017, 139, 18178–18181 CrossRef CAS PubMed;
(b) X.-Y. Zheng, J.-B. Peng, X.-J. Kong, L.-S. Long and L.-S. Zheng, Inorg. Chem. Front., 2016, 3, 320–325 RSC;
(c) Z. Zheng, Chem. Commun., 2001, 2521–2529 RSC.
-
(a) Y. N. Guo, G. F. Xu, W. Wernsdorfer, L. Ungur, Y. Guo, J. Tang, H. J. Zhang, L. F. Chibotaru and A. K. Powell, J. Am. Chem. Soc., 2011, 133, 11948–11951 CrossRef CAS PubMed;
(b) J. Long, F. Habib, P. H. Lin, I. Korobkov, G. Enright, L. Ungur, W. Wernsdorfer, L. F. Chibotaru and M. Murugesu, J. Am. Chem. Soc., 2011, 133, 5319–5328 CrossRef CAS PubMed;
(c) F. Habib, G. Brunet, V. Vieru, I. Korobkov, L. F. Chibotaru and M. Murugesu, J. Am. Chem. Soc., 2013, 135, 13242–13245 CrossRef CAS PubMed;
(d) P. H. Lin, T. J. Burchell, R. Clerac and M. Murugesu, Angew. Chem., Int. Ed., 2008, 47, 8848–8851 CrossRef CAS PubMed;
(e) F. Tuna, C. A. Smith, M. Bodensteiner, L. Ungur, L. F. Chibotaru, E. J. McInnes, R. E. Winpenny, D. Collison and R. A. Layfield, Angew. Chem., Int. Ed., 2012, 51, 6976–6980 CrossRef CAS PubMed;
(f) J. Zhang, H. Zhang, Y. Chen, X. Zhang, Y. Li, W. Liu and Y. Dong, Dalton Trans., 2016, 45, 16463–16470 RSC;
(g) L. Zhang, J. Jung, P. Zhang, M. Guo, L. Zhao, J. Tang and B. Le Guennic, Chem.–Eur. J., 2016, 22, 1392–1398 CrossRef CAS PubMed;
(h) Y. Qin, H. Zhang, H. Sun, Y. Pan, Y. Ge, Y. Li and Y.-Q. Zhang, Chem.–Asian J., 2017, 12, 2834–2844 CrossRef CAS PubMed;
(i) M. Gysler, F. El Hallak, L. Ungur, R. Marx, M. Hakl, P. Neugebauer, Y. Rechkemmer, Y. Lan, I. Sheikin, M. Orlita, C. E. Anson, A. K. Powell, R. Sessoli, L. F. Chibotaru and J. van Slageren, Chem. Sci., 2016, 7, 4347–4354 RSC;
(j) X. L. Li, H. Li, D. M. Chen, C. Wang, J. Wu, J. Tang, W. Shi and P. Cheng, Dalton Trans., 2015, 44, 20316–20320 RSC;
(k) J. Tang, I. Hewitt, N. T. Madhu, G. Chastanet, W. Wernsdorfer, C. E. Anson, C. Benelli, R. Sessoli and A. K. Powell, Angew. Chem., Int. Ed., 2006, 45, 1729–1733 CrossRef CAS PubMed;
(l) P. H. Guo, J. L. Liu, Z. M. Zhang, L. Ungur, L. F. Chibotaru, J. D. Leng, F. S. Guo and M. L. Tong, Inorg. Chem., 2012, 51, 1233–1235 CrossRef CAS PubMed;
(m) H. L. Gao, X. P. Zhou, Y. X. Bi, H. Y. Shen, W. M. Wang, N. N. Wang, Y. X. Chang, R. X. Zhang and J. Z. Cui, Dalton Trans., 2017, 46, 4669–4677 RSC;
(n) P. P. Yang, X. F. Gao, H. B. Song, S. Zhang, X. L. Mei, L. C. Li and D. Z. Liao, Inorg. Chem., 2011, 50, 720–722 CrossRef CAS PubMed;
(o) G. Abbas, Y. Lan, G. E. Kostakis, W. Wernsdorfer, C. E. Anson and A. K. Powell, Inorg. Chem., 2010, 49, 8067–8072 CrossRef CAS PubMed;
(p) A. K. Jami, V. Baskar and E. C. Sanudo, Inorg. Chem., 2013, 52, 2432–2438 CrossRef CAS PubMed;
(q) R. J. Blagg, C. A. Muryn, E. J. McInnes, F. Tuna and R. E. Winpenny, Angew. Chem., Int. Ed., 2011, 50, 6530–6533 CrossRef CAS PubMed;
(r) H. Zhang, R. Liu, J. Zhang, Y. Li, W. Liu and Y. Dong, Chem.–Asian J., 2017, 12, 507–514 CrossRef CAS PubMed;
(s) L. Qin, Y. Z. Yu, P. Q. Liao, W. Xue, Z. Zheng, X. M. Chen and Y. Z. Zheng, Adv. Mater., 2016, 28, 10772–10779 CrossRef CAS PubMed;
(t) S. T. Liddle and J. van Slageren, Chem. Soc. Rev., 2015, 44, 6655–6669 RSC;
(u) P. Zhang, Y.-N. Guo and J. Tang, Coord. Chem. Rev., 2013, 257, 1728–1763 CrossRef CAS.
-
(a) J. Mao, Coord. Chem. Rev., 2007, 251, 1493–1520 CrossRef CAS;
(b) E. C. Mazarakioti, K. M. Poole, L. Cunha-Silva, G. Christou and T. C. Stamatatos, Dalton Trans., 2014, 43, 11456–11460 RSC;
(c) P. Bag, C. K. Rastogi, S. Biswas, S. Sivakumar, V. Mereacre and V. Chandrasekhar, Dalton Trans., 2015, 44, 4328–4340 RSC;
(d) K. Su, F. Jiang, M. Wu, J. Qian, J. Pang, D. Yuan and M. Hong, CrystEngComm, 2016, 18, 4921–4928 RSC.
-
(a) J.-L. Liu, Y.-C. Chen, F.-S. Guo and M.-L. Tong, Coord. Chem. Rev., 2014, 281, 26–49 CrossRef CAS;
(b) F. S. Guo, J. D. Leng, J. L. Liu, Z. S. Meng and M. L. Tong, Inorg. Chem., 2012, 51, 405–413 CrossRef CAS PubMed;
(c) A. Adhikary, J. A. Sheikh, S. Biswas and S. Konar, Dalton Trans., 2014, 43, 9334–9343 RSC;
(d) J. B. Peng, X. J. Kong, Q. C. Zhang, M. Orendac, J. Prokleska, Y. P. Ren, L. S. Long, Z. Zheng and L. S. Zheng, J. Am. Chem. Soc., 2014, 136, 17938–17941 CrossRef CAS PubMed;
(e) K. Wang, Z. L. Chen, H. H. Zou, K. Hu, H. Y. Li, Z. Zhang, W. Y. Sun and F. P. Liang, Chem. Commun., 2016, 52, 8297–8300 RSC.
-
(a) R. Sessoli, D. Gatteschi, A. Caneschi and M. A. Nonvak, Nature, 1993, 365, 141–143 CrossRef CAS;
(b) L. Bogani and W. Wernsdorfer, Nat. mater., 2008, 7, 179–186 CrossRef CAS PubMed.
-
(a) B. V. Harbuzaru, A. Corma, F. Rey, J.
L. Jorda, D. Ananias, L. D. Carlos and J. Rocha, Angew. Chem., Int. Ed., 2009, 48, 6476–6479 CrossRef CAS PubMed;
(b) J. Liu, G. Ji, J. Xiao and Z. Liu, Inorg. Chem., 2017, 56, 4197–4205 CrossRef CAS PubMed;
(c) J. Sahoo, R. Arunachalam, P. S. Subramanian, E. Suresh, A. Valkonen, K. Rissanen and M. Albrecht, Angew. Chem., Int. Ed., 2016, 55, 9625–9629 CrossRef CAS PubMed.
-
(a) X. liu and E. C. Theil, Acc. Chem. Res., 2005, 38, 167–175 CrossRef CAS PubMed;
(b) K. P. Carter, A. M. Young and A. E. Palmer, Chem. Rev., 2014, 114, 4564–4601 CrossRef CAS PubMed;
(c) A. Barba-Bon, A. M. Costero, S. Gil, M. Parra, J. Soto, R. Martinez-Manez and F. Sancenon, Chem. Commun., 2012, 48, 3000–3002 RSC.
-
(a) M. A. Lovellac, J. D. Robertsons, W. J. Teesclaleb, J. L. Campbellb and W. R. Markesberycd, J. Neurol. Sci., 1998, 158, 47–52 CrossRef;
(b) D. L. Jiang, X. J. Li, R. Williams, S. Patel, L. J. Men, Y. S. Wang and F. M. Zhou, Biochemistry, 2009, 48, 7939–7947 CrossRef CAS PubMed.
-
(a) V. K. Gupta, M. Gupta and S. Sharma, Water Res., 2001, 35, 1125–1134 CrossRef CAS PubMed;
(b) C. Ozdemir, S. Dursun, M. E. Argun and S. Dogan, Environ. Technol., 2005, 26, 397–400 CrossRef CAS PubMed;
(c) G. Hilson, Sci. Total Environ., 2006, 362, 1–14 CrossRef CAS PubMed;
(d) M. Bansal, D. Singh and V. K. Garg, J. Hazard. Mater., 2009, 171, 83–92 CrossRef CAS PubMed.
-
(a) C. Cervantes, J. Campos-García, S. Devars, F. Gutiérrez-Corona, H. Loza-Tavera, J. C. Torres-Guzmán and R. Moreno-Sánchez, FEMS Microbiol. Rev., 2001, 25, 335–347 CrossRef CAS PubMed;
(b) A. Zhitkovich, Y. Song, G. Quievryn and V. Voitkun, Biochemistry, 2001, 40, 549–560 CrossRef CAS PubMed;
(c) K. R. Manygoats, M. Yazzie and D. M. Stearns, J. Biol. Inorg Chem., 2002, 7, 791–798 CrossRef CAS PubMed;
(d) A. Shanker, C. Cervantes, H. Loza-Tavera and S. Avudainayagam, Environ. Int., 2005, 31, 739–753 CrossRef CAS PubMed;
(e) K. L. Witt, M. D. Stout, R. A. Herbert, G. S. Travlos, G. E. Kissling, B. J. Collins and M. J. Hooth, Toxicol. Pathol., 2013, 41, 326–342 CrossRef CAS PubMed;
(f) C. M. Thompson, C. R. Kirman, D. M. Proctor, L. C. Haws, M. Suh, S. M. Hays, J. G. Hixon and M. A. Harris, J. Appl. Toxicol., 2014, 34, 525–536 CrossRef CAS PubMed.
-
(a) Y. Salinas, R. Martinez-Manez, M. D. Marcos, F. Sancenon, A. M. Costero, M. Parra and S. Gil, Chem. Soc. Rev., 2012, 41, 1261–1296 RSC;
(b) X. Sun, Y. Wang and Y. Lei, Chem. Soc. Rev., 2015, 44, 8019–8061 RSC;
(c) G. R. Lotufo, J. D. Farrar, L. S. Inouyr, T. S. Bridges and D. B. Ringelberg, Environ. Toxicol. Chem., 2001, 20, 1762–1771 CrossRef CAS PubMed.
-
(a) W. P. Lustig, S. Mukherjee, N. D. Rudd, A. V. Desai, J. Li and S. K. Ghosh, Chem. Soc. Rev., 2017, 46, 3242–3285 RSC;
(b) Y. Cui, B. Chen and G. Qian, Coord. Chem. Rev., 2014, 273–274, 76–86 CrossRef CAS;
(c) L. E. Kreno, K. Leong, O. K. Farha, M. Allendorf, R. P. Van Duyne and J. T. Hupp, Chem. Rev., 2012, 112, 1105–1125 CrossRef CAS PubMed;
(d) B. Gole, A. K. Bar and P. S. Mukherjee, Chem.–Eur. J., 2014, 20, 13321–13336 CrossRef CAS PubMed;
(e) G.-Y. Wang, C. Song, D.-M. Kong, W.-J. Ruan, Z. Chang and Y. Li, J. Mater. Chem. A, 2014, 2, 2213–2220 RSC;
(f) K.-M. Wang, L. Du, Y.-L. Ma, J.-S. Zhao, Q. Wang, T. Yan and Q.-H. Zhao, CrystEngComm, 2016, 18, 2690–2700 RSC;
(g) W. Yan, C. Zhang, S. Chen, L. Han and H. Zheng, ACS Appl. Mater. Interfaces, 2017, 9, 1629–1634 CrossRef CAS PubMed;
(h) R. Li, X.-L. Qu, Y.-H. Zhang, H.-L. Han and X. Li, CrystEngComm, 2016, 18, 5890–5900 RSC;
(i) X. H. Zhou, L. Li, H. H. Li, A. Li, T. Yang and W. Huang, Dalton Trans., 2013, 42, 12403–12409 RSC;
(j) X. L. Zhao, D. Tian, Q. Gao, H. W. Sun, J. Xu and X. H. Bu, Dalton Trans., 2016, 45, 1040–1046 RSC;
(k) M. Chen, W.-M. Xu, J.-Y. Tian, H. Cui, J.-X. Zhang, C.-S. Liu and M. Du, J. Mater. Chem. C, 2017, 5, 2015–2021 RSC;
(l) Z. Sun, M. Yang, Y. Ma and L. Li, Cryst. Growth Des., 2017, 17, 4326–4335 CrossRef CAS;
(m) G. X. Wen, M. L. Han, X. Q. Wu, Y. P. Wu, W. W. Dong, J. Zhao, D. S. Li and L. F. Ma, Dalton Trans., 2016, 45, 15492–15499 RSC;
(n) G. P. Li, G. Liu, Y. Z. Li, L. Hou, Y. Y. Wang and Z. Zhu, Inorg. Chem., 2016, 55, 3952–3959 CrossRef CAS PubMed;
(o) X. H. Huang, L. Shi, S. M. Ying, G. Y. Yan, L. H. Liu, Y. Q. Sun and Y. P. Chen, CrystEngComm, 2018, 20, 189–197 RSC;
(p) W. Liu, X. Huang, C. Xu, C. Chen, L. Yang, W. Dou, W. Chen, H. Yang and W. Liu, Chem.–Eur. J., 2016, 22, 18769–18776 CrossRef CAS PubMed;
(q) X.-Y. Wan, F.-L. Jiang, C.-P. Liu, K. Zhou, L. Chen, Y.-L. Gai, Y. Yang and M.-C. Hong, J. Mater. Chem. A, 2015, 3, 22369–22376 RSC;
(r) F. Wang, C. Wang, Z. Yu, Q. He, X. Li, C. Shang and Y. Zhao, RSC Adv., 2015, 5, 70086–70093 RSC;
(s) F. Wang, Z. Yu, C. Wang, K. Xu, J. Yu, J. Zhang, Y. Fu, X. Li and Y. Zhao, Sens. Actuators, B, 2017, 239, 688–695 CrossRef CAS.
-
(a) W. Gao, F. Liu, B. Y. Zhang, X. M. Zhang, J. P. Liu, E. Q. Gao and Q. Y. Gao, Dalton Trans., 2017, 46, 13878–13887 RSC;
(b) L. Huo, J. Zhang, L. Gao, X. Wang, L. Fan, K. Fang and T. Hu, CrystEngComm, 2017, 19, 5285–5292 RSC;
(c) X. Zhang, X. Luo, N. Zhang, J. Wu and Y.-Q. Huang, Inorg. Chem. Front., 2017, 4, 1888–1894 RSC;
(d) W. J. Gong, R. Yao, H. X. Li, Z. G. Ren, J. G. Zhang and J. P. Lang, Dalton Trans., 2017, 46, 16861–16871 RSC;
(e) Y. Lin, X. Zhang, W. Chen, W. Shi and P. Cheng, Inorg. Chem., 2017, 56, 11768–11778 CrossRef CAS PubMed.
-
(a) N. Shao, J. Jin, G. Wang, Y. Zhang, R. Yang and J. Yuan, Chem. Commun., 2008, 1127–1129 RSC;
(b) L.-L. Wen, X.-G. Hou, G.-G. Shan, W.-L. Song, S.-R. Zhang, H.-Z. Sun and Z.-M. Su, J. Mater. Chem. C, 2017, 5, 10847–10854 RSC;
(c) B. Y. Man, D. S. Chan, H. Yang, S. W. Ang, F. Yang, S. C. Yan, C. M. Ho, P. Wu, C. M. Che, C. H. Leung and D. L. Ma, Chem. Commun., 2010, 46, 8534–8536 RSC;
(d) J. P. Leonard and T. Gunnlaugsson, J. Fluoresc., 2005, 15, 585–595 CrossRef CAS PubMed;
(e) Y. Zhang, Z. Liu, Y. Zhang, Y. Xu, H. Li, C. Wang, A. Lu and S. Sun, Sens. Actuators, B, 2015, 211, 449–455 CrossRef CAS.
- X. Z. Li, L. P. Zhou, L. L. Yan, D. Q. Yuan, C. S. Lin and Q. F. Sun, J. Am. Chem. Soc., 2017, 139, 8237–8244 CrossRef CAS PubMed.
- W. Chen, X. Tang, W. Dou, B. Wang, L. Guo, Z. Ju and W. Liu, Chem.–Eur. J., 2017, 23, 9804–9811 CrossRef CAS PubMed.
- I. Zagol-Ikapitte, V. Amernath, M. Bala, L. J. Roberts II, J. A. Oates and O. Boutaud, Chem. Res. Toxicol., 2010, 23, 240–250 CrossRef CAS PubMed.
-
(a) O. V. Dolomanov, L. J. Bourhis, R. J. Gildea, J. A. K. Howard and H. Puschmann, J. Appl. Crystallogr., 2009, 42, 339–341 CrossRef CAS;
(b) G. M. Sheldrick, Acta Cryst. A, 2008, 64, 112–122 CrossRef CAS PubMed.
- G. M. Sheldrick, Acta Cryst. A, 2015, 71, 3–8 CrossRef PubMed.
-
(a) K. Zhang, D. Liu, V. Vieru, L. Hou, B. Cui, F. S. Guo, L. F. Chibotaru and Y. Y. Wang, Dalton Trans., 2017, 46, 638–642 RSC;
(b) H. M. Dong, H. Y. Li, Y. Q. Zhang, E. C. Yang and X. J. Zhao, Inorg. Chem., 2017, 56, 5611–5622 CrossRef CAS PubMed;
(c) Y.-X. Zhang, M. Li, B.-Y. Liu, Z.-L. Wu, H.-Y. Wei and W.-M. Wang, RSC Adv., 2017, 7, 55523–55535 RSC.
- D. Casanova, M. Llunell, P. Alemany and S. Alvarez, Chem.–Eur. J., 2005, 11, 1479–1494 CrossRef CAS PubMed.
- S. Das, A. Dey, S. Biswas, E. Colacio and V. Chandrasekhar, Inorg. Chem., 2014, 53, 3417–3426 CrossRef CAS PubMed.
- S. Mukherjee, J. Lu, G. Velmurugan, S. Singh, G. Rajaraman, J. Tang and S. K. Ghosh, Inorg. Chem., 2016, 55, 11283–11298 CrossRef CAS PubMed.
-
(a) B. Peng, X. J. Kong, Y. P. Ren, L. S. Long, R. B. Huang and L. S. Zheng, Inorg. Chem., 2012, 51, 2186–2190 CrossRef PubMed;
(b) L. Zhao, S. Xue and J. Tang, Inorg. Chem., 2012, 51, 5994–5996 CrossRef CAS PubMed.
- D. N. Woodruff, R. E. Winpenny and R. A. Layfield, Chem. Rev., 2013, 113, 5110–5148 CrossRef CAS PubMed.
-
(a) L. Shen, L. Yang, Y. Fan, L. Wang and J. Xu, CrystEngComm, 2015, 17, 9363–9369 RSC;
(b) M. D. Allendorf, C. A. Bauer, R. K. Bhaktaa and R. J. T. Houk, Chem. Soc. Rev., 2009, 38, 1330–1352 RSC;
(c) M. Kurmoo, Chem. Soc. Rev., 2009, 38, 1353–1379 RSC;
(d) Y. J. Cui, Y. F. Yue, G. D. Qian and B. L. Chen, Chem. Rev., 2012, 112, 1126–1162 CrossRef CAS PubMed.
-
(a) H. Xu, J. Gao, X. Qian, J. Wang, H. He, Y. Cui, Y. Yang, Z. Wang and G. Qian, J. Mater. Chem. A, 2016, 4, 10900–10905 RSC;
(b) M. Zhao, Y. Wang, Q. Ma, Y. Huang, X. Zhang, J. Ping, Z. Zhang, Q. Lu, Y. Yu and H. Xu, Adv. Mater., 2015, 27, 7372–7378 CrossRef CAS PubMed;
(c) H. He, S. H. Chen, D. Y. Zhang, R. Hao, C. Zhang, E. C. Yang and X. J. Zhao, Dalton Trans., 2017, 46, 13502–13509 RSC.
- S. Dang, E. Ma, Z.-M. Sun and H. Zhang, J. Mater. Chem., 2012, 22, 16920–16926 RSC.
- F. L. Hu, Y. X. Shi, H. H. Chen and J. P. Lang, Dalton Trans., 2015, 44, 18795–18803 RSC.
-
(a) S. Zhang, J. Yang, H. Wu, Y.-Y. Liu and J.-F. Ma, Chem.–Eur. J., 2015, 21, 15806–15819 CrossRef CAS PubMed;
(b) Y.-J. Yang, M.-J. Wang and K.-L. Zhang, J. Mater. Chem. C, 2016, 4, 11404–11418 RSC.
- J. H. Qin, H. R. Wang, M. L. Han, X. H. Chang and L. F. Ma, Dalton Trans., 2017, 46, 15434–15442 RSC.
|
| This journal is © The Royal Society of Chemistry 2018 |
Click here to see how this site uses Cookies. View our privacy policy here.  Open Access Article
 * and
Wei Liu
![[thin space (1/6-em)]](https://www.rsc.org/images/entities/char_2009.gif) 585
585![[thin space (1/6-em)]](https://www.rsc.org/images/entities/char_2009.gif) 747
747![[thin space (1/6-em)]](https://www.rsc.org/images/entities/char_2009.gif) 678
678![[thin space (1/6-em)]](https://www.rsc.org/images/entities/char_2009.gif) 835
835![[thin space (1/6-em)]](https://www.rsc.org/images/entities/char_2009.gif) 923
923![[thin space (1/6-em)]](https://www.rsc.org/images/entities/char_2009.gif) :
:![[thin space (1/6-em)]](https://www.rsc.org/images/entities/char_2009.gif) 1
1![[thin space (1/6-em)]](https://www.rsc.org/images/entities/char_2009.gif) :
:![[thin space (1/6-em)]](https://www.rsc.org/images/entities/char_2009.gif) 1 molar ratio in MeOH/Et3N was sealed in a Pyrex-tube and heated under solvothermal conditions, yellow block crystals were generated after being heated at 353 K for one day. The experimental powder X-ray diffraction patterns matched well with those simulated from the crystal structures, demonstrating the purity of complexes 1–5.
1 molar ratio in MeOH/Et3N was sealed in a Pyrex-tube and heated under solvothermal conditions, yellow block crystals were generated after being heated at 353 K for one day. The experimental powder X-ray diffraction patterns matched well with those simulated from the crystal structures, demonstrating the purity of complexes 1–5.
![[thin space (1/6-em)]](https://www.rsc.org/images/entities/char_2009.gif) 000 Oe dc field at 1000 Hz were conducted (Fig. S7†). Unfortunately, no optimum field was found. The energy barrier (Ea/KB) and pre-exponential factor (τ0) values were calculated from the frequency-dependent ac susceptibility data by using the Debye model based on the equation ln(χ′′/χ′) = ln(ωτ0) + Ea/KBT.24a The best fitting results give Ea/KB ≈ 1.61 K and τ0 ≈ 7.42 × 10⁻⁶ s (Fig. 4). Apparently, the τ0 value is comparable to the expected values 10−6 to 10−11 for typical SMMs.25
000 Oe dc field at 1000 Hz were conducted (Fig. S7†). Unfortunately, no optimum field was found. The energy barrier (Ea/KB) and pre-exponential factor (τ0) values were calculated from the frequency-dependent ac susceptibility data by using the Debye model based on the equation ln(χ′′/χ′) = ln(ωτ0) + Ea/KBT.24a The best fitting results give Ea/KB ≈ 1.61 K and τ0 ≈ 7.42 × 10⁻⁶ s (Fig. 4). Apparently, the τ0 value is comparable to the expected values 10−6 to 10−11 for typical SMMs.25


