 Open Access Article
Creative Commons Attribution 3.0 Unported Licence
Magnetic resonance imaging, gadolinium neutron capture therapy, and tumor cell detection using ultrasmall Gd2O3 nanoparticles coated with polyacrylic acid-rhodamine B as a multifunctional tumor theragnostic agent†
Son Long Ho a,
Hyunsil Chab,
In Taek Ohc,
Ki-Hye Jungd,
Mi Hyun Kimd,
Yong Jin Leed,
Xu Miaoa,
Tirusew Tegafawa,
Mohammad Yaseen Ahmada,
Kwon Seok Chae*c,
Yongmin Chang*b and
Gang Ho Lee
 *a
*a
aDepartment of Chemistry and Department of Nanoscience and Nanotechnology (DNN), College of Natural Sciences, Kyungpook National University (KNU), Taegu 41566, South Korea. E-mail: ghlee@mail.knu.ac.kr
bDepartment of Molecular Medicine and Medical & Biological Engineering and DNN, School of Medicine, KNU and Hospital, Taegu 41566, South Korea. E-mail: ychang@knu.ac.kr
cDepartment of Biology Education and DNN, Teachers' College, KNU, Taegu 41566, South Korea. E-mail: kschae@knu.ac.kr
dDivision of RI-Convergence Research, Korea Institute of Radiological & Medical Science, Seoul 01817, South Korea
First published on 3rd April 2018
Abstract
Monodisperse and ultrasmall gadolinium oxide (Gd2O3) nanoparticle colloids (davg = 1.5 nm) (nanoparticle colloid = nanoparticle coated with hydrophilic ligand) were synthesized and their performance as a multifunctional tumor theragnostic agent was investigated. The aqueous ultrasmall nanoparticle colloidal suspension was stable and non-toxic owing to hydrophilic polyacrylic acid (PAA) coating that was partly conjugated with rhodamine B (Rho) for an additional functionalization (mole ratio of PAA![[thin space (1/6-em)]](https://www.rsc.org/images/entities/char_2009.gif) :
:![[thin space (1/6-em)]](https://www.rsc.org/images/entities/char_2009.gif) Rho = 5
Rho = 5![[thin space (1/6-em)]](https://www.rsc.org/images/entities/char_2009.gif) :
:![[thin space (1/6-em)]](https://www.rsc.org/images/entities/char_2009.gif) 1). First, the ultrasmall nanoparticle colloids performed well as a powerful T1 magnetic resonance imaging (MRI) contrast agent: they exhibited a very high longitudinal water proton relaxivity (r1) of 22.6 s−1 mM−1 (r2/r1 = 1.3, r2 = transverse water proton relaxivity), which was ∼6 times higher than those of commercial Gd-chelates, and high positive contrast enhancements in T1 MR images in a nude mouse after intravenous administration. Second, the ultrasmall nanoparticle colloids were applied to gadolinium neutron capture therapy (GdNCT) in vitro and exhibited a significant U87MG tumor cell death (28.1% net value) after thermal neutron beam irradiation, which was 1.75 times higher than that obtained using commercial Gadovist. Third, the ultrasmall nanoparticle colloids exhibited stronger fluorescent intensities in tumor cells than in normal cells owing to conjugated Rho, proving their pH-sensitive fluorescent tumor cell detection ability. All these results together demonstrate that ultrasmall Gd2O3 nanoparticle colloids are the potential multifunctional tumor theragnostic agent.
1). First, the ultrasmall nanoparticle colloids performed well as a powerful T1 magnetic resonance imaging (MRI) contrast agent: they exhibited a very high longitudinal water proton relaxivity (r1) of 22.6 s−1 mM−1 (r2/r1 = 1.3, r2 = transverse water proton relaxivity), which was ∼6 times higher than those of commercial Gd-chelates, and high positive contrast enhancements in T1 MR images in a nude mouse after intravenous administration. Second, the ultrasmall nanoparticle colloids were applied to gadolinium neutron capture therapy (GdNCT) in vitro and exhibited a significant U87MG tumor cell death (28.1% net value) after thermal neutron beam irradiation, which was 1.75 times higher than that obtained using commercial Gadovist. Third, the ultrasmall nanoparticle colloids exhibited stronger fluorescent intensities in tumor cells than in normal cells owing to conjugated Rho, proving their pH-sensitive fluorescent tumor cell detection ability. All these results together demonstrate that ultrasmall Gd2O3 nanoparticle colloids are the potential multifunctional tumor theragnostic agent.
Introduction
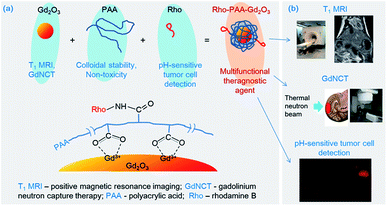
The superior physical properties of Gd (see Abbreviations) applicable to various biomedical applications such as T1 MRI,1,2 CT,3,4 and GdNCT5–7 provide us with the opportunity to synthesize tumor theragnostic agents using one element of Gd in various chemical forms. This condition of Gd simplifies the design and synthesis of tumor theragnostic agents, and minimizes the production cost. The effectiveness of Gd is most significant in the form of ultrasmall Gd2O3 nanoparticle colloids (nanoparticle colloid = nanoparticle coated with hydrophilic ligand) owing to their high Gd-density per nanoparticle colloid. An additional advantage of ultrasmall Gd2O3 nanoparticle colloids over molecular Gd-chelates is their large surface area available for additional functionalization through surface-conjugation. Ultrasmall Gd2O3 nanoparticle colloids also have advantages over conventional large Gd2O3 nanoparticle colloids in biomedical applications owing to their higher number density, higher colloidal stability, higher performance, and renal excretion ability.In this study, we present monodisperse and ultrasmall Gd2O3 nanoparticle colloids as a multifunctional tumor theragnostic agent. The nanoparticle colloid is composed of three components: ultrasmall Gd2O3 nanoparticle, PAA, and Rho (Fig. 1a). First, PAA was used as surface-coating ligand to make the ultrasmall Gd2O3 nanoparticle colloids stable and non-toxic. It is an excellent surface-coating biocompatible polymer with numerous carboxylic groups per polymer,8 with one carboxylic group per monomer unit. An additional functionalization of the nanoparticle colloids can be easily performed by conjugating a functional molecule such as drug, tumor-targeting ligand, or dye (such as Rho in this study) to one of its carboxylic groups. The remaining carboxylic groups can be used for surface coating. The other two components are described below.
The main component, i.e. ultrasmall Gd2O3 nanoparticle has both diagnostic and therapeutic functions as mentioned before, and among them, those applicable to T1 MRI9–11 and GdNCT7,12,13 were investigated in this study. First, an important focus of this study was the application of ultrasmall Gd2O3 nanoparticle colloids to GdNCT in vitro. GdNCT is a new promising binary tumor therapeutic technique utilizing Gd-chemicals and a thermal neutron beam.5,14–17 157Gd (natural abundance = 15.7%) has the highest thermal neutron capture cross-section of 257![[thin space (1/6-em)]](https://www.rsc.org/images/entities/char_2009.gif) 000 barns among stable radionuclides, which is ∼67 times higher than 3840 barns of 10B (natural abundance = 19.7%) currently used for BNCT.5,13,14 However, common elements in the body, such as H, O, C, N, S, Na, Cl, K, Ca, and Fe, have tiny thermal neutron capture cross-section values.5,14 Therefore, GdNCT does no harm to our body unless high thermal neutron beam irradiation doses are used. The tumor therapy by GdNCT occurs by nuclear reaction products. Therefore, for successful GdNCT, Gd-chemicals should reside inside or close to tumor cell nuclei because of the short path lengths (a few μm) of both IC and ACK electrons, the nuclear reaction products of the 157Gd(n,γ)158*Gd nuclear reaction.5,14 These electrons can damage DNA inside tumor cell nuclei, thus killing tumor cells. The Gd-chemicals applied to GdNCT to date include commercial Gd-chelates such as Gd-DTPA and Gd-DOTA,18–21 fullerene-encapsulated Gd,22 GdCo@carbon nanoparticles,23 hybrid Gd2O3@polysiloxane nanoparticles,12 and various nanocomposites containing commercial Gd-chelates such as chitosans,24,25 liposomes,26,27 calcium phosphate polymeric micelles,28,29 and ethyl cellulose microcapsules.30 Nanocomposites accumulated more in tumor cells than did Gd-chelates in vivo25,28,31,32 and in vitro.27,31,33,34 However, these nanocomposites are generally too large (d > 30 nm) for intravenous administration. Therefore, they were usually administrated either intratumorally24,25,32,35 or intraperitoneally.30,31 However, ultrasmall nanoparticle colloids (d < 3 nm) can circulate freely through capillary vessels and be excreted through the renal system after intravenous administration.9,36,37 They may be able to target tumor cells after conjugation with targeting ligands. Therefore, ultrasmall Gd2O3 nanoparticle colloids will be extremely useful for GdNCT applications and thus were applied to GdNCT in vitro in this study to investigate their effectiveness as GdNCT agent before in vivo application. Their performance was compared to that of Gadovist (Gadobutrol, Bayer Schering Pharma, Germany), a commercial molecular T1 MRI contrast agent. Second, ultrasmall Gd2O3 nanoparticle colloids can be applied to T1 MRI. To demonstrate this, water proton relaxivities and in vivo T1 MR images in a nude mouse after intravenous administration of the sample solution were investigated in this study.
000 barns among stable radionuclides, which is ∼67 times higher than 3840 barns of 10B (natural abundance = 19.7%) currently used for BNCT.5,13,14 However, common elements in the body, such as H, O, C, N, S, Na, Cl, K, Ca, and Fe, have tiny thermal neutron capture cross-section values.5,14 Therefore, GdNCT does no harm to our body unless high thermal neutron beam irradiation doses are used. The tumor therapy by GdNCT occurs by nuclear reaction products. Therefore, for successful GdNCT, Gd-chemicals should reside inside or close to tumor cell nuclei because of the short path lengths (a few μm) of both IC and ACK electrons, the nuclear reaction products of the 157Gd(n,γ)158*Gd nuclear reaction.5,14 These electrons can damage DNA inside tumor cell nuclei, thus killing tumor cells. The Gd-chemicals applied to GdNCT to date include commercial Gd-chelates such as Gd-DTPA and Gd-DOTA,18–21 fullerene-encapsulated Gd,22 GdCo@carbon nanoparticles,23 hybrid Gd2O3@polysiloxane nanoparticles,12 and various nanocomposites containing commercial Gd-chelates such as chitosans,24,25 liposomes,26,27 calcium phosphate polymeric micelles,28,29 and ethyl cellulose microcapsules.30 Nanocomposites accumulated more in tumor cells than did Gd-chelates in vivo25,28,31,32 and in vitro.27,31,33,34 However, these nanocomposites are generally too large (d > 30 nm) for intravenous administration. Therefore, they were usually administrated either intratumorally24,25,32,35 or intraperitoneally.30,31 However, ultrasmall nanoparticle colloids (d < 3 nm) can circulate freely through capillary vessels and be excreted through the renal system after intravenous administration.9,36,37 They may be able to target tumor cells after conjugation with targeting ligands. Therefore, ultrasmall Gd2O3 nanoparticle colloids will be extremely useful for GdNCT applications and thus were applied to GdNCT in vitro in this study to investigate their effectiveness as GdNCT agent before in vivo application. Their performance was compared to that of Gadovist (Gadobutrol, Bayer Schering Pharma, Germany), a commercial molecular T1 MRI contrast agent. Second, ultrasmall Gd2O3 nanoparticle colloids can be applied to T1 MRI. To demonstrate this, water proton relaxivities and in vivo T1 MR images in a nude mouse after intravenous administration of the sample solution were investigated in this study.
Lastly, pH-sensitive fluorescent tumor cell detection of ultrasmall Gd2O3 nanoparticle colloids was explored in this study. To this end, Rho was conjugated to surface-coating PAA through amide bond because Rho shows pH-dependent fluorescent intensity in the visible region (λem = 582 nm), which is useful for its use as a pH-sensitive tumor cell detection probe,38–40 as well as for use as an FI agent.40,41 Rho tints red in acidic conditions but has no color in basic conditions, and thus exhibits a stronger fluorescent intensity at more acidic conditions. The origin for this is the spirolactam ring opening reaction in acidic conditions. Therefore, ultrasmall Gd2O3 nanoparticle colloids will show stronger fluorescent intensities in tumor cells than in normal cells because the pH of tumor cells is more acidic than that of normal cells, which is nearly neutral.42 Therefore, combining all the applications mentioned above (Fig. 1b), the ultrasmall Gd2O3 nanoparticle colloid can serve as a multifunctional tumor theragnostic agent as demonstrated in this study.
Experimental
Chemicals
Chemicals such as GdCl3·xH2O (99.9%), PAA (Mw = ∼1800 Da, analytical standard grade), Rho (analytical standard grade), THF (>99.9%), TEG (99%), ethylenediamine (>99%), NaOH (>99.9%), dichloromethane (>99.8%), DCC (>98%), and 4-DMAP (>99%) were purchased from Sigma-Aldrich (St. Louis, MO, USA) and used as-received. Ethanol (>99%, Duksan Chemical, South Korea) was used for initial washing of nanoparticle colloids. Triple distilled water was used for final washing of nanoparticle colloids and in the preparation of aqueous nanoparticle colloidal suspension.Synthesis of Rho-PAA
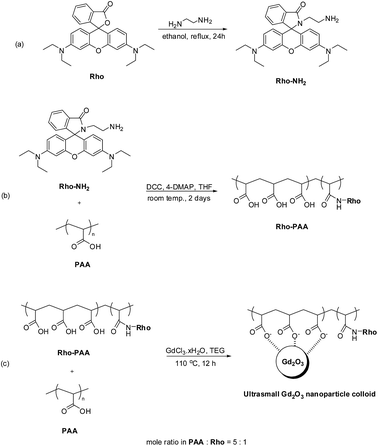
To prepare Rho-PAA, Rho-NH2 was first synthesized according to the known method (Fig. 2a).43,44 Briefly, a mixture of 5 mmol Rho, 20 mL ethanol, and 3 mL ethylenediamine was refluxed overnight until the reaction mixture lost its red color. Ethanol was evaporated and the crude mixture was then washed with triple distilled water, extracted with CH2Cl2, and dried by Na2SO4. The organic phase was concentrated and purified using a silica gel column (DCM![[thin space (1/6-em)]](https://www.rsc.org/images/entities/char_2009.gif) :
:![[thin space (1/6-em)]](https://www.rsc.org/images/entities/char_2009.gif) CH3OH = 95
CH3OH = 95![[thin space (1/6-em)]](https://www.rsc.org/images/entities/char_2009.gif) :
:![[thin space (1/6-em)]](https://www.rsc.org/images/entities/char_2009.gif) 5 as eluent) to obtain Rho-NH2 in a light-yellow solid form (1.86 g, 76.8% yield). Formation of Rho-NH2 was confirmed from its NMR and FT-IR absorption spectra (Fig. S1 and S2,† respectively).
5 as eluent) to obtain Rho-NH2 in a light-yellow solid form (1.86 g, 76.8% yield). Formation of Rho-NH2 was confirmed from its NMR and FT-IR absorption spectra (Fig. S1 and S2,† respectively).
Rho-PAA was synthesized according to the known method45 with a slight modification (Fig. 2b). 0.5 mmol PAA, 0.25 mmol DCC, and a catalytic amount of 4-DMAP were dissolved in 10 mL dry THF. Then 0.1 mmol Rho-NH2 dissolved in dry THF was slowly added to the PAA solution, which was further magnetically stirred at room temperature for 2 days. THF was later removed by evaporation and the crude product was washed with dichloromethane and purified by dialysis (MWCO = 1000 Da) against triple distilled water for 1 day. Formation of Rho-PAA was confirmed from its FT-IR absorption spectrum, and pH-dependent solution and fluorescent solution colors (Fig. S3 and S4,† respectively). The PAA used has ∼twenty-five –COOH groups per polymer. Calculations based on the mole ratio of PAA![[thin space (1/6-em)]](https://www.rsc.org/images/entities/char_2009.gif) :
:![[thin space (1/6-em)]](https://www.rsc.org/images/entities/char_2009.gif) Rho-NH2 = 5
Rho-NH2 = 5![[thin space (1/6-em)]](https://www.rsc.org/images/entities/char_2009.gif) :
:![[thin space (1/6-em)]](https://www.rsc.org/images/entities/char_2009.gif) 1 used in the synthesis, showed that one of five PAA molecules was conjugated to one Rho, and the others were free PAA. Therefore, the final product was a mixture of PAA and Rho-PAA in the mole ratio of 4
1 used in the synthesis, showed that one of five PAA molecules was conjugated to one Rho, and the others were free PAA. Therefore, the final product was a mixture of PAA and Rho-PAA in the mole ratio of 4![[thin space (1/6-em)]](https://www.rsc.org/images/entities/char_2009.gif) :
:![[thin space (1/6-em)]](https://www.rsc.org/images/entities/char_2009.gif) 1. This was confirmed by an FT-IR absorption spectrum of the product that was overwhelmed by PAA peaks (Fig. S3†). The product (PAA + Rho-PAA) was obtained as a solid with a red color owing to Rho-PAA. The pH-dependent solution and fluorescent solution colors were similar to those of free Rho: an aqueous solution of the product tinted red and exhibited strong fluorescence in the red region after irradiation at 365 nm with a mercury lamp, and had no color and no fluorescence at basic pH values like free Rho (Fig. S4†).
1. This was confirmed by an FT-IR absorption spectrum of the product that was overwhelmed by PAA peaks (Fig. S3†). The product (PAA + Rho-PAA) was obtained as a solid with a red color owing to Rho-PAA. The pH-dependent solution and fluorescent solution colors were similar to those of free Rho: an aqueous solution of the product tinted red and exhibited strong fluorescence in the red region after irradiation at 365 nm with a mercury lamp, and had no color and no fluorescence at basic pH values like free Rho (Fig. S4†).
Synthesis of ultrasmall Gd2O3 nanoparticle colloids (coating material = a mixture of PAA and PAA-Rho in the mole ratio of PAA![[thin space (1/6-em)]](https://www.rsc.org/images/entities/h3_char_2009.gif) :
:![[thin space (1/6-em)]](https://www.rsc.org/images/entities/h3_char_2009.gif) PAA-Rho = 4
PAA-Rho = 4![[thin space (1/6-em)]](https://www.rsc.org/images/entities/h3_char_2009.gif) :
:![[thin space (1/6-em)]](https://www.rsc.org/images/entities/h3_char_2009.gif) 1)
1)
In a three-neck round bottom flask, a mixture of half of the above mixture (PAA + Rho-PAA) (∼0.25 mmol) and 2 mmol GdCl3·xH2O were magnetically stirred in 20 mL TEG for 2 h at 60 °C under atmospheric conditions until a clear red precursor solution was obtained (Fig. 2c). In a separate beaker, 10 mmol NaOH in 10 mL TEG was prepared and then added slowly to the precursor solution. Owing to the increment of pH to 9–11 after addition of the NaOH solution, the mixed solution lost its red color. The solution was magnetically stirred at 110 °C for 12 h and then cooled to room temperature. The solution was transferred to a 500 mL beaker and 400 mL ethanol was added. The solution was magnetically stirred at room temperature for 10 minutes and kept in refrigerator for 3 days until the ultrasmall Gd2O3 nanoparticle colloids settled to the bottom of the beaker. The supernatant was decanted and the remaining solution was filled with 400 mL ethanol. This process was repeated 5 times. The product solution was washed 5 times with an adequate amount (<10 mL) of triple distilled water to remove ethanol by evaporation. A portion of the product was dried in air to powder form for various characterizations and the rest of the product was diluted with triple distilled water to prepare a nanoparticle colloidal suspension (∼30 mM Gd).
General characterizations
The particle diameters were measured using an HRTEM (Titan G2 ChemiSTEM CS Probe, FEI, Hillsboro, OR, USA) operated at an accelerating voltage of 200 kV. For measurements, one drop of diluted nanoparticle colloids in triple distilled water was dropped onto a carbon film supported by a 200-mesh copper grid (PELCO no. 160, Ted Pella, Inc., Redding, CA, USA) and placed on a filter paper using a micropipette (2–20 μL, Eppendorf, Hamburg, Germany). The copper grid with the sample was left to air dry for 1 h at room temperature. The copper grid with the sample was then mounted inside the HRTEM for measurement.The crystal structure of the powder samples before and after TGA was measured using a powder XRD spectrometer (X-PERT PRO MRD, Philips, Eindhoven, The Netherlands) with unfiltered CuKα (λ = 1.54184 Å) radiation. The scanning step and scan range in 2θ were 0.033° and 15–100°, respectively.
The surface coating of the nanoparticles with a mixture of PAA and Rho-PAA was investigated by recording FT-IR absorption spectra with an FT-IR absorption spectrometer (Galaxy 7020A, Mattson Instruments, Inc., Madison, WI, USA). For measurements, the powder samples were dried on a hot plate at ∼40 °C for a week to remove moisture. Pellets of dried powder samples were prepared in KBr. FT-IR absorption spectra were recorded in the range of 400–4000 cm−1.
The amount of surface coating on the nanoparticle surface was estimated by recording a TGA curve using a TGA instrument (SDT-Q 600, TA Instruments, New Castle, DE, USA). Because organic compounds burn out below 400 °C, a TGA curve was scanned between room temperature and 900 °C under air flow. The amount of surface coating was estimated from the mass drop in the TGA curve after subtraction of the initial mass drop between room temperature and ∼105 °C owing to water and air desorption.
The Gd concentration of the nanoparticle colloids suspended in triple distilled water was determined using an ICPAES (IRIS/AP, Thermo Jarrell Ash Co., Franklin, MA, USA). The colloidal suspension was pre-treated with acids to completely dissolve the nanoparticle colloids in solution before measurement.
In vitro cytotoxicity measurements
The in vitro cytotoxicity of the nanoparticle colloids was measured using a CellTiter-Glo Luminescent Cell Viability Assay (Promega, Madison, WI, USA). The ATP was quantified using a Victor 3 luminometer (Perkin Elmer, Waltham, MA, USA). Three cell lines, i.e. DU145, NCTC1469, and U87MG, were used. Each cell line was seeded onto a separate 24-well cell culture plate and incubated for 24 h (5 × 10⁴ cell density, 500 μL cells per well, 5% CO2, and 37 °C). Five dilute solutions were prepared by the dilution of the concentrated colloidal suspension with a sterile PBS solution. Each of the test cells was treated with ∼2 μL of each diluted sample solution and the final Gd concentrations in the treated cells were 10, 50, 100, 200, and 500 μM Gd. The treated cells were then incubated for 48 h. Cell viabilities were measured twice to obtain the average cell viabilities, which were then normalized with respect to that of untreated control cells (0.0 mM Gd).Relaxivity and map image measurements
The T1 and T2 relaxation times and the R1 and R2 map images were measured using a 1.5 T MRI scanner (GE 1.5 T Signa Advantage, GE Medical Systems, Chicago, IL, USA) equipped with a knee coil (MSK-Extreme, ONI Medical Systems, Inc., Wilmington, MA, USA). Five aqueous dilute sample solutions (1.0, 0.5, 0.25, 0.125, and 0.0625 mM Gd) were prepared by diluting the concentrated colloidal suspension with triple distilled water. These dilute solutions and triple distilled water were then used to measure both the T1 and T2 relaxation times and the R1 and R2 map images. The r1 and r2 water proton relaxivities of the sample solution were then estimated from the slopes of plots of 1/T1 and 1/T2, respectively, versus the Gd concentration. T1 relaxation time measurements were conducted using an inversion recovery method. In this method, the TI was varied at 1.5 T and the MR images were acquired at 35 different TI values in the range from 50 to 1750 ms. The T1 relaxation times were then obtained from the nonlinear least-square fits to the measured signal intensities at various TI values. For the measurements of T2 relaxation times, the Carr-Purcell–Meiboom-Gill pulse sequence was used for multiple spin-echo measurements. A total of 34 images were acquired at 34 different TE values in the range from 10 to 1900 ms. The T2 relaxation times were obtained from the nonlinear least-square fits to the mean pixel values for the multiple spin-echo measurements at various TE values.Animal experiment
This study was performed in accordance with the Korean guidelines and approved by the animal research committee of Kyungpook National University.In vivo T1 MR image measurements in a nude mouse
In vivo T1 MR images were acquired using the same MRI scanner used for relaxometry measurements. For imaging, an ICR (Institute of Cancer Research, USA) mouse (∼30 g) was anesthetized with 1.5% isoflurane in oxygen. Measurements were made before and after administration of the nanoparticle colloidal suspension into the mouse tail vein. The administration dose was typically ∼0.1 mmol Gd per kg. After measurement, the mouse was revived from anesthesia and placed in a cage with free access to food and water. During measurement, temperature of the mouse was maintained at ∼37 °C using a warm water blanket. The parameters used for the measurements were as follows: external MR field = 1.5 T; temperature = 37 °C; NEX = 4; FOV = 6 mm; phase FOV = 0.5; matrix size = 256 × 192; slice thickness = 1 mm; spacing gap = 0.5 mm (coronal) and 2.0 mm (axial); pixel bandwidth = 15.63 Hz; TR = 500 ms; and TE = 13 ms.In vitro GdNCT experiments
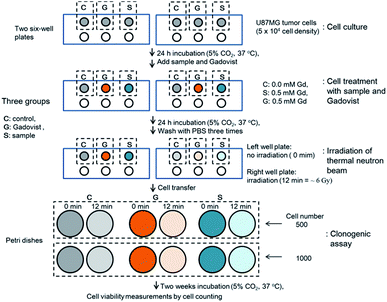
The GdNCT experiments were conducted using the cyclotron (MC50, Scanditronix, Sweden) and irradiation facilities installed at the Korea Institute of Radiological & Medical Science (Fig. S5†). It was operated at 35 MeV and 20 μA with 9Be target (diameter = 17 mm) to generate thermal neutron beam. The GdNCT experimental procedure is provided in Fig. 3. As shown in Fig. 3, the experiments consisted of 4 stages: cell culture, cell treatment with ultrasmall Gd2O3 nanoparticle colloids (i.e. sample) and Gadovist, thermal neutron beam irradiation, and clonogenic assay. Two 6-cell well plates were used for cell culture. The cell wells in each plate were divided into 3 groups (i.e., control, sample, and Gadovist) such that each group occupied 1 cell well in each plate. At the cell culture stage, U87MG tumor cells were seeded on 3 cell wells in each plate and incubated for 24 h (5 × 10⁴ cell density, 5% CO2, and 37 °C). At the cell treatment stage, control cells were untreated (0.0 mM Gd), sample cells were treated with the sample (0.5 mM Gd), and Gadovist cells were treated with Gadovist (0.5 mM Gd). Both treated and untreated (i.e. control) cells were incubated for 24 h and then the treated cells were washed with PBS solution 3 times to remove free nanoparticle colloids and Gadovist. At the irradiation stage, the right cell well plate in Fig. 3 was irradiated with a thermal neutron beam for 12 min, corresponding to a radiation dose of ∼6 Gy, and the left one was not irradiated. At the clonogenic assay stage, 500 and 1000 cells in each cell well in the two 6-cell well plates were transferred to Petri dishes (diameter = 6 mm). These 2 cell numbers were used to verify consistency of cell viabilities. Twelve or 6 sets of cell dishes in total were prepared this way for clonogenic assay (see the bottom in Fig. 3). Here, each set in each group consisted of unirradiated (0 min) and irradiated (12 min) cell dishes for the 2 cell numbers. All 6 sets of cell dishes were incubated for 2 weeks to allow colonial formations. The cell viabilities were analyzed using a clonogenic assay protocol46 and measured by cell counting. All cells spent the same time from the cell culture to clonogenic assay.pH-dependent fluorescent spectral measurements
Fluorescent spectra of the ultrasmall Gd2O3 nanoparticle colloids suspended in triple distilled water at different pH values were recorded using a fluorescent spectrophotometer (Cary Eclipse, Agilent Tech., Santa Clara, CA, USA). The nanoparticle colloidal suspensions (2 mM Gd) at different pH values were prepared by addition of a small amount of 1 M HCl or 1 M NaOH solution to the sample solution while monitoring the pH value of the sample solution with a digital pH-meter equipped with a glass electrode (CyberScan pH 10, Eutech Instrument, Vernon Hills, IL, USA). For measurements, each sample solution was placed in a cuvette (Sigma-Aldrich, 4 mL) with four optically clear sides, which was put in a dark chamber of the spectrometer. A mercury lamp was used at λex = 562 nm.Fluorescent microscopy image measurements in normal and tumor cells: pH-dependent fluorescent tumor cell detection
DU145 tumor and NCTC1469 normal cells were seeded on 24-well culture plate at a density of 1.0 × 10⁴ and 1.5 × 10⁴ per well, respectively, and incubated for 24 h in similar conditions used for cytotoxicity measurements. The cells were treated with an ultrasmall Gd2O3 nanoparticle colloidal solution (2.5 mM Gd, 2 μL), which was prepared by diluting the concentrated colloidal suspension with a sterile PBS solution, and then incubated for 24 h. After washing the treated cells with serum-free media twice, fluorescence microscopy images of the treated and untreated (i.e. control) cells were captured using a fluorescence microscope (IX 51, Olympus, Japan) with a mercury lamp at λex = 562 nm.Results and discussion
Particle diameter and crystal structure of ultrasmall Gd2O3 nanoparticle colloids
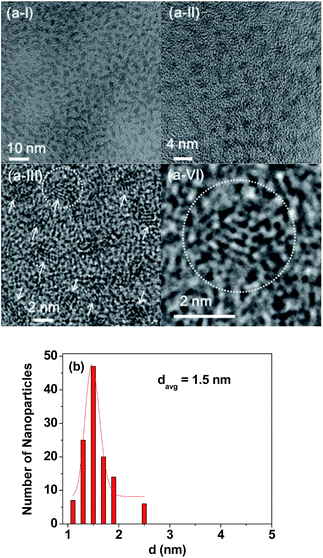
As shown in HRTEM images (Fig. 4a(I–VI)), the monodisperse and ultrasmall particle diameter (d) ranged from 1.0 to 2.5 nm with the davg of 1.5 nm which was estimated from a log-normal function fit to the observed particle diameter distribution (Fig. 4b). XRD patterns before and after TGA showed that the as-prepared powder sample was amorphous owing to ultrasmall particle diameters, but the TGA-treated powder sample showed a cubic structure owing to particle growth,47 with a cell constant of a = 10.82 Å (Fig. S6 and Table S1†), which is consistent with the literature (JCPDS card no. 43-1014).48 In the previous experiment,49 we observed that free Gd3+ ion concentration in solution owing to dissociation of the Gd2O3 nanoparticles coated with ligands was below the detection limit of the ICPAES. Therefore, the dissociation of the Gd2O3 nanoparticle colloids will be negligible in vitro and in vivo.Surface coating results with a mixture of PAA and Rho-PAA
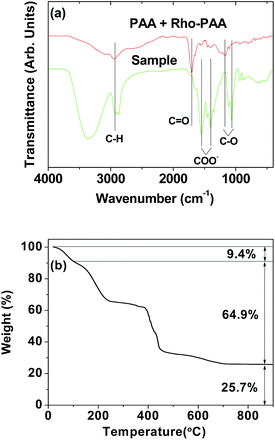
The surface coating of a mixture of PAA and Rho-PAA on the nanoparticle surface was demonstrated by recording FT-IR absorption spectra (Fig. 5a). As shown in Fig. 5a, characteristic symmetric stretches of C–H at 2920 cm−1, COO− at 1400 cm−1, and C–O at 1065 cm−1, and antisymmetric stretch of COO− at 1550 cm−1 were observed in the sample, confirming the successful surface-coating of the nanoparticles with a mixture of PAA and Rho-PAA. Here, the C![[double bond, length as m-dash]](https://www.rsc.org/images/entities/char_e001.gif) O symmetric stretch of PAA and Rho-PAA at 1704 cm−1 was split into symmetric and antisymmetric stretches of COO− in the sample and red-shifted. These are caused by electrostatic bonding between the COO− of PAA and Rho-PAA, and Gd3+ on the nanoparticle surface (see Fig. 1a for the surface coating structure). This type of bonding corresponds to a hard acid of COO− – hard base of Gd3+ type of interaction.50–52 Splitting and red-shift have been observed in many metallic oxide nanoparticles coated with ligands with –COOH groups,53–56 supporting our result.
O symmetric stretch of PAA and Rho-PAA at 1704 cm−1 was split into symmetric and antisymmetric stretches of COO− in the sample and red-shifted. These are caused by electrostatic bonding between the COO− of PAA and Rho-PAA, and Gd3+ on the nanoparticle surface (see Fig. 1a for the surface coating structure). This type of bonding corresponds to a hard acid of COO− – hard base of Gd3+ type of interaction.50–52 Splitting and red-shift have been observed in many metallic oxide nanoparticles coated with ligands with –COOH groups,53–56 supporting our result.
The amount of surface coating with a mixture of PAA and Rho-PAA on the nanoparticle surface was estimated from a TGA curve (Fig. 5b). The initial mass drop of 9.4% between room temperature and ∼105 °C was due to water and air desorption. The mass drop of 64.9% after this was due to burning of PAA and Rho-PAA in air. The remaining mass of 25.7% was due to Gd2O3, as confirmed from its XRD pattern (Fig. S6†). Grafting density,57 corresponding to the average number of ligands coated per nanoparticle unit surface area, was estimated to be ∼1.5 nm−2 using the bulk density of Gd2O3 (7.41 g cm−3),58 the surface-coating amount of 64.9% estimated as above, and the davg of 1.5 nm determined by HRTEM imaging. The average number of ligands coated per nanoparticle was estimated to be ∼10 by multiplying the grafting density by the nanoparticle surface area (πdavg2), indicating that two Rho-PAA and eight PAA coated each nanoparticle on average.
In vitro cytotoxicity results
It is well-known that gadolinium is toxic.59 As shown in Fig. 6a, uncoated Gd2O3 particles (purchased from Sigma-Aldrich, USA) exhibited high toxicities in both NCTC1469 normal and U87MG tumor cell lines. Gadolinium MRI contrast agents can cause nephrogenic systemic fibrosis (NSF) if free Gd3+ ions are deposited in tissues.60 Owing to this, bare Gd2O3 nanoparticles cannot be used for biomedical applications without coating. Therefore, Gd2O3 nanoparticles were coated with hydrophilic and biocompatible PAA and then functionalized with Rho in this study. As shown in Fig. 6b, the ultrasmall Gd2O3 nanoparticle colloids exhibited high cell viabilities such that ∼93% in DU145, ∼99% in NCTC1469, and ∼80% in U87MG cell lines at 500 μM Gd, showing good biocompatibility.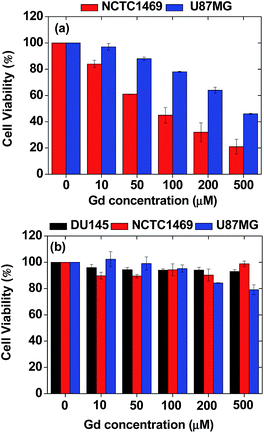 | ||
| Fig. 6 In vitro cytotoxicity results of (a) uncoated Gd2O3 particles in NCTC1469 and U87MG cell lines and (b) ultrasmall Gd2O3 nanoparticle colloids in DU145, NCTC1469, and U87MG cell lines. | ||
Relaxivities and map images
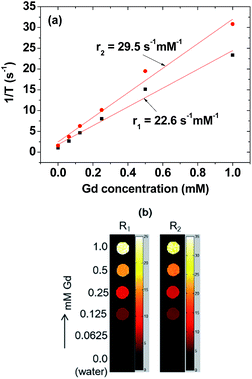
r1 and r2 values were estimated to be 22.6 and 29.5 s−1 mM−1 (r2/r1 = 1.3), respectively, from the 1/T1 and 1/T2 plots versus the Gd concentration (Fig. 7a). The r1 value was ∼6 times higher than those1,2 of commercial Gd-chelates. This higher r1 value and r2/r1 ratio (= 1.3) which is close to 1, suggested that the nanoparticle colloids would be a powerful T1 MRI contrast agent. This was confirmed in vitro from their R1 and R2 map images, clearly showing dose-dependent contrast enhancements with increasing Gd concentration (Fig. 7b). This higher r1 value is owing to ultrasmall particle size and hydrophilic surface-coating with PAA.61In vivo T1 MR images at 1.5 T
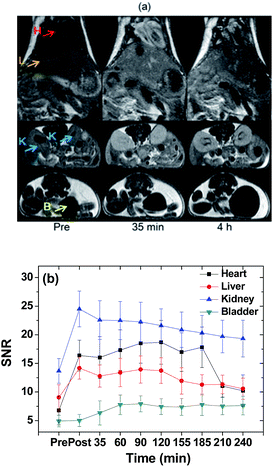
The effectiveness of ultrasmall Gd2O3 nanoparticle colloids as a powerful T1 MRI contrast agent was demonstrated by recording T1 MR images at 1.5 T as a function of time after intravenous administration. Positive contrast enhancements were clearly observed in the liver, heart, kidneys, and bladder of a nude mouse after intravenous administration (Fig. 8a). The SNRs are plotted as a function of time (Fig. 8b). The SNRs in the liver, heart, and kidneys initially increased and then slowly decreased with time while the SNR in the bladder increased with time up to 4 h, indicating a slow renal excretion. Renal excretion is due to the ultrasmall particle size of the nanoparticle colloids, as observed by others.9,38,62 However, a slow renal excretion is likely related to the Rho conjugated to surface-coated PAA. The Rho may bind non-covalently to proteins in blood plasma such as albumin, fibrinogen, and globulins, as observed for other organic dyes such as FITC and fluorescein,63 which consequently slowed down the renal excretion. The mouse did not die after in vivo experiment. From the SNR plots in Fig. 8b and using the half-areas of the plots with baseline corrections after extrapolations to the pre-SNR values, the half-life of the nanoparticle colloids in the heart and liver was estimated to be ∼155 min. Therefore, the half-life of the nanoparticle colloids in the mouse would be ∼155 min.In vitro GdNCT results
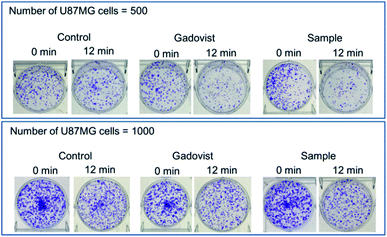
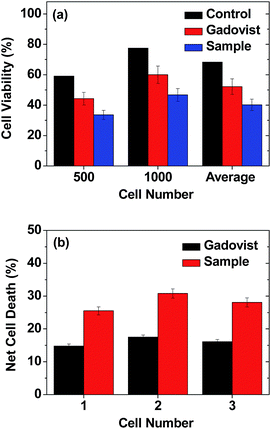
The photos of the 6 sets of cell dishes taken 2 weeks after colonial formation are shown in Fig. 9. The cell viabilities of U87MG cells were estimated by cell counting. The cell viability of irradiated cells (12 min, Fig. 9) in each set was then normalized with respect to that of the corresponding unirradiated cells (0 min, Fig. 9). The results are plotted in histograms (Fig. 10a), showing consistency between cell viabilities of the two cell numbers. Therefore, we took an average of the cell viabilities for the two cell numbers. Cell death in the control was also observed. This was caused by the high dose of irradiation, as observed by others,12,19,21,22,27 which should be avoided because cells should not be damaged by thermal neutron beam itself. By subtracting the control cell death from those of sample and Gadovist, the net cell deaths of sample and Gadovist were estimated and plotted in histograms (Fig. 10b). The sample exhibited an average net cell death of 28.1%, which was 1.75 times higher than that of Gadovist. This suggests a higher cellular uptake of the ultrasmall Gd2O3 nanoparticle colloids than Gadovist, since the GdNCT effect is proportional to Gd-concentration in tumor cells as observed in various nanocomposites.25,27,28,31,32 This higher cellular uptake is critical for in vivo GdNCT experiments, and closely related to surface compositions.64Gd-chemicals that have been applied to or proposed for GdNCT experiments are provided in Table 1. As given in Table 1, however, studies of GdNCT agents are not rich. Furthermore, approximately half of the studies listed in Table 1 only reported Gd concentrations accumulated in tumor cells without GdNCT experiments.31–34,37,65–74 Nevertheless, these previous studies demonstrated the significance and potential of GdNCT in tumor therapy: in vitro GdNCT studies have shown significant tumor cell death as in this study12,19–23,27,28 and in vivo GdNCT studies have shown significant tumor growth suppression.18,21,28–30 The limitations of the previous studies are as follows. Commercial molecular T1 MRI contrast agents were not suitable for in vivo GdNCT applications because they lack the ability to target tumor cells.65 Nanocomposites were generally too large to be intravenously administrated.24,25,30–32,35 Therefore, GdNCT agents which can circulate freely through capillary vessels after intravenous administration and then target tumor cells, are needed. In this respect, ultrasmall Gd2O3 nanoparticle colloid synthesized in this study may be one of candidates suitable for this purpose after conjugation with targeting ligand, which thus will be explored in the future.
| Gd-chemical | Delivery system (particle diameter in nm) | Experimental type [in vitroa or in vivo (injection type inserted)b] | Thermal neutron beam irradiation | Main result | Ref. |
|---|---|---|---|---|---|
| a Tumor cells used for in vitro GdNCT experiments: B16F10 (mouse skin melanoma); C-26 (mouse colon adenocarcinoma); EL4-LUC (mouse lymphoma); F98 (rat brain glioblastoma); KB (human nasopharyngeal epidermal carcinoma); L929 (mouse fibroblast); LN229 (human brain glioblastoma); MFH Nara-H [human sarcoma cell line malignant fibrous histiocytoma]; MRC-5 (human lung fibroblast); SCC-VII (mouse squamous cell carcinoma); SHIN3 (human ovarian cancer); Sk-Mel-28 (human melanoma); SW-1573 (human squamous lung carcinoma); TB10, T98G, and U87MG (three kinds of human GBM); TC-1 (mouse lymphocyte tumor).b Injection type used for in vivo GdNCT experiments: I.V. (intravenous injection into vein); I.T. (intratumoral injection into tumor); I.P. (intraperitoneal injection into tumor inside peritoneum).c NA: not applicable. | |||||
| Polysiloxane-coated Gd2O3 nanoparticle | NAc (3.3) | EL4-LUC cell culture | Yes | Tumor cell death | 12 |
| Na2[Gd(DTPA)] (dipentast) | NA (NA) | Dogs bearing oral cavity melanoma and osteosarcoma tumors (I.T.) | Yes | Comparison between BNCT and GdNCT | 18 |
| Gd-DTPA | NA (NA) | TB10 cell culture | Yes | Tumor cell death | 19 |
| Gd-DTPA | NA (NA) | SW-1573 cell culture | Yes | Tumor cell death | 20 |
| Gadobutrol (Gadovist) | NA (NA) | (i) Sk-Mel-28 cell culture; (ii) mice bearing Sk-Mel-28 tumor (I.T.) | Yes | (i) Tumor cell death; (ii) tumor growth suppression | 21 |
| Gd | C82 fullerene (20–30) | C-26 cell culture | Yes | Tumor cell death | 22 |
| GdCo@carbon nanoparticle | NA (20–50) | HeLa cell culture | Yes | Tumor cell death | 23 |
| Gd-DTPA | Chitosan nanoparticle (391, 214) | Mice bearing B16F10 tumor (I.T.) | Yes | Tumor growth suppression (small chitosan nanoparticle is better than large one) | 24 |
| Gd-DTPA | Chitosan nanoparticle (430) | Mice bearing B16F10 tumor (I.T.) | Yes | Tumor growth suppression better than Gd-DTPA | 25 |
| Gadoteridol (ProHance) | Liposome (100–300) | Mice bearing C-26 tumor (I.V.) | Yes | Tumor growth suppression | 26 |
| Gd-DTPA | Liposome (136–152) | F98 and LN229 cell culture | Yes | Higher tumor cell death than Gd-DTPA | 27 |
| Gd-DTPA | Calcium phosphate polymeric micelle (55) | (i) C-26 cell culture; (ii) mice bearing C-26 tumor (I.V.) | Yes | (i) Tumor cell death; (ii) tumor growth suppression better than Gd-DTPA | 28 |
| Gd-DTPA | Calcium phosphate-based nanoparticle (60) | Mice bearing C-26 tumor (I.V.) | Yes | Tumor growth suppression | 29 |
| Magnevist (gadopentetate dimeglumine) | Ethylcellulose microcapsule (75–106 μm) | Mice bearing Ehrlich ascites tumor (I.P.) | Yes | Tumor growth suppression | 30 |
| Gd(III) | Avidin-G6-(1B4M-Gd)254 (∼7) | (i) SHIN3 cell culture; (ii) mice bearing SHIN3 tumor (I.P.) | No | Higher concentration of avidin-G6-(1B4M-Gd)254 than Gd-DTPA in tumor cell | 31 |
| Gd-DTPA | Chitosan nanoparticle (425) | Mice bearing B16F10 tumor (I.T.) | No | Higher accumulation than Gd-DTPA in tumor | 32 |
| Gd-DTPA | Chitosan nanoparticle (425) | MFH Nara-H cell culture | No | Higher accumulation than Gd-DTPA in tumor cell | 33 |
| Gd-DTPA | Chitosan nanoparticle (426) | L929, B16F10, and SCC-VII cell culture | No | Higher accumulation than Gd-DTPA in all cells | 34 |
| Gd2O3@SiO2@ PMPC | NA (30–200) | Mice bearing B16F10 tumor (I.T.) | No | Gd nanoparticles in tumor for 34 min by MRI | 35 |
| Gd-DTPA, Gd-DOTA | NA (NA) | (i) GBM TB10 and T98G cell culture; (ii) rats bearing C-6 tumor (I.V.) and GBM patients (I.V.) | No | (i) Gd-DTPA and Gd-DOTA found in GBM TB10 and T98G cell nuclei; (ii) Gd-DOTA found in C-6 cell nuclei and Gd-DTPA found in GBM cell nuclei | 65 |
| Gd-DTPA | Chitosan nanoparticle (3.3 μm, 4.1 μm) | — | No | Detection of γ-rays from Gd-DTPA upon thermal neutron irradiation | 66 |
| Gd-acetylacetonate | Chylomicron emulsion (100–200) | Normal nude mice (I.V.) | No | 5 h circulation in blood | 67 |
| Gd-hexanedione | Microemulsion (50–125) | KB cell culture | No | Higher cellular uptake of folate-coated nanoparticles than unfolated nanoparticles | 68 |
| Gd-DTPA | Amphiphile nano assembly (3–200) | SK-MeI-28 tumor and MRC-5 normal cell culture | No | Gd compound found in both normal and tumor cells | 69 |
| Gd-DTPA | Lipid nanoemulsion (73–90) | Hamster bearing Green's melanoma (I.V.) | No | Gd in wet tumor tissue | 70 |
| Gd-DTPA | Liposome (∼100) | Mice bearing TC-1 tumor (I.V.) | No | Gd in tumor tissue | 71 |
| Gd-hexanedione | Microemulsion (85) | (i) KB cell culture; (ii) mice bearing KB tumor (I.V.) | No | Higher cellular uptake of folate-coated nanoparticles than unfolated nanoparticles | 72 |
| GdFeO3/Fe3O4/SiO2 nanoparticle | NA (∼60) | NA | No | NA | 73 |
| Gd-DTPA, Gadomer-17 | PAMAM G-2 (∼3), G-4 (∼6), G-6 (∼9), G-8 (∼12), and DAB G-5 dendrimers | Normal mice (I.P.) | No | G-6 showed the highest Gd in sentinel lymph node among the seven chemicals used | 74 |
| Ultrasmall Gd2O3 nanoparticle colloid | NA (1.5) | U87MG cell culture | Yes | Net cell death = 28.1% which is 1.75 times better than Gadovist | This study |
pH-sensitive fluorescent tumor cell detection
As expected, the aqueous ultrasmall nanoparticle colloidal suspension exhibited stronger fluorescent intensities at more acidic pH values (λem = 582 nm, λex = 562 nm) (Fig. 11) and pH-dependent solution colors (Fig. S7†), similar to free Rho. This pH-dependent fluorescent property of the ultrasmall Gd2O3 nanoparticle colloids was applied to tumor cell detection.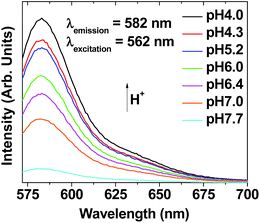 | ||
| Fig. 11 Plots of pH-dependent fluorescent spectra of aqueous ultrasmall Gd2O3 nanoparticle colloidal suspensions (2 mM Gd) (pH = 4.0–7.7) (λex = 562 nm). | ||
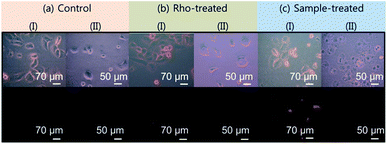
Optical and fluorescent microscopy images of both DU145 tumor and NCTC1469 normal cells were taken before and after treatments with Rho and the ultrasmall Gd2O3 nanoparticle colloids. Before treatment (=control), no fluorescence was observed in both DU145 tumor and NCTC1469 normal cells (Fig. 12a). For Rho-treated cells, a brighter fluorescence was observed in DU145 tumor cells than that in NCTC1469 normal cells, as expected because the pH of tumor cells is more acidic than that of normal cells which is nearly neutral42 (λex = 562 nm) (Fig. 12b). This proves that Rho can serve as a pH sensitive tumor cell detection probe, as consistent with previous reports.38–40 For nanoparticle colloid treated cells, a stronger fluorescence was also observed in DU145 tumor cells than that in NCTC1469 normal cells owing to the conjugated Rho in the nanoparticle colloids (Fig. 12c). This result proves the pH-sensitive tumor cell detection ability of the ultrasmall nanoparticle colloids.
Conclusions
Excellent performance of ultrasmall Gd2O3 nanoparticle colloids (davg = 1.5 nm) in T1 MRI, in vitro GdNCT, and pH-sensitive tumor cell detection was demonstrated. The results, as summarized below, indicate that the ultrasmall Gd2O3 nanoparticle colloids are the potential candidate for use as a multifunctional tumor theragnostic agent.(1) Hydrophilic and biocompatible PAA was used as a surface-coating ligand that was partly conjugated with Rho through amide bond for pH-sensitive tumor cell detection (mole ratio of PAA![[thin space (1/6-em)]](https://www.rsc.org/images/entities/char_2009.gif) :
:![[thin space (1/6-em)]](https://www.rsc.org/images/entities/char_2009.gif) Rho = 5
Rho = 5![[thin space (1/6-em)]](https://www.rsc.org/images/entities/char_2009.gif) :
:![[thin space (1/6-em)]](https://www.rsc.org/images/entities/char_2009.gif) 1).
1).
(2) Ultrasmall Gd2O3 nanoparticle colloids suspended in triple distilled water exhibited a very high r1 value of 22.6 s−1 mM−1 (r2/r1 = 1.3). As a result, highly positive contrast enhancements were observed in T1 MR images in a nude mouse after intravenous administration, proving their potential as a powerful T1 MRI contrast agent.
(3) Ultrasmall Gd2O3 nanoparticle colloids were applied to GdNCT in vitro. They showed significant U87MG tumor cell death after thermal neutron beam irradiation (0.5 mM Gd, ∼6 Gy). The net tumor cell death (corrected by tumor cell death by thermal neutron beam only) was estimated to be 28.1%, which was 1.75 times higher than that obtained using commercial Gadovist.
(4) Ultrasmall Gd2O3 nanoparticle colloids showed stronger fluorescent intensities in DU145 tumor cells than in NCTC1469 normal cells owing to conjugated Rho, proving their pH-sensitive fluorescent tumor cell detection ability.
Author contributions
SLH synthesized and characterized the ultrasmall Gd2O3 nanoparticle colloids, XM, TT and AMY contributed to experiments, HC and YC took and analyzed MRI data, ITO and KSC measured and analyzed cytotoxicity and fluorescent microscopy image data, KHJ, MHK and YJL performed GdNCT experiments, and GHL wrote the manuscript.Conflicts of interest
There are no conflicts to declare.Abbreviations
| ACK | Auger–Coster–Kronig |
| ATP | Intracellular adenosine triphosphate |
| 1B4M | 2-(p-Isothiocyanatobenzyl)-6-methyl-diethylenetriaminepentaacetic acid |
| BNCT | Boron neutron capture therapy |
| C | Carbon |
| Ca | Calcium |
| Cl | Chlorine |
| CT | X-ray computed tomography |
| Da | Dalton |
| DAB | Polypropylenimine dendrimer |
| davg | Average particle diameter |
| DCC | N,N′-Dicyclohexylcarbodiimide |
| 4-DMAP | 4-(Dimethylamino)pyridine |
| DOTA | 1,4,7,10-Tetraazacyclododecane-1,4,7,10-tetraacetic acid |
| DTPA | Diethylenetriaminepentaacetic acid |
| DU145 | Human prostate cancer |
| Fe | Iron |
| FI | Fluorescent imaging |
| FITC | Fluorescein-isothiocyanate |
| FOV | Field of view |
| FT-IR | Fourier transform-infrared |
| G6 | Generation-6 polyamidoamine dendrimer |
| GBM | Glioblastoma multiforme |
| Gd | Gadolinium |
| GdNCT | Gadolinium neutron capture therapy |
| Gd2O3 | Gadolinium oxide |
| H | Gydrogen |
| HRTEM | High-resolution transmission electron microscope |
| IC | Internal conversion |
| ICPAES | Inductively coupled plasma atomic emission spectrometer |
| ICR | Institute for Cancer Research |
| K | Potassium |
| λem | Emission wavelength |
| λex | Excitation wavelength |
| Mw | Molecular weight |
| MWCO | Molecular weight cut off |
| MR | Magnetic resonance |
| N | Nitrogen |
| Na | Sodium |
| NCTC1469 | Normal mouse hepatocyte |
| NEX | Number of acquisition |
| NMR | Nuclear magnetic resonance |
| O | Oxygen |
| PAA | Polyacrylic acid |
| PAMAM | Polyamidoamine |
| PBS | Phosphate-buffered saline |
| PMPC | Poly(2-methacryloyloxyethyl phosphorylcholine) |
| R1 | Longitudinal relaxation map |
| r1 | Longitudinal water proton relaxivity |
| R2 | Transverse relaxation map |
| r2 | Transverse water proton relaxivity |
| Rho | Rhodamine B |
| S | Sulfur |
| SNR | Signal to noise ratio |
| T | Tesla |
| T1 | Longitudinal relaxation time |
| T2 | Transverse relaxation time |
| TE | Echo time |
| TEG | Triethylene glycol |
| TGA | Thermogravimetric analysis |
| THF | Tetrahydrofuran |
| TI | Tnversion time |
| T1 MRI | Positive magnetic resonance imaging |
| TR | Repetition time |
| U87MG | Human malignant glioblastoma tumor cell line |
| XRD | X-ray diffraction |
Acknowledgements
This study was supported by the Basic Science Research Program (Grant no. 2017R1A2B3003214 to YC and 2016R1D1A3B01007622 to GHL) and the Basic Research Laboratory (BRL) Program (Grant no. 2013R1A4A1069507) of the National Research Foundation funded by the Ministry of Education, Science, and Technology, South Korea. The authors wish to thank the Korea Basic Science Institute for allowing us to use their XRD diffractometer.Notes and references
- P. Caravan, J. J. Ellison, T. J. McMurry and R. B. Lauffer, Chem. Rev., 1999, 99, 2293–2352 CrossRef CAS PubMed.
- R. B. Lauffer, Chem. Rev., 1987, 87, 901–927 CrossRef CAS.
- S.-B. Yu and A. D. Watson, Chem. Rev., 1999, 99, 2353–2377 CrossRef CAS PubMed.
- J. H. Hubbell and S. M. Seltzer, Tables of X-ray mass attenuation coefficients and mass energy-absorption coefficients from 1 keV to 20 MeV for elements Z = 1 to 92 and 48 additional substances of dosimetric interest, The National Institute of Standards and Technology (NIST) Standard Reference Database 126, Table 3, 2004available at http://www.nist.gov/pml/data/xraycoef/ Search PubMed.
- N. S. Hosmane, J. A. Maguire, Y. Zhu and M. Takagaki, Boron and Gadolinium Neutron Capture Therapy for Cancer Treatment, World Scientific, Singapore, 2012 Search PubMed.
- G. Leinweber, D. P. Barry, M. J. Trbovich, J. A. Burke, N. J. Drindak, H. D. Knox, R. V. Ballad, R. C. Block, Y. Danon and L. I. Severnyak, Nucl. Sci. Eng., 2006, 154, 261–279 CrossRef CAS.
- A. Deagostino, N. Protti, D. Alberti, P. Boggio, S. Bortolussi, S. Altieri and S. G. Crich, Future Med. Chem., 2016, 8, 899–917 CrossRef CAS PubMed.
- E. S. Yim, B. Zhao, D. Myung, L. C. Kourtis, C. W. Frank, D. Carter, R. L. Smith and S. B. Goodman, J. Biomed. Mater. Res., Part A, 2009, 91, 894–902 CrossRef PubMed.
- J.-L. Bridot, A.-C. Faure, S. Laurent, C. Rivière, C. Billotey, B. Hiba, M. Janier, V. Josserand, J.-L. Coll, L. V. Elst, R. Muller, S. Roux, P. Perriat and O. Tillement, J. Am. Chem. Soc., 2007, 129, 5076–5084 CrossRef CAS PubMed.
- J. Y. Park, M. J. Baek, E. S. Choi, S. Woo, J. H. Kim, T. J. Kim, J. C. Jung, K. S. Chae, Y. Chang and G. H. Lee, ACS Nano, 2009, 3, 3663–3669 CrossRef CAS PubMed.
- T. J. Kim, K. S. Chae, Y. Chang and G. H. Lee, Curr. Top. Med. Chem., 2013, 13, 422–433 CrossRef CAS PubMed.
- J.-L. Bridot, D. Dayde, C. Rivière, C. Mandon, C. Billotey, S. Lerondel, R. Sabattier, G. Cartron, A. L. Le Pape, G. Blondiaux, M. Janier, P. Perriat, S. Roux and O. Tillement, J. Mater. Chem., 2009, 19, 2328–2335 RSC.
- Y. Chang, K. S. Chae and G. H. Lee, Bioinspired, Biomimetic Nanobiomater., 2016, 5, 167–170 CrossRef.
- C. Salt, A. J. Lennox, M. Takagaki, J. A. Maguire and N. S. Hosmane, Russ. Chem. Bull., 2004, 53, 1871–1888 CrossRef CAS.
- S. A. Enger, V. Giusti, M.-A. Fortin, H. Lundqvist and P. M. Rosenschöld, Radiat. Meas., 2013, 59, 233–240 CrossRef CAS.
- J. T. Masiakowski, J. L. Horton and L. J. Peters, Med. Phys., 1992, 19, 1277–1284 CrossRef CAS PubMed.
- D. P. Gierga, J. C. Yanch and R. E. Shefer, Med. Phys., 2000, 27, 1685–1692 CrossRef CAS PubMed.
- V. N. Mitin, V. N. Kulakov, V. F. Khokhlov, I. N. Sheino, A. M. Arnopolskaya, N. G. Kozlovskaya, K. N. Zaitsev and A. A. Portnov, Appl. Radiat. Isot., 2009, 67, S299–S301 CrossRef CAS PubMed.
- G. De Stasio, P. Casalbore, R. Pallini, B. Gilbert, F. Sanità, M. T. Ciotti, G. Rosi, A. Festinesi, L. M. Larocca, A. Rinelli, D. Perret, D. W. Mogk, P. Perfetti, M. P. Mehta and D. Mercanti, Cancer Res., 2001, 61, 4272–4277 CAS.
- N. A. P. Franken, J. W. J. Bergs, T. T. Kok, R. R. N. Kuperus, F. Stecher-Rasmussen, J. Haveman, C. Van Bree and L. J. A. Stalpers, Oncol. Rep., 2006, 15, 715–720 CAS.
- B. Hofmann, C.-O. Fischer, R. Lawaczeck, J. Platzek and W. Semmler, Invest. Radiol., 1999, 34, 126–133 CrossRef CAS PubMed.
- Y. Horiguchi, S. Kudo and Y. Nagasaki, Sci. Technol. Adv. Mater., 2011, 12, 044607 CrossRef PubMed.
- K. C. Hwang, P. D. Lai, C.-S. Chiang, P.-J. Wang and C.-J. Yuan, Biomaterials, 2010, 31, 8419–8425 CrossRef CAS PubMed.
- H. Ichikawa, T. Uneme, T. Andoh, Y. Arita, T. Fujimoto, M. Suzuki, Y. Sakurai, H. Shinto, T. Fukasawa, F. Fujii and Y. Fukumori, Appl. Radiat. Isot., 2014, 88, 109–113 CrossRef CAS PubMed.
- H. Tokumitsu, J. Hiratsuka, Y. Sakurai, T. Kobayashi, H. Ichikawa and Y. Fukumori, Cancer Lett., 2000, 150, 177–182 CrossRef CAS PubMed.
- N. Dewi, H. Yanagie, H. Zhu, K. Demachi, A. Shinohara, K. Yokoyama, M. Sekino, Y. Sakurai, Y. Morishita, N. Iyomoto, T. Nagasaki, Y. Horiguchi, Y. Nagasaki, J. Nakajima, M. Ono, K. Kakimi and H. Takahashi, Biomed. Pharmacother., 2013, 67, 451–457 CrossRef CAS PubMed.
- T. Peters, C. Grunewald, M. Blaickner, M. Ziegner, C. Schütz, D. Iffland, G. Hampel, T. Nawroth and P. Langguth, Radiat. Oncol., 2015, 10, 52–65 CrossRef PubMed.
- P. Mi, N. Dewi, H. Yanagie, D. Kokuryo, M. Suzuki, Y. Sakurai, Y. Li, I. Aoki, K. Ono, H. Takahashi, H. Cabral, N. Nishiyama and K. Kataoka, ACS Nano, 2015, 9, 5913–5921 CrossRef CAS PubMed.
- N. Dewi, P. Mi, H. Yanagie, Y. Sakurai, Y. Morishita, M. Yanagawa, T. Nakagawa, A. Shinohara, T. Matsukawa, K. Yokoyama, H. Cabral, M. Suzuki, Y. Sakurai, H. Tanaka, K. Ono, N. Nishiyama, K. Kataoka and H. Takahashi, J. Cancer Res. Clin. Oncol., 2016, 142, 767–775 CrossRef CAS PubMed.
- Y. Akine, N. Tokita, K. Tokuuye, M. Satoh, Y. Fukumori, H. Tokumitsu, R. Kanamori, T. Kobayashi and K. Kanda, J. Cancer Res. Clin. Oncol., 1992, 119, 71–73 CrossRef CAS PubMed.
- H. Kobayashi, S. Kawamoto, T. Saga, N. Sato, T. Ishimori, J. Konishi, K. Ono, K. Togashi and M. W. Brechbiel, Bioconjugate Chem., 2001, 12, 587–593 CrossRef CAS PubMed.
- H. Tokumitsu, H. Ichikawa and Y. Fukumori, Pharm. Res., 1999, 16, 1830–1835 CrossRef CAS.
- T. Fujimoto, H. Ichikawa, T. Akisue, I. Fujita, K. Kishimoto, H. Hara, M. Imabori, H. Kawamitsu, P. Sharma, S. C. Brown, B. M. Moudgil, M. Fujii, T. Yamamoto, M. Kurosaka and Y. Fukumori, Appl. Radiat. Isot., 2009, 67, S355–S358 CrossRef CAS PubMed.
- F. Shikata, H. Tokumitsu, H. Ichikawa and Y. Fukumori, Eur. J. Pharm. Biopharm., 2002, 53, 57–63 CrossRef CAS PubMed.
- H. K. Cho, H.-J. Cho, S. Lone, D.-D. Kim, J. H. Yeum and I. W. Cheong, J. Mater. Chem., 2011, 21, 15486–15493 RSC.
- H. S. Choi, W. Liu, P. Misra, E. Tanaka, J. P. Zimmer, B. I. Ipe, M. G. Bawendi and J. V. Frangioni, Nat. Biotechnol., 2007, 25, 1165–1170 CrossRef CAS PubMed.
- M. Longmire, P. L. Choyke and H. Kobayashi, Nanomedicine, 2008, 3, 703–717 CrossRef CAS PubMed.
- S.-L. Shen, X.-P. Chen, X.-F. Zhang, J.-Y. Miao and B.-X. Zhao, J. Mater. Chem. B, 2015, 3, 919–925 RSC.
- Q. Wang, L. Zhou, L. Qiu, D. Lu, Y. Wu and X.-B. Zhang, Analyst, 2015, 140, 5563–5569 RSC.
- C. Rivas, G. J. Stasiuk, J. Gallo, F. Minuzzi, G. A. Rutter and N. J. Long, Inorg. Chem., 2013, 52, 14284–14293 CrossRef CAS PubMed.
- K. Vuu, J. Xie, M. A. McDonald, M. Bernado, F. Hunter, Y. Zhang, K. Li, M. Bednarski and S. Guccione, Bioconjugate Chem., 2005, 16, 995–999 CrossRef CAS PubMed.
- M. R. Duchen, Mol. Aspects Med., 2004, 25, 365–451 CrossRef CAS PubMed.
- X. Zhang, Y. Shiraisi and T. Hirai, Org. Lett., 2007, 9, 5039–5042 CrossRef CAS PubMed.
- N. Niamsa, C. Kaewtong, W. Srinonmuang, B. Wanno, B. Pulpoka and T. Tuntulani, Polym. Chem., 2013, 4, 3039–3046 RSC.
- Y. Li, R. Tong, H. Xia, H. Zhang and J. Xuan, Chem. Commun., 2010, 46, 7739–7741 RSC.
- N. A. P. Franken, H. M. Rodermond, J. Stap, J. Haveman and C. von Bree, Nat. Protoc., 2006, 1, 2315–2319 CrossRef CAS PubMed.
- K. Kattel, J. Y. Park, W. Xu, H. G. Kim, E. J. Lee, B. A. Bony, W. C. Heo, J. J. Lee, S. Jin, J. S. Baeck, Y. Chang, T. J. Kim, J. E. Bae, K. S. Chae and G. H. Lee, ACS Appl. Mater. Interfaces, 2011, 3, 3325–3334 CAS.
- a = 10.813 Å. JCPDS-International Centre for Diffraction Data, card no. 43-1014, PCPDFWIN, vol. 1.30, 1997.
- M. W. Ahmad, W. Xu, S. J. Kim, J. S. Baeck, Y. Chang, J. E. Bae, K. S. Chae, J. A. Park, T. J. Kim and G. H. Lee, Sci. Rep., 2015, 5, 8549 CrossRef CAS PubMed.
- R. G. Pearson, J. Am. Chem. Soc., 1963, 85, 3533–3539 CrossRef CAS.
- R. G. Pearson, J. Chem. Educ., 1968, 45, 581–587 CrossRef CAS.
- R. G. Pearson, J. Chem. Educ., 1968, 45, 643–648 CrossRef CAS.
- O. W. Duckworth and S. T. Martin, Geochim. Cosmochim. Acta, 2001, 65, 4289–4301 CrossRef CAS.
- S. J. Hug and D. Bahnemann, J. Electron Spectrosc. Relat. Phenom., 2006, 150, 208–219 CrossRef CAS.
- S. J. Hug and B. Sulzberger, Langmuir, 1994, 10, 3587–3597 CrossRef CAS.
- C. B. Mendive, T. Bredow, M. A. Blesa and D. W. Bahnemann, Phys. Chem. Chem. Phys., 2006, 8, 3232–3247 RSC.
- M. K. Corbierre, N. S. Cameron and R. B. Lennox, Langmuir, 2004, 20, 2867–2873 CrossRef CAS PubMed.
- W. M. Haynes, D. R. Lide and T. J. Bruno, CRC Handbook of Chemistry and Physics, 96th edn, CRC Press, Boca Raton, USA, 2015–2016, pp. 4–64 Search PubMed.
- M. Rogosnitzky and S. Branch, BioMetals, 2016, 29, 365–376 CrossRef CAS PubMed.
- H. S. Thomsen, Eur. J. Radiol., 2006, 16, 2619–2621 CrossRef PubMed.
- X. Miao, S. L. Ho, T. Tegafaw, H. Cha, Y. Chang, I. T. Oh, A. M. Yaseen, S. Marasini, A. Ghazanfari, H. Yue, K. S. Chae and G. H. Lee, RSC Adv., 2018, 8, 3189–3197 RSC.
- J. F. Hainfeld, D. N. Slatkin, T. M. Focella and H. M. Smilowitz, Br. J. Radiol., 2006, 79, 248–253 CrossRef CAS PubMed.
- (a) H. Maeda and N. Ishida, J. Biochem., 1969, 65, 777–783 CrossRef CAS PubMed; (b) H. Kawauchi, K. Tuzimura, H. Maeda and N. Ishida, J. Biochem., 1969, 66, 783–789 CrossRef CAS PubMed.
- A. Verma, O. Uzun, Y. Hu, Y. Hu, H.-S. Han, N. Watson, S. Chen, D. J. Irvine and F. Stellacci, Nat. Mater., 2008, 7, 588–595 CrossRef CAS PubMed.
- G. De Stasio, D. Rajesh, P. Casalbore, M. J. Daneils, R. J. Erhardt, B. H. Frazer, L. M. Wiese, K. L. Richter, B. R. Sonderegger, B. Gilbert, S. Schaub, R. J. Cannara, J. F. Crawford, M. K. Gilles, T. Tyliszczak, J. F. Fowler, L. M. Larocca, S. P. Howard, D. Mercanti, M. P. Mehta and R. Pallini, Neurol. Res., 2005, 27, 387–398 CrossRef CAS PubMed.
- H. Tokumitsu, H. Ichikawa, Y. Fukumori and L. H. Block, Chem. Pharm. Bull., 1999, 47, 838–842 CrossRef CAS PubMed.
- A. M. Dierling, B. R. Sloat and Z. R. Cui, Eur. J. Pharm. Biopharm., 2006, 62, 275–281 CrossRef CAS PubMed.
- M. O. Oyewumi and R. J. Mumper, Bioconjugate Chem., 2002, 13, 1328–1335 CrossRef CAS PubMed.
- M. J. Moghaddam, L. de Campo, M. Hirabayashi, P. A. Bean, L. J. Waddington, J. A. Scoble, G. Coiac and C. J. Drummond, Biomater. Sci., 2014, 2, 924–935 RSC.
- T. Watanabe, H. Ichikawa and Y. Fukumori, Eur. J. Pharm. Biopharm., 2002, 54, 119–124 CrossRef CAS PubMed.
- U. M. Le and Z. Cui, Int. J. Pharm., 2006, 312, 105–112 CrossRef CAS PubMed.
- M. O. Oyewumi, R. A. Yokel, M. Jay, T. Coakley and R. J. Mumper, J. Controlled Release, 2004, 95, 613–626 CrossRef CAS PubMed.
- S. Gao, X. Liu, T. Xu, X. Ma, Z. Shen, A. Wu, Y. Zhu and N. S. Hosmane, ChemistryOpen, 2013, 2, 88–92 CrossRef CAS PubMed.
- H. Kobayashi, S. Kawamoto, M. Bernardo, M. W. Brechbiel, M. V. Knopp and P. L. Choyke, J. Controlled Release, 2006, 111, 343–351 CrossRef CAS PubMed.
Footnote |
| † Electronic supplementary information (ESI) available: NMR spectrum of Rho-NH2, FT-IR absorption spectra of Rho, Rho-NH2, PAA, a mixture of PAA and Rho-PAA, surface-coating ligand and sample solution photos, XRD patterns, and MC50 cyclotron and thermal neutron irradiation facility photos are provided. See DOI: 10.1039/c8ra00553b |
| This journal is © The Royal Society of Chemistry 2018 |

