DOI:
10.1039/C8RA01417E
(Paper)
RSC Adv., 2018,
8, 20068-20076
Preparation and characterization of erythrocyte membrane cloaked PLGA/arsenic trioxide nanoparticles and evaluation of their in vitro anti-tumor effect
Received
14th February 2018
, Accepted 1st May 2018
First published on 1st June 2018
Abstract
Arsenic trioxide (ATO) is used for acute promyelocytic leukemia (APL) that is resistant to all-trans-retinoic acid, but its direct intravenous injection sometimes induces severe toxic side effects. Here, we developed a delivery system of red blood cell membrane (RBCM) cloaked poly (lactic-co-glycolic) acid (PLGA)-ATO nanoparticles (RPANs) to reduce the toxicity. PLGA was used to entrap the ATO, and the PLGA-ATO nanoparticles (PANs) were prepared by the emulsification method. Then RBCMs were employed to cloak the PANs using ultrasonication, to develop the RPANs delivery system. The prepared RPANs had a uniform size of around 233.6 nm with an obvious core–shell structure, as observed by TEM. The completeness of the membrane proteins was confirmed by SDS-PAGE and an in vitro release time of 65 h was determined for the RPANs. The RPANs also exhibited low cytotoxicity against the 293k kidney cell line (84.6% cell viability rate), which suggested that the ATO toxicity was reduced by RBCM cloaking. Moreover, the anti-tumor effects of the RPANs against the HL60 cell line were comparable to those of ATO solution. Our study demonstrated that the RPANs system has anti-tumor potential and could be developed into a safe and sustained release delivery system for ATO.
1. Introduction
Arsenic trioxide (As2O3, ATO), an effective anti-tumor drug, is mainly used for the treatment of acute promyelocytic leukemia (APL).1 In September 2000, subsequent to its first official approval by the China Food and Drug Administration (CFDA), the acid solution of ATO passed through phase I, II and III clinical trials and was approved by the FDA.2 In the treatment of APL, ATO can inhibit cell apoptosis, induce cell differentiation and exert anti-tumor effects.3 The effect of ATO has also been verified in clinical application for more than 20 years, and over 90% treated patients have achieved complete remission (CR).4 In addition, ATO does not show cross-resistance with other medicines commonly used in APL treatment such as all-trans-retinoic acid (ARTA).5 Moreover, it can ameliorate hemorrhage symptoms, the most common cause of death with APL. Therefore, it has become a priority medicine for refractory-relapsed APL treatment.6,7 The arsenious acid intravenous injection is the only dosage form in the market, but after intravenous administration, severe toxic side effects can be induced due to the rapidly raised plasma-drug concentration.8
In the past few years, researchers have begun to focus on alternative ATO delivery systems to arsenious acid intravenous injection. Some materials have been found to facilitate the controlled release of ATO, avoid severe toxicity and reduce side effects.9 Sheldon10 used ATO/magnetic nanoparticle (MZF) thermosensitive magnetoliposomes to explore the way in which inorganic arsenic inhibits cell cycle progression through the E2F1-retinoblastoma protein (pRB) as well as its application in cancer therapy. Jadhav et al.11 synthesized dimercaptosuccinic acid (DMSA)/chitosan for coating ATO nanoparticles to study their in vitro antiproliferative activity along with their mechanism of action on LNCaP and PC-3 cell lines. A promising strategy for targeting HPV-infected cervical cancer cells using lipid encapsulated ATO nanoparticles was shown by Wang et al.12 Xiao et al.13 employed polyacrylic acid capped ATO loaded mesoporous silica nanoparticles to improve the pharmacokinetic features of arsenic trioxide and inhibit the growth of cancer cells and solid tumors. In addition, other delivery systems have been developed, like an ATO loaded microemulsion,14 ATO nano-encapsulated in polymersomes,2 arsenoplatins15 etc. These nanosized or microsized dosage forms can achieve sustained release of ATO which consequently decreases the plasma-drug concentration and reduces toxicity, but the problem is that these materials have poor biocompatibility with the body's immune and complement systems.16
Red blood cells (RBCs, or erythrocytes) and RBC membranes (RBCM, or erythrocyte membranes) are effective cell based drug delivery systems that can be traced back to the early 1950s.17 Erythrocytes are endowed with many advanced characteristics such as good biocompatibility and biodegradability, long circulation life spans, decreased macrophage cell uptake and blood clearance.18,19 On the surface of RBCs, there are abundant glycans, sialic acid, proteins and receptors which play a critical role in avoiding the immune response.20 An intact RBC membrane directly coated on the surface of nanoparticles could inherit all of these superiorities.21 Su et al.22–24 conducted extensive research by using RBC membrane-camouflaged nanoparticles for the treatment of metastatic breast cancer and proved their effectiveness. Furthermore, Zhang et al.25 explored a strategy to load the chemotherapeutic doxorubicin and the antibiotic vancomycin into RBC membrane-derived vesicles. Similarly, Escajadillo et al.26 developed a RBC membrane-camouflaged nanoparticle for encapsulating antibacterials. These new biomimetic nanoformulations have exploited the advantages of different functionalities and have shown a promising future for the design of RBC-based nanoformulations with therapeutic agents.27
In this research, we designed and prepared a RBCM cloaked poly (lactic-co-glycolic) acid (PLGA)-ATO nanoparticle system to reduce toxicity and extend the effective duration after intravenous administration of ATO (Fig. 1). Firstly, we used PLGA to entrap ATO, and prepared the PLGA-ATO nanoparticles (PANs). PLGA has favorable biocompatibility, and can be degraded into water and carbon dioxide in vivo.28 Secondly, we prepared RBCM cloaked PLGA-ATO nanoparticles to develop the RPANs delivery system. Finally, the particle morphology, stability, drug encapsulation efficiency, sustained release profile, RBCM protein retention, in vitro cytotoxicity and anti-tumor effect of the RPANs were systematically characterized and evaluated, which may provide a logical basis for ATO nanoformulations. The, RBCM cloaked delivery system offers a safe, effective and extended release potential for ATO.
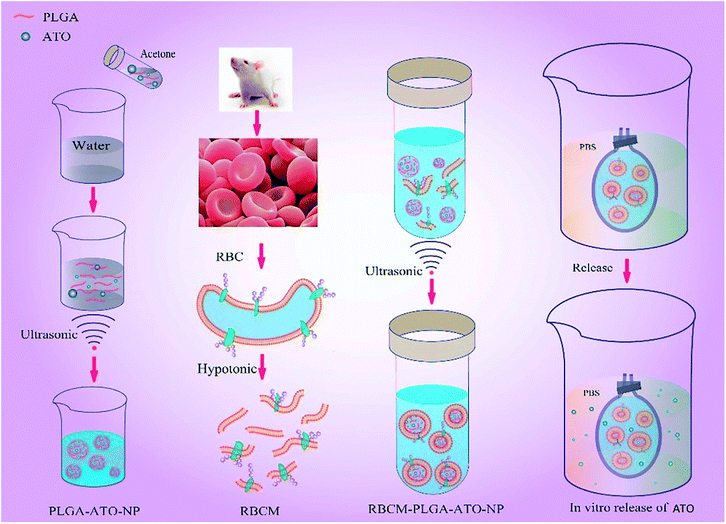 |
| | Fig. 1 Preparation and characterization of RBCM-PLGA-ATO-NPs (RPANs). | |
2. Materials and methods
2.1 Materials
PLGA (LA/GA ratio 50![[thin space (1/6-em)]](https://www.rsc.org/images/entities/char_2009.gif) :50, average molecular weight Mw 30000) was purchased from Jinan Dangang Biomaterial Co., Ltd (Shandong, China) and kept in the dark at −20 °C. Pluronic F-68 was purchased from Shanghai Fu Ning Technology Co., Ltd (China) and kept in the dark at room temperature. Fetal bovine serum (FBS) was obtained from Hyclone (America). Cell Counting Kit-8 (CCK8) was purchased from Dojindo (Japan). Dialysis bags (Mw 3000 Da) were purchased from Thermo Scientific. 4′,6-Diamidino-2-phenylindole (DAPI), 3,3′-dioctadecyloxacarbocyanine perchlorate (DiO) and 1,1-dioctadecyl-3,3,3,3-tetramethylindodicarbocyanine (DiD) were obtained from AmyJet Scientific. Human promyelocytic leukemia cells (HL60 cells) and 293t cells were purchased from COBIOER (China) and cultured in DMEM medium supplemented with 15% FBS. Cells were kept in an incubator at 37 °C in an atmosphere of 5% CO2. All other reagents were of analytical grade.
:50, average molecular weight Mw 30000) was purchased from Jinan Dangang Biomaterial Co., Ltd (Shandong, China) and kept in the dark at −20 °C. Pluronic F-68 was purchased from Shanghai Fu Ning Technology Co., Ltd (China) and kept in the dark at room temperature. Fetal bovine serum (FBS) was obtained from Hyclone (America). Cell Counting Kit-8 (CCK8) was purchased from Dojindo (Japan). Dialysis bags (Mw 3000 Da) were purchased from Thermo Scientific. 4′,6-Diamidino-2-phenylindole (DAPI), 3,3′-dioctadecyloxacarbocyanine perchlorate (DiO) and 1,1-dioctadecyl-3,3,3,3-tetramethylindodicarbocyanine (DiD) were obtained from AmyJet Scientific. Human promyelocytic leukemia cells (HL60 cells) and 293t cells were purchased from COBIOER (China) and cultured in DMEM medium supplemented with 15% FBS. Cells were kept in an incubator at 37 °C in an atmosphere of 5% CO2. All other reagents were of analytical grade.
2.2 Preparation of RBCM
Whole blood was collected from rats by cardiac puncture, transferred into a tube with heparin sodium for anticoagulation, and then centrifuged (1117g, 10 min) at 4 °C to remove the plasma and leukocytes. The RBCs were washed three times with 1× phosphate buffered saline (PBS), and then EDTA solution (0.2 mM) was added for hemolysis in hypotonic conditions. The released hemoglobin was removed by centrifugation (13474g, 10 min) and the membranes were washed 2–3 times with EDTA solution until the supernatant was colorless. The RBCMs were stored at −80 °C. All procedures involving animals were performed in accordance with the Guidelines for Care and Use of Laboratory Animals of Shanghai Jiao Tong University and approved by the Animal Ethics Committee (number: A2018021).
2.3 Preparation of RBCM cloaked PLGA-ATO nanoparticles (RPANs)
PLGA nanoparticles were prepared by an improved double-emulsion (water-in-oil-in-water) solvent evaporation/extraction technique. The PLGA was dissolved in acetone to form a 1% solution as the organic phase. Then a 0.1 mL internal aqueous phase containing 0.1% ATO was emulsified into the 1 mL organic phase by ultrasonication for 5 min to form a primary emulsion, which was then added to 10 mL of Pluronic F-68 aqueous solution. The mixture was then stirred open to the air for about 4 h to evaporate the acetone and make the PLGA-ATO nanoparticle (PAN) cores. The suspension of PAN cores was mixed with 0.8 mL pre-made RBCM. Then the mixture was used to prepare RBCM cloaked PANs (RPANs) by ultrasonication (100 W, 3 min).
2.4 Particle size, polymer dispersity index analysis and zeta potential measurement
The mean particle size, polymer dispersity index (PDI) and zeta potential of the nanoparticles were detected by a laser scattering method using a Zeta Sizer, with an infrared laser (λo = 633 nm, He–Ne, 4.0 Mw). For size measurements, nanoparticles (1 mg) were dissolved in water (1 mL) to form nanosuspensions which were further diluted with water and measured for at least 120 s. For zeta potential measurements, the samples were placed in an electrophoretic cell, in which the zeta potential of the nanoparticles was analyzed.
2.5 Particle morphology study
Particle morphology was observed by transmission electron microscopy (TEM). Samples (nanoparticulate suspensions, 100 μg mL−1) were supported on formvar-coated copper grids. After being completely dried, they were stained with uranyl acetate (2%, w/v). Image capture and analysis were performed with Digital Micrograph and Soft Imaging Viewer Software.
2.6 Drug encapsulation efficiency and loading rate determination
The content of ATO encapsulated in the nanoparticles was determined by inductively coupled plasma-atomic emission spectroscopy (ICP-AES). Compared with other detection methods, such as atomic absorption spectrophotometry and atomic fluorescence spectrometry, ICP-AES, with inductively coupled plasma as the excitation light source, offers higher accuracy and precision, faster determination and a wider linear range. The aforementioned PAN core suspension was placed in a dialysis bag (Mw cutoff 3000 Da), hermetically sealed and immersed into a 20 times volume of ultrapure water for 7 h. Then the concentration of the dialysate was detected by ICP-AES. The curve of arsenic concentration showed a good linearity, with a correlation coefficient (r) of 0.99994–0.99992. The drug encapsulation efficiency and loading rate were calculated by the following equations:
| Encapsulation efficiency = (Mt − Md)/Mt × 100% |
| Loading rate = (Mt − Md)/(Mt − Md + Mp) × 100% |
Mt: total mass of used ATO, Md: mass of ATO in the dialysis solution, Mp: mass of the used PLGA.
2.7 In vitro stability study
To determine the suspension stability of the nanoparticles, 2 mg mL−1 of the nanoparticles was suspended in PBS (0.1 M, pH 7.4) at 4 °C and the suspension stability of the nanoparticles was analyzed by monitoring the particle size and polymer dispersity index at 5, 10 and 15 d.
2.8 In vitro release study
The drug release test was performed in pH 7.4 PBS using dialysis. The dialysis membranes (cellulose, Mw cutoff 3000 Da) were soaked overnight in the dissolution media to ensure thorough wetting of the membrane. 1 mL of RPANs solution was placed into the dialysis bag and the two ends were tied and fixed. The dialysis bag was submerged into a beaker containing 50 mL of PBS at 37 ± 0.5 °C in an orbital shaker incubator. Aliquots (1 mL) of the PBS were taken out at predetermined time intervals of 0.5, 1, 2, 4, 8, 16, 24, 36, 48, 60, 64 h, and immediately replaced by an equal volume fresh PBS. Then the samples were analyzed by ICP-AES. A similar study was conducted with PANs and pure ATO solution.
2.9 Cell uptake study of RPANs
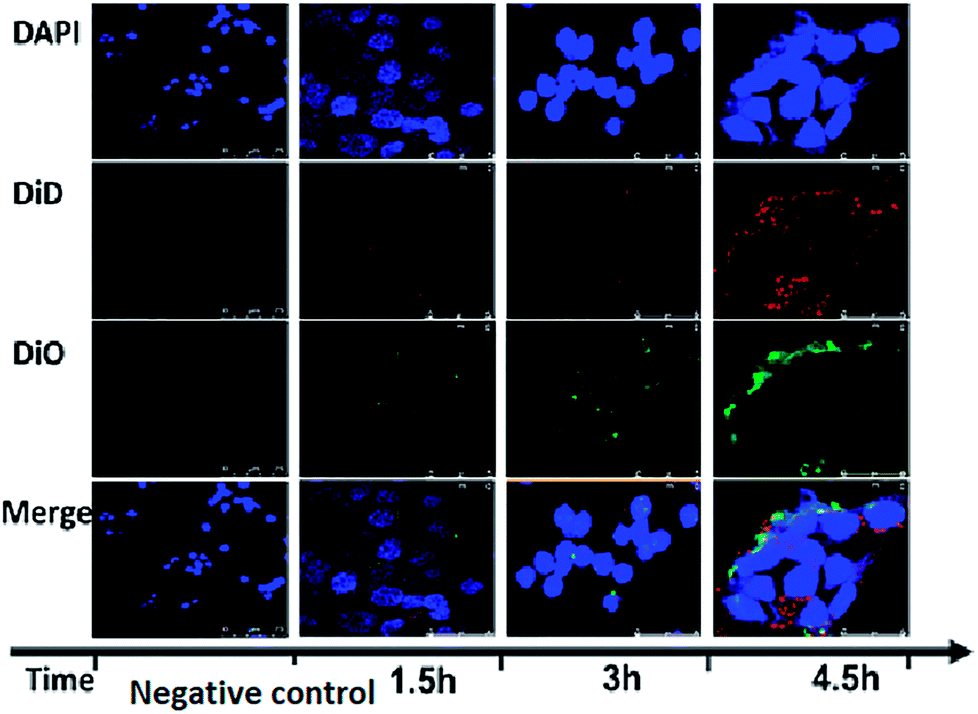
To verify the in vitro cellular uptake of RPANs and the integrity of the core–shell particle structure, RBCM, PLGA and HL60 cells were labelled with the fluorescent reagents DiD, DiO and DAPI respectively. Then DiO labeled PANs were prepared according to the method described earlier, and the redundant fluorescent reagent was removed by dialysis. Finally, the DiD labelled RBCM was used to coat the prepared DiO labeled PANs. After incubation with HL60 cells for 1.5, 3 and 4.5 h, the internalized dual-fluorophore-labeled RPANs were visualized under the laser scanning confocal microscope. In order to eliminate interference from the instrument, a negative control group (without nanoparticles) was prepared and added to HL60 cells.
2.10 Membrane protein retention of RBCM confirmed by SDS-PAGE
Sodium dodecyl sulphate-polyacrylamide gel electrophoresis (SDS-PAGE) was performed with RPANs, PANs and natural RBCM to confirm that the preparation process of the RPANs system did not destroy the membrane protein components of the RBCM. The adhesive tape was torn at the bottom of a precast gel, which was fixed in an electrophoresis tank. The internal and the external grooves of the installed tank were both filled with electrophoresis buffer. Bubbles and residual buffers in the sample wells were rinsed using a pipette. RBCM, PANs and RPANs were prepared according to Sections 2.2 and 2.3. SDS-PAGE sample loading buffer was dissolved in an aqueous bath at 37 °C. The loading buffer was mixed with each kind of sample in a ratio of 1 : 4 respectively. The prepared samples were heated in a boiling bath for 3–5 min to denature the proteins and then allowed to cool down to room temperature naturally. The loading volume of the prepared samples was 10 μL. Prestained color protein ladder (5 μL) was dissolved in an aqueous bath at 37 °C. Finally, the electrophoresis gel was de-stained on a shaker for 120 min in a tank filled with ultrapure water, which was renewed every 15 min.
2.11 Hemolysis and hemagglutination assay
ATO is administrated through intravenous injection, so this experiment was designed to ensure that RPANs could not cause hemolysis, and to verify the best concentration to use. Sterile defibrinated rat blood (2 mL) was centrifuged (2000 rpm, 5 min) and washed 4 times. Then isotonic saline was added to prepare a RBC suspension (2%, v/v). The RBC suspension, RPANs with different concentrations, isotonic saline and ultrapure water were added into 5 tubes as shown in Table 1. Isotonic saline and ultrapure water were taken as the negative control group and positive control group, respectively. The samples were incubated at 37 °C for 3 and 48 h to observe any hemolysis and coagulation.
Table 1 In vitro hemolysis and coagulation testing of RPANs
| Substance |
Group number |
| 1 |
2 |
3 |
Isotonic saline |
Ultrapure water |
| RPANs (mL) |
0.175 |
0.35 |
0.7 |
— |
— |
| Isotonic saline (mL) |
2.325 |
2.15 |
1.8 |
2.5 |
— |
| Ultrapure water (mL) |
— |
— |
— |
— |
2.5 |
| 2% RBC suspension (mL) |
2.5 |
2.5 |
2.5 |
2.5 |
2.5 |
| Final concentration of ATO (mg mL−1) |
0.035 |
0.07 |
0.14 |
— |
— |
| Results (3 h) |
— |
— |
— |
— |
+ |
| Results (48 h) |
+ |
+ |
— |
— |
+ |
2.12 Cytotoxicity and anti-tumor effect of RPANs
HL60 cells and 293t cells were cultured for 24 h (37 °C, 5% CO2). A drug dosage of 100 μL ATO solution (ATO group, ATOG, 0.5 mg mL−1) or RPANs (NP group, NPG, 20 mg mL−1) was added. In addition, an ATO solution blank control group (control group 1, CG1) was set up for each plate, in which only ATO solution and CCK8 were added into the wells to eliminate any errors from the ATO solution and CCK8 working solution. Similarly, a nanoparticle blank control group (control group 2, CG2) was set up for each plate to eliminate any errors from the RPANs and CCK8 working solution, and a negative control group (NCG) was set up including only cells and the CCK8 working solution. Four sample plates were incubated (37 °C, 5% CO2) for 12, 24, 48 and 72 h. After incubation, CCK8 working solution (10 μL) was added into each well and incubated for a further 3 h. The dual-wavelength method (detection wavelength: 450–490 nm, reference wavelength: 600–650 nm) was used to detect the optical density (OD) values of each well with a micro-plate reader. The OD value of the negative control group was taken as 1. The relative activity of each group was calculated to determine the inhibitory rate curves for HL60 cells and the survival rate curves for 293t cells with ATO solution and RPANs. The HL60 cell inhibitory rate and 293t cell survival rate were calculated using the following equations:
| Inhibitory rate with ATOG = (1 − OD valueATOG − OD valueCG1)/OD valueNCG × 100% |
| Inhibitory rate with NPG = (1 − OD valueNPG − OD valueCG2)/OD valueNCG × 100% |
| Survival rate with ATOG = (OD valueATOG − OD valueCG1)/OD valueNCG × 100% |
| Survival rate with NPG = (OD valueNPG − OD valueCG1)/OD valueNCG × 100% |
ATOG: ATO group, NPG: NP group, OD: optical density, NCG: negative control group, CG1: control group 1, CG2: control group 2.
3. Results and discussion
3.1 Characteristics of RPANs
The entrapment of PLGA-ATO nanoparticles (PANs) into RBCMs is a necessary prerequisite for ATO delivery. The formation of RPANs was driven by a mechanical force, which could facilitate the passage of the PANs through the membrane lipid bilayers by the vesicle-particle fusion process. The formation of the RPANs was confirmed by measurements of particle size and zeta potentials, and by TEM images.
We firstly examined the sizes of the PANs before and after the RBCM coating. Ten batches of nanoparticles were prepared. The PDI values of all the nanoparticles (Fig. 2A) were in the range of 0.079–0.221 which shows that the nanoparticles were well dispersed and had good stability. The particle sizes (Fig. 2B) of the RPANs ranged from 213.4–245.6 nm, which represented an increase by 15–15.9 nm compared to the size of the PANs (197.5–230.6 nm). This was because of the ∼8 nm thick lipid shell (the membrane width of RBCs). The ten batches also showed (Fig. 2C) that the zeta potential of RPANs (−29.7 mV) was slightly increased compared with that of PANs (−35.5 mV). This was because of the charge screening by the RBCM of the PLGA negative charge of PANs.29 The average drug loading rate of RPANs was 2.87%. Moreover, we simultaneously monitored the PDI and particle size of RPANs at different time intervals to investigate their stability. The curve is shown in Fig. 2D. The changes were small, but after about 15 days, some visible precipitation appeared in the suspension. The results revealed that the nanoparticles were stable for up to 15 days in a PBS suspension at 4 °C, which is suitable for ATO delivery.
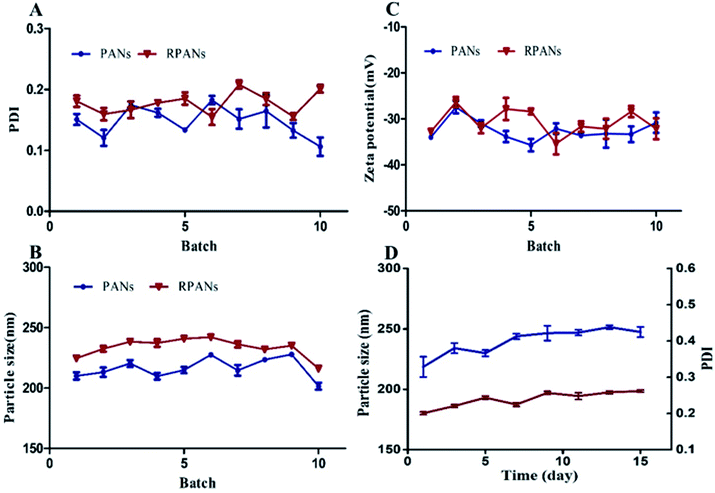 |
| | Fig. 2 Repeatability of PDI, particle size and zeta potential for PANs and RPANs, and the stability of RPANs (A) PDI, (B) particle size and (C) zeta potential, showing excellent reproducibility. The stability of RPANs (D) is excellent; the PDI (red line) ranges from 0.079–0.221 and the particle size (blue line) ranges from 213–245.6 nm. | |
Then the RPANs were negatively stained with uranyl acetate and visualized using TEM. All the particles were uniformly distributed and spherical in shape with smooth edges. A complete core–shell structure was also observed. As shown in Fig. 3, the particle size was about 50 nm. The difference in the size from TEM as compared with the size from the DLS data was due to the vacuum evacuation process used in TEM, which eliminates the water film outside the nanoparticles. Therefore the particle size measured by the DLS was larger than the actual particle size. Collectively, these results show that the RPANs had been successfully prepared, and that the PAN cores were camouflaged with unilamellar RBC membranes.
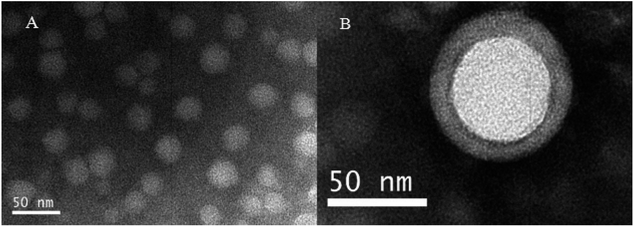 |
| | Fig. 3 Morphology of RPANs observed by TEM (A) the distribution of nanoparticles, and (B) the core-membrane structure of RPANs. | |
3.2 Cell uptake measured by confocal microscopy
To further verify the completeness of the core–shell RPANs structure, DiO and DiD fluorophores were loaded into the PAN cores and the RBCM-derived vesicles, respectively, prior to the vesicle-particle fusion process. The image of the negative control group did not show any red or green fluorescence, which proved that any interference from the instrument could be discounted. To study the cellular trafficking kinetics of RPANs, HL60 cells were observed using confocal microscopy at different time points. The red and green fluorescence became more intense with the passage of time, as shown in Fig. 4. This represented the gradual absorbing of the RPANs into the HL60 cells. The strongest fluorescence intensity was observed after 4.5 h and the red and green fluorescence images coincided with each other, which indicated that the core–shell structure of RPANs was retained completely even after the nanoparticles were internalized by the cells.
 |
| | Fig. 4 Fluorescent images of RPAN uptake by HL60 cells. The DAPI group (blue) indicates the HL60 cell nuclei; the DiD group (red) indicates the RBCMs; and the DiO group (green) indicates PLGA. The merged images show that the RBCM and PANs coincide with each other. | |
3.3 Membrane protein retention of RBCM confirmed by SDS-PAGE
SDS-PAGE was used to confirm that the RBCM extraction and nanoparticle wrapping process did not destroy the protein content of the RBCM or influence the function of the RBCM; it was critical that the RPANs could still escape from the immune system. The RPANs were dialyzed using 50 nm porous membranes for 24 h. The unbound proteins were removed and loading buffer (1 μL) was then mixed with the sample (4 μL). The prepared samples were heated in a boiling water bath for 3–5 min to denature the proteins and then cooled down to room temperature naturally. As a comparison, samples of natural RBCM and PANs were prepared in parallel. Proteins were separated by PAGE. Most membrane protein bands were retained in the RPANs sample, indicating that they endured the particle preparation process, as shown in Fig. 5. The PANs exhibited no electrophoretic bands. This suggests that the PLGA and ATO had no effect on the experimental results because the solid PAN cores precluded protein entry and the unbound proteins were filtered out by dialysis. The tested membrane proteins were mostly anchored in the lipid bilayer of the membranes encircling the nanoparticles. This result shows that most membrane proteins were retained in the RPANs during the particle preparation and it implies that the functionalities of the RBCM were retained during the preparation.
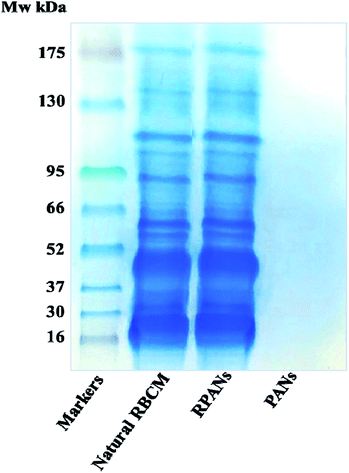 |
| | Fig. 5 SDS-PAGE assay showing the retention of RBCM proteins in RPANs. The four electrophoretic bands are the prestained color protein molecular weight markers, natural RBCMs, RPANs and PANs. | |
3.4 In vitro release of ATO from the RPANs system
Diffusion out of a dialysis bag was measured to test in vitro drug release of the nanoparticles. PANs, RPANs or ATO solution (10 mL) were each placed in a dialysis bag (Mw cutoff 3000 Da), hermetically sealed and immersed into PBS (50 mL, pH 7.4). The entire system was subject to continuous magnetic stirring (200 rpm) at room temperature. Although a burst release could be observed, the release time of RPANs was obviously longer than that of the PANs and ATO solution as shown in Fig. 6. For the ATO group, 93% of the drug was released in the first 2 h, and it was completely released within 4 h. For the PANs group, 91% of the drug was released by 16 h, and it was completely released within 24 h. However, for the RPANs group, 59% of the drug was released in the first 8 h, and then a slow release curve was observed until the complete release at 65 h. Compared with the PANs and ATO groups, the RPANs group showed an obvious sustained release over 65 h. Previously, studies have shown that encapsulated drugs could be released from RBCM coated nanocarriers either slowly (by diffusion through the RBC plasma membrane and its eventual degradation) or rapidly (by lysis of the RBC nanocarriers by plasma complements).30 Moreover, a high glycolide content in drug-encapsulated PLGA nanoparticles led to faster degradation.31 Other factors like possible interactions between the drug and the external environment of a polymer matrix have also influenced the mechanism and rate of drug release.32
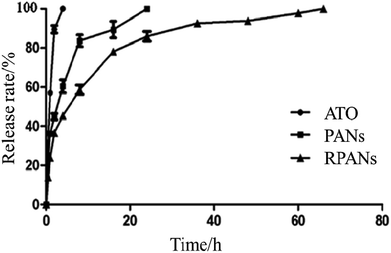 |
| | Fig. 6 In vitro release profiles of different ATO formulations in PBS. | |
3.5 Hemolysis and hemagglutination test
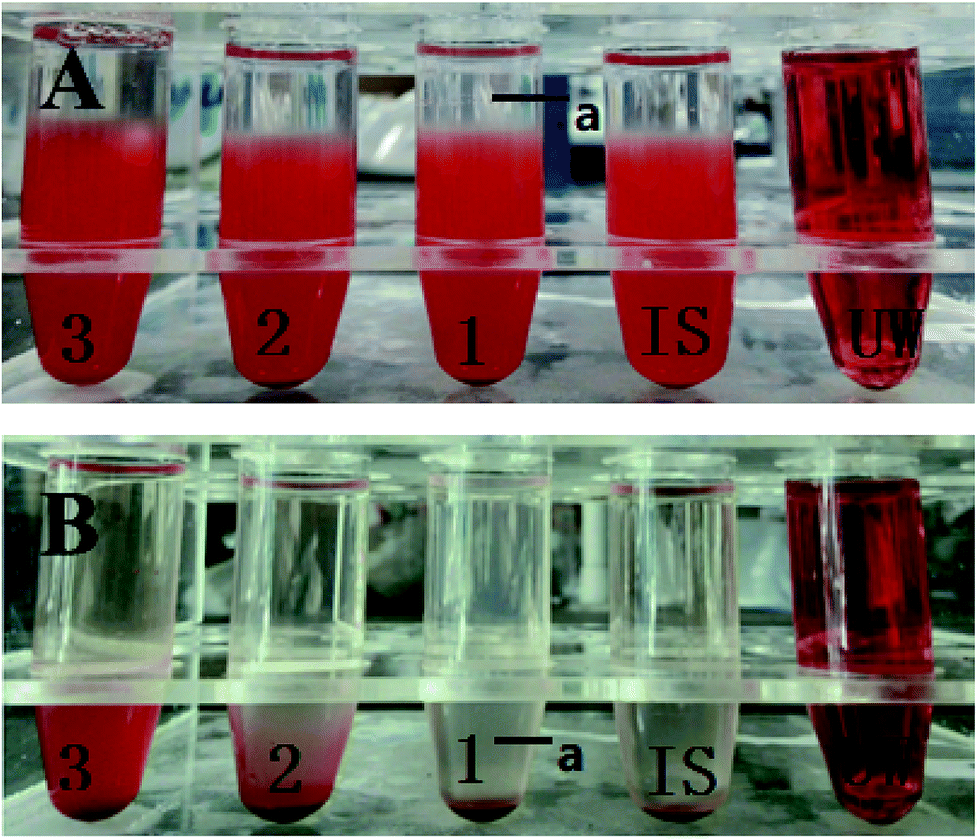
As the nanoparticles are administered mostly intravenously, it is necessary to affirm through a hemolysis test whether or not the nanoparticles can cause the rupture of RBCs. The supernatants of three medication administration teams (MATs) with final ATO concentrations of 0.035 mg mL−1 (1), 0.07 mg mL−1 (2) and 0.14 mg mL−1 (3) were transparent and colorless after 3 h, as shown in Fig. 7A. No significant difference was found between the MATs and the isotonic saline (IS) negative control group. Moreover, erythrocyte aggregation could not be observed using an inverted phase contrast microscope. After 48 h incubation at 37 °C, MAT groups 2 and 3 showed slight hemolysis and hemagglutination (Fig. 7B). This was because the increased ATO concentration could cause rupturing and hemolysis of the RBCMs. However, group 1 (deceased concentration) was still transparent and colorless without the phenomenon of hemolysis. Therefore, the erythrocyte toxicity of RPANs (ATO concentration: 0.035 mg mL−1) was negligible, which indicated that a long blood contact time might not cause hemolysis and coagulation of RBCs in the human body. The hemolysis and hemagglutination test result implies that the optimal RPANs system is safe and could be used for intravenous infusion.
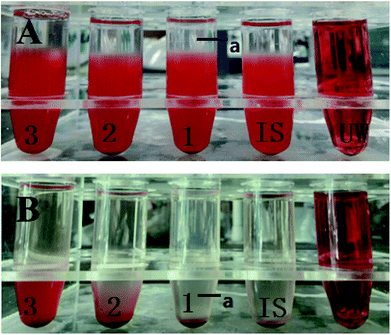 |
| | Fig. 7 Hemolysis and hemagglutination test (A) RBCs after 3 h incubation, and (B) RBCs after 48 h incubation; ‘a’ indicates the clear supernatant. | |
3.6 In vitro cytotoxicity and anti-tumor effect of RPANs
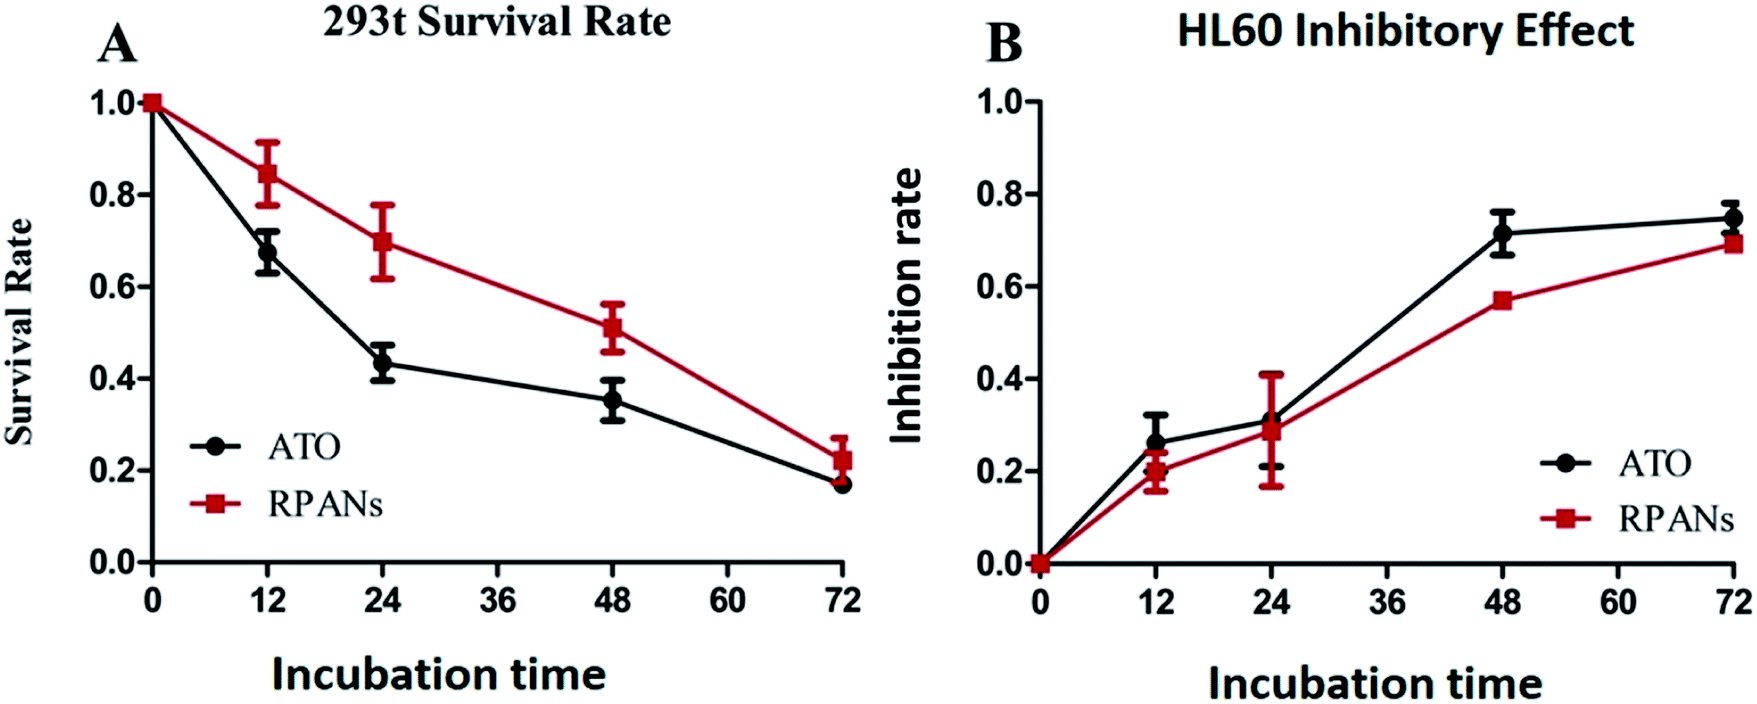
Human embryonic kidney cell line 293t was used as a normal cell group to test the toxicity of the nanoparticles by CCK8 assay. After 12 h incubation, the cell viability rates for the RPANs system and the ATO solution were 84.6% and 67.5% (Fig. 8A). After 24 h, the cell viability rate for the RPANs was still above 70%, which was notably higher than that for the ATO solution (43.4%). After 72 h, after ATO had been released from the nanoparticles, the cell viability rate for the RPANs (22.2%) was nearly the same as that for the ATO solution (16.9%), which indicated the sustained release effect of the RPANs. In summary, compared with ATO solution, the inhibitory effect of the RPANs group on normal 293t cells was obviously slower and weaker. The cell survival rate of the RPANs group was higher than that of the ATO solution group.
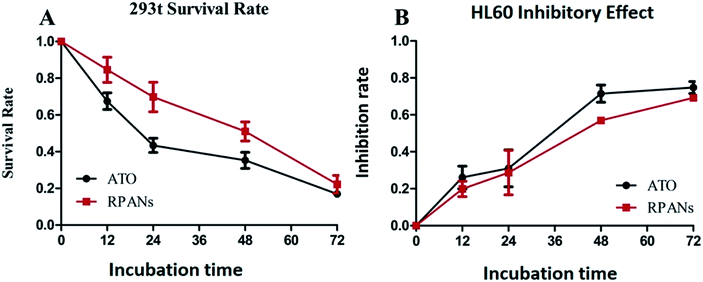 |
| | Fig. 8 Cytotoxicity and anti-tumor effect of RPANs (A) 293t survival rate curves, and (B) HL60 inhibitory effect curves. | |
HL60 cells were used to evaluate the in vitro anti-tumor effect of RPANs by CCK8 assay.33 The inhibitory rates (Fig. 8B) of ATO solution and the RPANs system were 26.1% and 19.9%, respectively, after 12 h incubation, which indicated a similar level of anti-tumor efficacy of RPANs and ATO solution in the HL60 tumor cell model. When the treatment time was extended to 24 h, RPANs also showed nearly the same inhibitory effect as ATO solution based on the inhibition rates of the ATO solution (31.0%) and RPANs system (28.7%). Over the entire time span, the RPANs system showed similar activity to the ATO solution. In addition, the RPANs system induced differentiation of the HL60 cells, which was similar to the effect of a traditional ATO solution.
From the in vitro cytotoxicity and anti-tumor effect assays of RPANs in different cell lines, the RPANs system was found to have a high anti-tumor efficacy in the HL60 tumor cell model and to show lower cytotoxicity in the normal 293t cell line compared with the ATO solution. As we all know, loading of anti-tumor drugs into nanocarriers can reduce toxicity due to the higher target specificity conferred by the nanocarriers.30 The RBCM based nanocarrier provided ATO formulations with prolonged circulation times and longer half-lives compared to those of other nanocarriers.
4. Conclusion
The purpose of this project was to achieve a long circulation time and sustained release of ATO and to reduce its toxicity. To counter the obvious burst effect of ATO solution, we used PLGA as the skeleton material, creating PLGA-ATO nanoparticles (PANs). Then RBCMs were used to cloak the PANs to achieve a long circulation time via the immune escape properties of RBCMs. The RPANs had a uniform size of around 233.6 nm, which was an increase of 17.2 nm compared with the PANs (without the RBMC coating). The composition of the membrane proteins was confirmed by SDS-PAGE. RPANs retained a core–shell structure even after being absorbed by human promyelocytic leukemia (HL60) cells. The results showed that the RPANs offered an obvious sustained release, with a release time of 65 h. Moreover, it was demonstrated that RPANs showed lower cytotoxicity than ATO solution to normal 293t cells and an anti-tumor effect against HL60 cells. Therefore, the developed RPANs system is a promising option for the safe and effective delivery of ATO.
Conflicts of interest
The authors confirm that this article has no conflict of interest.
Acknowledgements
This work was supported by the National Natural Science Foundation of China (Grant No. 81977757) and the Major New Drugs Innovation and Development Foundation of Ministry of Science and Technology of China (Grant No. 2018ZX09711003-008-002).
References
- F. Lococo, L. Cicconi and M. Breccia, Br. J. Haematol., 2015, 172, 841–854 CrossRef PubMed.
- Q. Zhang, M. R. Vakili, X. F. Li, A. Lavasanifar and X. C. Le, Biomaterials, 2014, 35, 7088–7100 CrossRef PubMed.
- J. J. Stevens, B. Graham, E. Dugo, B. Berhaneselassie-Sumner, K. Ndebele and P. B. Tchounwou, J. Cancer Sci. Ther., 2017, 9, 298–306 Search PubMed.
- T. Hu, H. Cao, C. Yang, L. Zhang, X. Jiang, X. Gao, F. Yang, G. He, X. Song, A. Tong, G. Guo, C. Gong, R. Li, X. Zhang, X. Wang and Y. Zheng, ACS Appl. Mater. Interfaces, 2016, 8, 6586–6601 Search PubMed.
- F. Atashrazm, R. M. Lowenthal, J. L. Dickinson, A. F. Holloway and G. M. Woods, Oncotarget, 2016, 7, 46028–46041 CrossRef PubMed.
- L. Salerno, G. Romeo, M. N. Modica, E. Amata, V. Sorrenti, I. Barbagallo and V. Pittala, Eur. J. Med. Chem., 2017, 142, 163–178 CrossRef PubMed.
- F. Bautista, J. Van der Lugt, P. R. Kearns, F. J. Mussai, C. M. Zwaan and L. Moreno, Expert Opin. Drug Discovery, 2016, 11, 1111–1122 CrossRef PubMed.
- F. Giordani, L. J. Morrison, T. G. Rowan, H. P. De Koning and M. P. Barrett, Parasitology, 2016, 143, 1862–1889 CrossRef PubMed.
- A. Akhtar, S. Xiaoyan Wang, L. Ghali, C. Bell and X. Wen, J. Biomed. Res., 2017, 31, 177–188 Search PubMed.
- L. A. Sheldon, Cell Cycle, 2017, 16, 2058–2072 CrossRef PubMed.
- V. Jadhav, P. Ray, G. Sachdeva and P. Bhatt, Life Sci., 2016, 148, 41–52 CrossRef PubMed.
- X. Wang, D. Li, L. Ghali, R. Xia, L. P. Munoz, H. Garelick, C. Bell and X. Wen, Nanoscale Res. Lett., 2016, 11, 94 CrossRef PubMed.
- X. Xiao, Y. Liu, M. Guo, W. Fei, H. Zheng, R. Zhang, Y. Zhang, Y. Wei, G. Zheng and F. Li, J. Biomater. Appl., 2016, 31, 23–35 CrossRef PubMed.
- P. Kopel, D. Wawrzak, V. Milosavljevic, A. Moulick, M. Vaculovicova, R. Kizek and V. Adam, Nanotechnol. Res. J., 2015, 8, 1–51 Search PubMed.
- D. U. Miodragovic, J. A. Quentzel, J. W. Kurutz, C. L. Stern, R. W. Ahn, I. Kandela, A. Mazar and T. V. O'Halloran, Angew. Chem., Int. Ed. Engl., 2013, 52, 10749–10752 CrossRef PubMed.
- D. P. Otto, A. Otto and M. M. de Villiers, Expert Opin. Drug Delivery, 2015, 12, 763–777 CrossRef PubMed.
- A. V. Gothoskar, Pharm. Technol., 2004, 28, 140–155 Search PubMed.
- Y. Sun, J. Su, G. Liu, J. Chen, X. Zhang, R. Zhang, M. Jiang and M. Qiu, Eur. J. Pharm. Sci., 2017, 96, 115–128 CrossRef PubMed.
- X. Sun, C. Wang, M. Gao, A. Hu and Z. Liu, Adv. Funct. Mater., 2015, 25, 2386–2394 CrossRef.
- L. Rao, L. L. Bu, J. H. Xu, B. Cai, G. T. Yu, X. Yu, Z. He, Q. Huang, A. Li, S. S. Guo, W. F. Zhang, W. Liu, Z. J. Sun, H. Wang, T. H. Wang and X. Z. Zhao, Small, 2015, 11, 6225–6236 CrossRef PubMed.
- H. Ding, Y. Lv, D. Ni, J. Wang, Z. Tian, W. Wei and G. Ma, Nanoscale, 2015, 7, 9806–9815 RSC.
- J. Su, H. Sun, Q. Meng, Q. Yin, P. Zhang, Z. Zhang, H. Yu and Y. Li, Adv. Funct. Mater., 2016, 26, 7495–7506 CrossRef.
- J. Su, H. Sun, Q. Meng, Q. Yin, S. Tang, P. Zhang, Y. Chen, Z. Zhang, H. Yu and Y. Li, Adv. Funct. Mater., 2016, 26, 1243–1252 CrossRef.
- J. Su, H. Sun, Q. Meng, P. Zhang, Q. Yin and Y. Li, Theranostics, 2017, 7, 523 CrossRef PubMed.
- X. Zhang, P. Angsantikul, M. Ying, J. Zhuang, Q. Zhang, X. Wei, Y. Jiang, Y. Zhang, D. Dehaini and M. Chen, Angew. Chem., Int. Ed. Engl., 2017, 56, 14075–14079 CrossRef PubMed.
- T. Escajadillo, J. Olson, B. T. Luk, L. Zhang and V. Nizet, Front. Pharmacol., 2017, 8, 477 CrossRef PubMed.
- X. Ren, R. Zheng, X. Fang, X. Wang, X. Zhang, W. Yang and X. Sha, Biomaterials, 2016, 92, 13–24 CrossRef PubMed.
- D. N. Kapoor, A. Bhatia, R. Kaur, R. Sharma, G. Kaur and S. Dhawan, Ther. Delivery, 2015, 6, 41 CrossRef PubMed.
- W. Gao, C. M. Hu, R. H. Fang, B. T. Luk, J. Su and L. Zhang, Adv. Mater., 2013, 25, 3549 CrossRef PubMed.
- V. R. Muzykantov, Expert Opin. Drug Delivery, 2010, 7, 403–427 CrossRef PubMed.
- N. K. Lekha, J. Sankar, N. S. Asha and K. G. Vinod, Int. J. Nanomed., 2011, 6, 1685 Search PubMed.
- P. Verderio, P. Bonetti, M. Colombo, L. Pandolfi and D. Prosperi, Biomacromolecules, 2013, 14, 672 CrossRef PubMed.
- Z. Zheng, Z. Qiao, R. Gong, Y. Wang, Y. Zhang, Y. Ma, L. Zhang, Y. Lu, B. Jiang and G. Li, Oncol. Rep., 2016, 35, 1213 CrossRef PubMed.
Footnote |
| † These authors contributed equally to this work. |
|
| This journal is © The Royal Society of Chemistry 2018 |
Click here to see how this site uses Cookies. View our privacy policy here. 
 Open Access Article
 This Open Access Article is licensed under a Creative Commons Attribution-Non Commercial 3.0 Unported Licence
 a,
Geyi Liu†a,
Yumei Lian†a,
Zul Kamalab,
Xiao Quea,
Yujiao Qiuc and
Mingfeng Qiu*a
a,
Geyi Liu†a,
Yumei Lian†a,
Zul Kamalab,
Xiao Quea,
Yujiao Qiuc and
Mingfeng Qiu*a