 Open Access Article
Solvent-tuned charge-transfer properties of chiral Pt(II) complex and TCNQ˙− anion adducts†
Xiao-Peng Zhang *,
Li-Li Wang,
Da-Shuai Zhang,
Xiao-Wei Qi,
Zai-Feng Shi* and
Qiang Lin
Key Laboratory of Water Pollution Treatment & Resource Reuse of Hainan Province, College of Chemistry and Chemical Engineering, Hainan Normal University, Haikou 571158, People's Republic of China. E-mail: zxp_inorganic@126.com; zaifengshi_hnnu@sina.com; Tel: +86-898-65889422
First published on 16th March 2018
Abstract
A new pair of adducts comprising one chiral Pt(II) complex cation, [Pt((−)-L1)(Dmpi)]+ ((−)-1) or [Pt((+)-L1)(Dmpi)]+ ((+)-1) [(−)-L1 = (−)-4,5-pinene-6′-phenyl-2,2′-bipyridine, (+)-L1 = (+)-4,5-pinene-6′-phenyl-2,2′-bipyridine, Dmpi = 2,6-dimethylphenylisocyanide], together with one TCNQ˙− anion have been obtained, and the structures have been confirmed via single-crystal X-ray crystallography and infrared (IR) spectroscopy. The chiral Pt(II) cation and TCNQ˙− anion are dissociated in MeOH solution, while charge transfer adducts are formed in H2O solution, leading to perturbation of the electronic structure and alteration of the chiral environment, as evidenced by the differences in the UV-vis absorption and electronic circular dichroism spectra. The solvent-tuned charge-transfer properties also have been validated through emission and resonance light scattering spectra. The interesting findings may have potential applications in the development of black absorbers and wide band gap semiconductors.
1. Introduction
Square-planar platinum(II) complexes have been the subject of intensive research due to their great potential in the exploration of novel molecular materials and advanced electronic devices.1–6 Under special environmental stimuli, square-planar molecules are expected to form supramolecular aggregates through extended *intermolecular interactions, e.g. Pt⋯Pt and π–π contacts.7–14 In most cases, variances in color, luminescence, viscosity and morphology accompany stimuli–responsive processes, with aggregates showing intriguing solvatochromism,15,16 vapochromism,17–19 mechanochromism20–22 and thermochromism23. With regards to solvatochromism, the assembled structures can be tuned through the solvent composition, and remarkable changes in UV-vis absorption and emission characteristics can be induced through the variation of solvents.24 Additionally, helical assemblies of Pt(II) complexes can be formed in solution with the introduction of optically pure groups, correspondingly leading to interesting on–off switching of chiral signals.25–30 It is suggested that these above-mentioned stimuli-induced switches can be harnessed to develop versatile sensors to detect subtle environmental changes.31–347,7,8,8-Tetracyanoquinodimethane (TCNQ) has been widely investigated as a good electron acceptor due to its high electron affinity. As a classical example, TCNQ can form a charge transfer (CT) complex with an electron acceptor, showing unique conducting and magnetic properties with high charge density.35–37 More importantly, the open shell electron radical TCNQ˙− anion can be readily formed through one electron reduction, and versatile CT complexes can be assembled via the combination of TCNQ˙− with a large number of cations (metal ions, organic cations and organometallic complexes).38–42 Compared to TCNQ, these CT materials based on TCNQ˙− are endowed with higher conductivity, even superconductivity, due to a low band gap, offering promise for the development of the semiconductor industry.38,39,43 Moreover, ion-, vapor-, mechano-, and photo-induced multi-dimensional switches have been reported, and different conformations, alternating stackings and intermolecular CT capabilities can be modulated under specific stimuli.44–46
In general, the TCNQ˙− anion interacts with other cations to form CT adducts through π–π and hydrogen-bonding interactions; CT adducts containing Pt(II) complexes and TCNQ˙− would be of special interest because effective Pt–π contacts may be found, therefore leading to more interesting spectroscopic, magnetic and conductive properties.47 Due to intensive charge transfer interactions between Pt(II) complexes and TCNQ˙−, their adducts exhibit continuous UV-vis-NIR absorptions spanning ca. 200–1500 nm, and the lowest energy absorption is a characteristic band from a donor/acceptor charge transfer transition that is absent in the absorption spectra of dissociated molecules of the donor or acceptor.47 Given their strong absorptions across the visible–NIR region, these adducts can serve as competitive candidates for black body absorbers, opening up potential applications in wide band gap semiconductors and solar cells.48
In previous work, we have investigated vapor-, solvent-, mechano-, redox- and temperature-induced structural and spectroscopic switches involving chiral square-planar Pt(II) complexes.49–54 Among the Pt(II) complexes reported by us, the cationic complexes [Pt((−)-L1)(Dmpi)]+ ((−)-1) and [Pt((+)-L1)(Dmpi)]+ ((+)-1), [(−)-L1 = (−)-4,5-pinene-6′-phenyl-2,2′-bipyridine, (+)-L1 = (+)-4,5-pinene-6′-phenyl-2,2′-bipyridine, Dmpi = 2,6-dimethylphenylisocyanide] have good solubility in both MeOH and H2O solution, and show distinct aggregate behavior in different solvents.50 In addition, through varying the counteranions, more pronounced mechanochromic luminescence can be induced.51 In view of the above-mentioned interesting phenomena with respect to the (−)-1 and (+)-1 cations, we envisage that replacing the “spectroscopically innocent” Cl− counterions with the stable organic radical TCNQ˙− would give versatile CT behavior in different solvents. Therefore, as an extension of previous work, a pair of chiral CT complexes, (−)-1-TCNQ and (+)-1-TCNQ, have been facilely prepared (Chart 1), and the structures of the adducts have been confirmed via X-ray analysis. Solvent-induced variances in absorption, luminescence and chiral spectra have been thoroughly investigated.
2. Experimental section
2.1 General methods
All reagents were purchased from commercial suppliers and used as received. The IR spectra were recorded using a Thermo Scientific Nicolet 6700 Fourier transform infrared spectrometer as KBr pellets. UV-vis spectra were recorded on a UV-3600 spectrophotometer. The powder XRD patterns were recorded on a Shimadzu XD-3A X-ray diffractometer. Elemental analysis was performed on a Perkin-Elmer 240C analyzer. EPR spectra were obtained using an EMX-10/12 electron paramagnetic resonance spectrometer. Photoluminescence (PL) spectra were recorded using a Hitachi F-4600 PL spectrophotometer (λex = 420 nm). The resonance light scattering (RLS) spectra were obtained through synchronously scanning the excitation and emission monochromators (namely, Δλ = 0.0 nm) of a Hitachi F-4600 fluorescence spectrophotometer over the wavelength region from 300 to 820 nm (using a 10 mm quartz cell for a concentration of 10−5 mol L−1). The electronic circular dichroism (ECD) spectra in MeOH and H2O solutions were recorded on a Jasco J-810 spectropolarimeter (using a 10 mm quartz cell for a concentration of 5 × 10⁻⁵ mol L−1).2.2 Synthesis
According to the previous method,50,51 the cationic complexes (−)-1 and (+)-1 were prepared via a simple ligand metathesis reaction between the corresponding cyclometalated platinum(II) chloride precursor and 2,6-dimethylphenylisocyanide. The preparation of solid powders of (−)-1-TCNQ and (+)-1-TCNQ was achieved via the slow interfacial diffusion of equal amounts of (−)-1/(+)-1 and LiTCNQ in MeOH or H2O solution at 278 K. The solution of LiTCNQ was placed at the bottom of a tube, and the corresponding solution of (−)-1/(+)-1 was placed at the top of the tube. The solids were obtained via filtration. IR (KBr, cm−1): 716, 733, 749, 766, 815, 823, 835, 985, 1174, 1280, 1324, 1360, 1430, 1470, 1501, 1570, 1603, 2174, 2928, and 3438 (broad). Anal. calcd for C44H34N7Pt ((−)-1-TCNQ): C, 61.75; H, 4.00; N, 11.46%. Found: C, 61.78; H, 4.02; N, 11.45%.2.3 X-ray structure determination
Single-crystal X-ray diffraction measurements were carried out on a Bruker SMART APEX CCD based on a diffractometer operating at room temperature. Intensities were collected with graphite monochromatized Mo Kα radiation (λ = 0.71073 Å), operating at 50 kV and 30 mA, and using the ω/2θ scan mode. Data reduction was made with the Bruker SAINT package.55 Absorption corrections were performed using the SADABS program.56 The structures were solved by direct methods and refined based on F2, via full-matrix least-squares, using SHELXL-97 with anisotropic displacement parameters for all non-hydrogen atoms in both structures. Hydrogen atoms bonded to carbon atoms were placed in calculated positions and refined in riding mode, with C–H = 0.93 Å (methane) or 0.96 Å (methyl), and Uiso(H) = 1.2Ueq (Cmethane) or Uiso(H) = 1.5Ueq (Cmethyl). The H2O hydrogen atoms were located in the difference Fourier maps and refined with an O–H distance restraint [0.85(1) Å] and Uiso(H) = 1.5 Ueq(O). All computations were carried out using the SHELXTL-97 program package.57 CCDC 1823177 contains the supplementary crystallographic data for this paper.3. Results and discussion
3.1 Synthesis and characterization
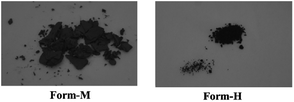
Adduct solids with different morphologies were prepared through slow diffusion at the interface of (−)-1/(+)-1 and LiTCNQ solutions. Deep-green powder (Form-M) is obtained in MeOH, while the solid (Form-H) formed in H2O (Fig. 1) appears black blue. Despite the difference in color, both adduct solids are non-emissive at room temperature and exhibit similar IR spectra with strong absorption at 2177 cm−1, ascribed to C![[triple bond, length as m-dash]](https://www.rsc.org/images/entities/char_e002.gif) N stretching vibrations (Fig. S1†), which is the characteristic absorption of the TCNQ˙− anion.38–42,47 Additionally, EPR spectra have been measured, and the g-factors of Form-M (g = 2.003) and Form-H (g = 2.004) are almost the same (Fig. S2†), which is attributed to the unpaired electron of the TCNQ˙− radical anion.58
N stretching vibrations (Fig. S1†), which is the characteristic absorption of the TCNQ˙− anion.38–42,47 Additionally, EPR spectra have been measured, and the g-factors of Form-M (g = 2.003) and Form-H (g = 2.004) are almost the same (Fig. S2†), which is attributed to the unpaired electron of the TCNQ˙− radical anion.58
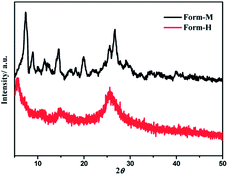
The UV-vis absorption spectra of the two solid-state species have been studied (Fig. S3†), and both solids show strong absorptions throughout the visible and into the NIR range. In contrast to Form-M, the absorption of Form-H extends to a longer wavelength, and a broad low-energy band centered at ca. 1280 nm can be unambiguously observed. It can be speculated that the molecules are packed more closely in Form-H than in Form-M, therefore they induce a stronger donor-to-acceptor charge transfer interaction and result in further absorption into the near-IR region.47,48 Other than the differences in color and absorption, a distinct difference in the degree of crystallinity is observed between the two solid species (Fig. 2). Form-M reveals intense and narrow peaks, while the XRD pattern becomes broad and weak in Form-H. Polymorphic phenomena are frequently found in square-planar platinum complexes due to the diversity in molecular arrangement achieved by varying intermolecular Pt⋯Pt and/or π–π interactions. The lower crystallinity is indicative of aggregate formation in the solid state.51
3.2 Crystal structure
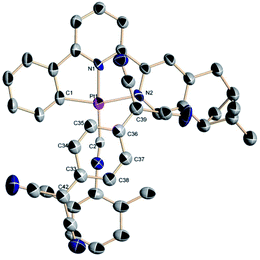
Numerous attempts to grow (−)-1-TCNQ or (+)-1-TCNQ crystals have been unsuccessful, however, deep-green needles of racemic crystals (−)-1/(+)-1-TCNQ can luckily be obtained through slow interfacial diffusion at 278 K in a test tube, where an MeOH solution of LiTCNQ is placed at the bottom, and acetonitrile solution containing equal amounts of (+)-1 and (−)-1 is placed at the top. The binary cocrystal crystallizes in the space group P21/c of a monoclinic system with one Pt(II) complex cation and one TCNQ˙− anion in an asymmetric unit (Table 1 and Fig. 3).| (−)-1/(+)-1-TCNQ | |
|---|---|
| Formula | PtC44H34N7 |
| Mr/g mol−1 | 855.87 |
| Crystal system | Monoclinic |
| Space group | P21/c |
| a/Å | 7.809(7) |
| b/Å | 19.125(18) |
| c/Å | 24.66(2) |
| α/° | 90.00 |
| β/° | 90.42 |
| γ/° | 90.00 |
| V/Å−3 | 3683(6) |
| Z | 4 |
| T/K | 296(2) |
| Radiation, λ/Å | 0.71073 |
| Dcalcd, g cm−3 | 1.543 |
| μ/mm−1 | 3.851 |
| F(000) | 1700 |
| Crystal size/mm3 | 0.30 × 0.15 × 0.12 |
| θ range/° | 1.35 to 25.00 |
| Reflections measured | 20![[thin space (1/6-em)]](https://www.rsc.org/images/entities/char_2009.gif) 076 076 |
| Unique reflections | 6495 |
| Rint | 0.1396 |
| Reflections with F2 > 2σ(F2) | 3460 |
| Number of parameters | 474 |
| Goodness-of-fit on F2 | 1.082 |
| R1 [F2 > 2σ(F2)] | 0.1037 |
| wR2 (all data) | 0.2525 |
| Δρmax, Δρmin/e Å−3 | 1.501, −1.476 |
| refine_ls_shift/su_max | 0.000 |
| refine_ls_shift/su_mean | 0.000 |
Selected bond distances and angles are compiled in Table 2. For the Pt(II) complex in the adduct, the Pt–C distances are 1.989(12) and 1.912(9) Å, which are similar to those of Pt(C^N^N)(Dmpi) derivatives (1.86 to 2.09 Å).50,51 The Pt–N bond lengths (1.917(9) and 2.100(8) Å) reside in the range of 1.88–2.14 Å. For the TCNQ˙− anion in the two-component cocrystal, the exocyclic C![[double bond, length as m-dash]](https://www.rsc.org/images/entities/char_e001.gif) C bond lengths are 1.429(17) and 1.359(18) Å, while the intracyclic C
C bond lengths are 1.429(17) and 1.359(18) Å, while the intracyclic C![[double bond, length as m-dash]](https://www.rsc.org/images/entities/char_e001.gif) C distances are 1.320(16) and 1.319(17) Å, which are similar to those found in analogous CT complexes involved the TCNQ˙− radical anion.47,48,59–62 Only one exocyclic C
C distances are 1.320(16) and 1.319(17) Å, which are similar to those found in analogous CT complexes involved the TCNQ˙− radical anion.47,48,59–62 Only one exocyclic C![[double bond, length as m-dash]](https://www.rsc.org/images/entities/char_e001.gif) C bond is longer than the corresponding distance of 1.37 Å in neutral species and is comparable with the 1.44 Å indicative of a radical anion. The elongation in the exocyclic C
C bond is longer than the corresponding distance of 1.37 Å in neutral species and is comparable with the 1.44 Å indicative of a radical anion. The elongation in the exocyclic C![[double bond, length as m-dash]](https://www.rsc.org/images/entities/char_e001.gif) C bond is interpreted through the presence of negative charge. The angles are also similar to those reported for Pt(II) complexes.50,51 The interchelate C1–Pt1–N2 angle (161.4(4)°) deviates substantially from 180° as a result of terdentate-bonding ring strain. And the N1–Pt1–C2 angle (177.2(4)°) is close to linearity. In our previous studies, the moiety of 2,6-dimethylphenyl isocyanide is almost coplanar with the Pt(C^N^N) unit,50,51 however, a larger torsion angle between these two planes is exhibited in the (−)-1/(+)-1-TCNQ cocrystal (Fig. S4†).
C bond is interpreted through the presence of negative charge. The angles are also similar to those reported for Pt(II) complexes.50,51 The interchelate C1–Pt1–N2 angle (161.4(4)°) deviates substantially from 180° as a result of terdentate-bonding ring strain. And the N1–Pt1–C2 angle (177.2(4)°) is close to linearity. In our previous studies, the moiety of 2,6-dimethylphenyl isocyanide is almost coplanar with the Pt(C^N^N) unit,50,51 however, a larger torsion angle between these two planes is exhibited in the (−)-1/(+)-1-TCNQ cocrystal (Fig. S4†).
| Bond length | Bond angle | ||
|---|---|---|---|
| Pt1–C1 | 1.989(12) | C1–Pt1–C2 | 99.7(4) |
| Pt1–C2 | 1.912(9) | C1–Pt1–N1 | 82.9(4) |
| Pt1–N1 | 1.917(9) | C1–Pt1–N2 | 161.4(4) |
| Pt1–N2 | 2.100(8) | C2–Pt1–N1 | 177.2(4) |
| C36–C39 | 1.429(17) | C2–Pt1–N2 | 98.8(4) |
| C34–C35 | 1.320(16) | N1–Pt1–N2 | 78.7(4) |
| C37–C38 | 1.319(17) | ||
| C33–C42 | 1.359(18) | ||
A crystal packing diagram of the cocrystal along the a-axis is presented in Fig. 4. The TCNQ˙− anion and Pt(II) complex cation form one-dimensional chains in a 1![[thin space (1/6-em)]](https://www.rsc.org/images/entities/char_2009.gif) :
:![[thin space (1/6-em)]](https://www.rsc.org/images/entities/char_2009.gif) 1 pattern, adopting a face-to-face arrangement. The interplanar separations (Pt–π) of alternating (−)-1 cations and TCNQ˙− moieties are 3.637(3) Å and 4.263(4) Å. According to previous studies, interplanar distances between donor and acceptor molecules within 3.75 Å are in the range reported for π–π, d–π, and electrostatic donor–acceptor interactions, therefore it can be inferred that weak charge-transfer (donor–acceptor) interactions are present in the cocrystal.47,48,59,60 Moreover, in the bc plane, neighboring columns of (−)-1-TCNQ/(+)-1-TCNQ CT adducts are stacked alternately (Fig. S5†).
1 pattern, adopting a face-to-face arrangement. The interplanar separations (Pt–π) of alternating (−)-1 cations and TCNQ˙− moieties are 3.637(3) Å and 4.263(4) Å. According to previous studies, interplanar distances between donor and acceptor molecules within 3.75 Å are in the range reported for π–π, d–π, and electrostatic donor–acceptor interactions, therefore it can be inferred that weak charge-transfer (donor–acceptor) interactions are present in the cocrystal.47,48,59,60 Moreover, in the bc plane, neighboring columns of (−)-1-TCNQ/(+)-1-TCNQ CT adducts are stacked alternately (Fig. S5†).
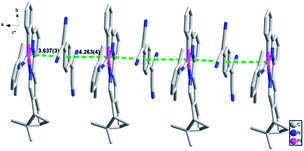 | ||
| Fig. 4 A crystal packing diagram of (−)-1/(+)-1-TCNQ along the a-axis with green dashed lines indicating Pt⋯π interactions. | ||
3.3 Absorption and emission properties
In the above studies, (−)-1/(+)-1 cations and TCNQ˙− anions can form CT adducts, as evidenced by the crystal structure; also, the powders with different colors obtained in MeOH and H2O suggest that the solvent is essential in inducing polymorphism with variable CT properties.63,64 The solvent-tuned spectroscopic variances in (−)-1-TCNQ will be investigated in the following discussion. The parent compound (−)-1 is reported to show characteristic intraligand (IL) transitions (ε > 104 L mol−1 cm−1) in the region of 200–310 nm, and metal-to-ligand charge transfer (MLCT) mixed with ligand-to-ligand charge transfer (LLCT) transitions (ε > 103 L mol−1 cm−1) in the region of 330–450 nm in MeOH solution (Fig. 5).50 And the TCNQ˙− anion presents a series of pronounced absorption bands in the low-energy region (600–900 nm) and a peak centered at ca. 418 nm in the visible range, which is in line with the reported electronic excitation spectrum of the TCNQ˙− anion, and agrees well with previous interpretations of the calculated excitation energies.47,48,65,66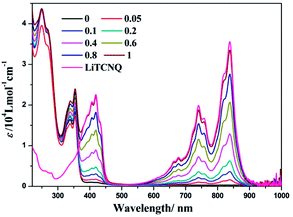 | ||
| Fig. 5 UV-vis spectra of LiTCNQ and the complex (−)-1 after the addition of LiTCNQ at various ratios in MeOH. | ||
During a titration experiment, LiTCNQ at various ratios is added to a MeOH solution of (−)-1 (Fig. 5). It can be observed that no new absorption bands appear. Moreover, when the mole ratio reaches 1![[thin space (1/6-em)]](https://www.rsc.org/images/entities/char_2009.gif) :
:![[thin space (1/6-em)]](https://www.rsc.org/images/entities/char_2009.gif) 1, the low-energy absorptions ranging from 600 to 900 nm with regards to the TCNQ˙− anion and the high-energy absorptions ranging from 220 to 350 nm mainly relating to parent compound (−)-1 are almost identical to the individual absorption spectra of the Pt(II) complex cation and TCNQ˙− anion. Therefore, any bound complex between the parent compound (−)-1 cation and TCNQ˙− anion has not been formed in MeOH solution, and they are dissociated and hardly perturb the electronic structures of each other.
1, the low-energy absorptions ranging from 600 to 900 nm with regards to the TCNQ˙− anion and the high-energy absorptions ranging from 220 to 350 nm mainly relating to parent compound (−)-1 are almost identical to the individual absorption spectra of the Pt(II) complex cation and TCNQ˙− anion. Therefore, any bound complex between the parent compound (−)-1 cation and TCNQ˙− anion has not been formed in MeOH solution, and they are dissociated and hardly perturb the electronic structures of each other.
Our previous studies showed that (−)-1 and (+)-1 could aggregate into one dimensional supramolecular structures through Pt⋯Pt, π–π, and hydrophobic–hydrophobic interactions in aqueous solution.50 Interestingly, when LiTCNQ is added to a H2O solution of (−)-1, three new bands at 623, 756 and 860 nm emerge and are strengthened progressively with the incremental addition of LiTCNQ (Fig. 6). In addition, the absorption band at 335 nm of the parent compound (−)-1 is red-shifted to 357 nm upon introducing an equal proportion of TCNQ˙− anion. Compared to the individual absorption spectra of (−)-1 and TCNQ˙− in H2O, the spectrum of the (−)-1-TCNQ adduct is not a mixture of the UV-vis spectra of each component. For the lowest energy absorption, the peak at 830 nm from the TCNQ˙− anion is red-shifted to 860 nm and, simultaneously, the extinction coefficient is attenuated. CT adducts between the parent compound (−)-1 cation and TCNQ˙− anion in H2O have been generated through effective intermolecular interactions, e.g. Pt–π and π–π, and then the electronic structures are significantly perturbed by each other, leading to different transitions and UV-vis spectra.47,48 According to computational studies in the literature, the HOMO is localized on the chiral Pt(II) compound (−)-1, while the LUMO is distributed on the TCNQ˙− anion, so the CT band observed at 860 nm is tentatively assigned to a charge transfer transition from the Pt(II) complex cation to the TCNQ˙− anion.65,66
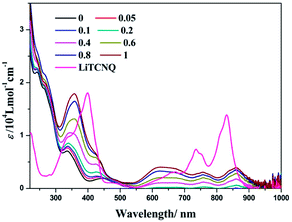 | ||
| Fig. 6 UV-vis spectra of LiTCNQ and the complex (−)-1 after the addition of LiTCNQ at various ratios in H2O. | ||
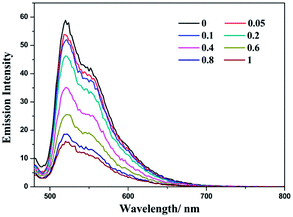
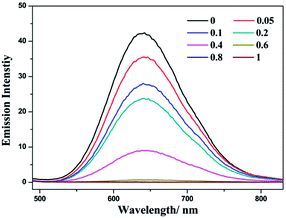
Complex (−)-1 is emissive in both MeOH and H2O solution. During the addition of LiTCNQ, different attenuation rates of emission intensity have been observed. In MeOH, the emission intensity is weakened gradually with the incremental addition of LiTCNQ, and the emission can be detected unambiguously even when the mole ratio attains a value of 1![[thin space (1/6-em)]](https://www.rsc.org/images/entities/char_2009.gif) :
:![[thin space (1/6-em)]](https://www.rsc.org/images/entities/char_2009.gif) 1 (Fig. 7). However, the emission intensity is attenuated sharply in H2O solution, and luminescence can be neglected when the mole ratio is 0.6 (Fig. 8). This result is consistent with the absorption spectra, where the (−)-1 cation and TCNQ˙− anion are almost disassociated in MeOH and strongly interact with each other in H2O. As a consequence, the emission decay in MeOH is attributed to weak energy transfer between the (−)-1 cation and TCNQ˙− anion,67 while luminescence quenching in H2O is mainly due to strong charge transfer and energy transfer.47,48
1 (Fig. 7). However, the emission intensity is attenuated sharply in H2O solution, and luminescence can be neglected when the mole ratio is 0.6 (Fig. 8). This result is consistent with the absorption spectra, where the (−)-1 cation and TCNQ˙− anion are almost disassociated in MeOH and strongly interact with each other in H2O. As a consequence, the emission decay in MeOH is attributed to weak energy transfer between the (−)-1 cation and TCNQ˙− anion,67 while luminescence quenching in H2O is mainly due to strong charge transfer and energy transfer.47,48
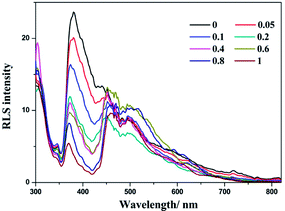
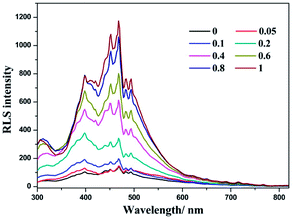
The solvent-induced difference between forming CT adducts in MeOH and H2O has been further evidenced using resonance light scattering (RLS) spectra. In MeOH solution, the RLS intensity is not enhanced distinctly upon the addition of LiTCNQ (Fig. 9). To the contrary, the intensity of the RLS signal over the range of 300 to 600 nm is significantly strengthened upon adding LiTCNQ in H2O solution (Fig. 10), and shows a 10-fold increase when the mole ratio is 1![[thin space (1/6-em)]](https://www.rsc.org/images/entities/char_2009.gif) :
:![[thin space (1/6-em)]](https://www.rsc.org/images/entities/char_2009.gif) 1, implying the formation of CT adducts in solution and therefore that the chromophores are strongly coupled.50,68–70
1, implying the formation of CT adducts in solution and therefore that the chromophores are strongly coupled.50,68–70
3.4 Electronic circular dichroism (ECD) spectra
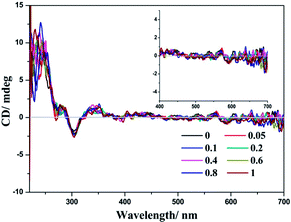
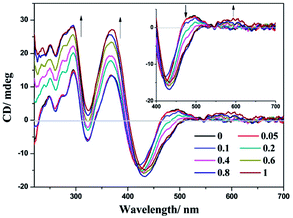
The chiral environment of (−)-1 after the addition of LiTCNQ has been explored in MeOH and H2O solutions through recording the electronic circular dichroism (ECD) spectra. Upon the introduction of LiTCNQ in MeOH solution, the chiral signal of (−)-1 remains unchanged, showing positive Cotton effects at 240, 284 and 346 nm and negative Cotton effects at 303 nm (Fig. 11). In H2O solution, molecules of (−)-1 and (+)-1 could form helical packing structures and present enhanced chiral signals (positive Cotton effects: 250, 300, 370 and 480 nm; negative Cotton effects: 320 and 420 nm). After adding LiTCNQ to a H2O solution of (−)-1, significant variance in Cotton effects can be observed, which suggests the emergence of chiral transfer in H2O solution (Fig. 12).71,72 The positive Cotton effects at 300 and 370 grow progressively more intense. When the mole ratio reaches 1![[thin space (1/6-em)]](https://www.rsc.org/images/entities/char_2009.gif) :
:![[thin space (1/6-em)]](https://www.rsc.org/images/entities/char_2009.gif) 1, the negative peak at 320 nm and the positive peak at 480 nm vanish, and the negative Cotton effect at 420 nm is red-shifted to 433 nm. Furthermore, a new positive Cotton effect at 600 nm can be perceived (Fig. 12). The difference in ECD spectra is in accordance with the solvent-induced absorption properties, as shown in Fig. 5 and 6.
1, the negative peak at 320 nm and the positive peak at 480 nm vanish, and the negative Cotton effect at 420 nm is red-shifted to 433 nm. Furthermore, a new positive Cotton effect at 600 nm can be perceived (Fig. 12). The difference in ECD spectra is in accordance with the solvent-induced absorption properties, as shown in Fig. 5 and 6.
To check whether any artifacts have been introduced into the spectra, the ECD signals of enantiomers (+)-1 and (+)-1-TCNQ have been measured under the same conditions, and perfect mirror images of each other are exhibited (Fig. S6 and S7†). Generally, Pt(II) complexes undergo chiral amplification and chiral transfer through self-assembly into chiral supramolecular aggregates or through varying the configuration around the metal center.49–54 Several examples show that adding chiral acceptors or donors can also amplify the chiral signal.73 The (−)-1 cation and TCNQ˙− anion can form CT adducts in H2O via Pt–π, π–π and electrostatic interactions, and the presence of the organic acceptor TCNQ˙− anion would influence the geometry, perturb the electronic structure and alter the chiral environment, owing to strong intermolecular interactions. Therefore, charge transfer and chiral transfer phenomena occur in H2O solution, while the (−)-1 cation and TCNQ˙− anion are not likely to significantly perturb each other in MeOH solution.
4. Conclusions
We succeeded in the preparation and characterization of a new pair of adducts involving one chiral Pt(II) complex cation and one TCNQ˙− anion. The charge-transfer properties as well as the chiral signals of the adducts can be tuned via the solvent. In MeOH, the Pt(II) complex cation and TCNQ˙− anion are non-interacting, and the UV-vis spectrum of the (−)-1-TCNQ adduct is just a mixture of individual absorption bands. In addition, the chiral signals in MeOH solution are completely derived from the chiral Pt(II) complex cation. However, CT aggregates between the parent compound (−)-1 cation and TCNQ˙− anion have been formed in H2O solution through effective intermolecular interactions (Pt–π, π–π and electrostatic attraction), and their electronic structures and chiral environments have been significantly influenced, leading to different transitions in UV-vis spectra and diverse Cotton effects in ECD spectra. Furthermore, the exploration of the emission and RLS spectra also affirms the formation of strongly interacting CT adducts in H2O solution. The results can provide some guidance for fabricating semiconductor devices and solar cells based on charge transfer salts.Conflicts of interest
There are no conflicts to declare.Acknowledgements
This work is supported by the National Natural Science Foundation of China (Grant No. 21601043), and the Natural Science Foundation of Hainan Province (20162026, 217100, 217101, ZDYF2017011 and 2017CXTD007).Notes and references
- X. Wang and Z. Guo, Chem. Soc. Rev., 2013, 42, 202–224 RSC.
- V. W.-W. Yam, V. K.-M. Au and S. Y.-L. Leung, Chem. Rev., 2015, 115, 7589–7728 CrossRef CAS PubMed.
- J. R. Brandt, X. Wang, Y. Yang, A. J. Campbell and M. J. Fuchter, J. Am. Chem. Soc., 2016, 138, 9743–9746 CrossRef CAS PubMed.
- K. T. Ly, R.-W. Chen-Cheng, H.-W. Lin, Y.-J. Shiau, S.-H. Liu, P.-T. Chou, C.-S. Tsao, Y.-C. Huang and Y. Chi, Nat. Photonics, 2017, 11, 63–68 CrossRef.
- T. Fleetham, G. Li and J. Li, Adv. Mater., 2017, 29, 1601861 CrossRef PubMed.
- S. Carrara, A. Aliprandi, C. F. Hogan and L. De Cola, J. Am. Chem. Soc., 2017, 139, 14605–14610 CrossRef CAS PubMed.
- Y. Sagara and T. Kato, Nat. Chem., 2009, 1, 605–610 CrossRef CAS PubMed.
- O. S. Wenger, Chem. Rev., 2013, 113, 3686–3733 CrossRef CAS PubMed.
- X. Zhang, Z. Chi, Y. Zhang, S. Liu and J. Xu, J. Mater. Chem. C, 2013, 1, 3376–3390 RSC.
- A. Aliprandi, D. Genovese, M. Mauro and L. De Cola, Chem. Lett., 2015, 44, 1152–1169 CrossRef CAS.
- Y. Sagara, S. Yamane, M. Mitani, C. Weder and T. Kato, Adv. Mater., 2016, 28, 1073–1095 CrossRef CAS PubMed.
- J. Moussa, K. M.-C. Wong, X. F. L. Goff, M. N. Rager, C. K.-M. Chan, V. W.-W. Yam and H. Amouri, Organometallics, 2013, 32, 4985–4992 CrossRef CAS.
- J. Moussa, K. Haddouche, L.-M. Chamoreau, H. Amouri and J. A. G. Williams, Dalton Trans., 2016, 45, 12644–12648 RSC.
- H. Sesolis, C. K.-M. Chan, G. Gontard, H. L.-K. Fu, V. W.-W. Yam and H. Amouri, Organometallics, 2017, 36, 4794–4801 CrossRef CAS.
- W. Lu, Y. Chen, V. A. L. Roy, S. S.-Y. Chui and C.-M. Che, Angew. Chem., Int. Ed., 2009, 48, 7621–7625 CrossRef CAS PubMed.
- C.-H. Wong, C. Po, S. Y.-L. Leung, A. K.-W. Chan, S. Yang, B. Zhu, X. Cui and V. W.-W. Yam, J. Am. Chem. Soc., 2018, 140, 657–666 CrossRef PubMed.
- J. Ni, X. Zhang, Y.-H. Wu, L.-Y. Zhang and Z.-N. Chen, Chem.–Eur. J., 2011, 17, 1171–1183 CrossRef CAS PubMed.
- M. J. Bryant, J. M. Skelton, L. E. Hatcher, C. Stubbs, E. Madrid, A. R. Pallipurath, L. H. Thomas, C. H. Woodall, J. Christensen, S. Fuertes, T. P. Robinson, C. M. Beavers, S. J. Teat, M. R. Warren, F. Pradaux-Caggiano, A. Walsh, F. Marken, D. R. Carbery, S. C. Parker, N. B. McKeown, R. Malpass-Evans, M. Carta and P. R. Raithby, Nat. Commun., 2017, 8, 1800 CrossRef CAS PubMed.
- A. Kobayashi, N. Yamamoto, Y. Shigeta, M. Yoshida and M. Kato, Dalton Trans., 2018, 47, 1548–1556 RSC.
- M. Krikorian, S. Liu and T. M. Swager, J. Am. Chem. Soc., 2014, 136, 2952–2955 CrossRef CAS PubMed.
- S. S. Pasha, P. Alam, A. Sarmah, R. K. Roy and I. R. Laskar, RSC Adv., 2016, 6, 87791–87795 RSC.
- A. F. Henwood, J. Webster, D. Cordes, A. M. Z. Slawin, D. Jacquemin and E. Zysman-Colman, RSC Adv., 2017, 7, 25566–25574 RSC.
- M. H.-Y. Chan, M. Ng, S. Y.-L. Leung, W. H. Lam and V. W.-W. Yam, J. Am. Chem. Soc., 2017, 139, 8639–8645 CrossRef CAS PubMed.
- K. M. C. Wong and V. W. W. Yam, Acc. Chem. Res., 2011, 44, 424–434 CrossRef CAS PubMed.
- T. Ikeda, M. Takayama, J. Kumar, T. Kawai and T. Haino, Dalton Trans., 2015, 44, 13156–13162 RSC.
- H. L.-K. Fu, C. Po, H. He, S. Y.-L. Leung, K. S. Wong and V. W.-W. Yam, Chem.–Eur. J., 2016, 22, 1–12 CrossRef.
- S. Tanaka, K. Sato, K. Ichida, T. Abe, T. Tsubomura, T. Suzuki and K. Shinozaki, Chem.–Asian J., 2016, 11, 265–273 CrossRef CAS PubMed.
- A. Aliprandi, C. M. Croisetu, M. Mauro and L. De Cola, Chem.–Eur. J., 2017, 23, 1–6 CrossRef PubMed.
- T. Ikeda, K. Hirano and T. Haino, Mater. Chem. Front., 2018, 2, 468–474 RSC.
- H. Sesolis, J. Dubarle-Offner, C. K. M. Chan, E. Puig, G. Gontard, P. Winter, A. L. Cooksy, V. W. W. Yam and H. Amouri, Chem.–Eur. J., 2016, 22, 8032–8037 CrossRef CAS PubMed.
- M. Liu, L. Zhang and T. Wang, Chem. Rev., 2015, 115, 7304–7397 CrossRef CAS PubMed.
- J.-F. Mei, X.-Y. Jia, J.-C. Lai, Y. Sun, C.-H. Li, J.-H. Wu, Y. Cao, X.-Z. You and Z. Bao, Macromol. Rapid Commun., 2016, 37, 1667–1675 CrossRef CAS PubMed.
- A. Aliprandi, M. Mauro and L. De Cola, Nat. Chem., 2016, 8, 10–15 CrossRef CAS PubMed.
- L. Ravotto and P. Ceroni, Coord. Chem. Rev., 2017, 346, 62–76 CrossRef CAS.
- Y. Krupskaya, M. Gibertini, N. Marzari and A. F. Morpurgo, Adv. Mater., 2015, 27, 2453–2458 CrossRef CAS PubMed.
- K. Kang, S. Watanabe, K. Broch, A. Sepe, A. Brown, I. Nasrallah, M. Nikolka, Z. Fei, M. Heeney, D. Matsumoto, K. Marumoto, H. Tanaka, S.-i. Kuroda and H. Sirringhaus, Nat. Mater., 2016, 15, 896–902 CrossRef CAS PubMed.
- X. Zhang, Z.-X. Wang, H. Xie, M.-X. Li, T. J. Woods and K. R. Dunbar, Chem. Sci., 2016, 7, 1569–1574 RSC.
- L. Ballester, A. M. Gil, A. Gutiérrez, M. F. Perpiñán, M. T. Azcondo, A. E. Sánchez, C. Marzin, G. Tarrago and C. Bellitto, Chem.–Eur. J., 2002, 8, 2539–2548 CrossRef CAS.
- X. Qu, J. Lu, C. Zhao, J. F. Boas, B. Moubaraki, K. S. Murray, A. Siriwardana, A. M. Bond and L. L. Martin, Angew. Chem., 2011, 123, 1627–1630 CrossRef.
- R. Ramanathan, S. Walia, A. E. Kandjani, S. Balendran, M. Mohammadtaheri, S. K.Bhargava, K. Kalantar-zadeh and V. Bansal, Langmuir, 2015, 31, 1581–1587 CrossRef CAS PubMed.
- L. Sutton, B. F. Abrahams, D. M. D'Alessandro, T. A. Hudson, R. Robson and P. M. Usov, CrystEngComm, 2016, 18, 8906–8914 RSC.
- J. Kim, A. Silakov, H. P. Yennawar and B. J. Lear, Inorg. Chem., 2015, 54, 6072–6074 CrossRef CAS PubMed.
- A. P. O'Mullane, N. Fay, A. Nafady and A. M. Bond, J. Am. Chem. Soc., 2007, 129, 2066–2073 CrossRef PubMed.
- A. Nagai and Y. Okabeb, Chem. Commun., 2014, 50, 10052–10054 RSC.
- J. Jalkh, Y. R. Leroux, A. Vacher, D. Lorcy, P. Hapiot and C. Lagrost, J. Phys. Chem. C, 2016, 120, 28021–28030 CAS.
- C. Wang, N. Wu, D. L. Jacobs, M. Xu, X. Yang and L. Zang, Chem. Commun., 2017, 53, 1132–1135 RSC.
- W.-H. Chen, E. W. Reinheimer, K. R. Dunbar and M. A. Omary, Inorg. Chem., 2006, 45, 2770–2772 CrossRef CAS PubMed.
- C. rowning, J. M. Hudson, E. W. Reinheimer, F.-L. Kuo, R. N. McDougald Jr, H. Rabaâ, H. Pan, J. Bacsa, X. Wang, K. R. Dunbar, N. D. Shepherd and M. A. Omary, J. Am. Chem. Soc., 2014, 136, 16185–16200 CrossRef PubMed.
- X.-P. Zhang, T. Wu, J. Liu, J.-X. Zhang, C.-H. Li and X.-Z. You, J. Mater. Chem. C, 2014, 2, 184–194 RSC.
- X.-P. Zhang, V. Y. Chang, J. Liu, X.-L. Yang, W. Huang, Y. Li, C.-H. Li, G. Muller and X.-Z. You, Inorg. Chem., 2015, 54, 143–152 CrossRef CAS PubMed.
- X.-P. Zhang, J.-F. Mei, J.-C. Lai, C.-H. Li and X.-Z. You, J. Mater. Chem. C, 2015, 3, 2350–2357 RSC.
- X.-P. Zhang, L. Zhu, X. Wang, Z. Shi and Q. Lin, Inorg. Chim. Acta, 2016, 442, 56–63 CrossRef CAS.
- X.-P. Zhang, F.-Q. Liu, J.-C. Lai, C.-H. Li, A.-M. Li and X.-Z. You, New J. Chem., 2016, 40, 2628–2636 RSC.
- X.-P. Zhang, D.-S. Zhang, X.-W. Qi, L.-H. Zhu, X.-H. Wang, W. Sun, Z.-F. Shi and Q. Lin, Inorg. Chim. Acta, 2017, 467, 99–105 CrossRef CAS.
- SAINT-Plus, version 6.02, Bruker Analytical X-ray System, Madison, WI, 1999 Search PubMed.
- G. M. Sheldrick, SADABS, an empirical absorption correction program, Bruker Analytical X-ray Systems, Madison, WI, 1996 Search PubMed.
- G. M. Sheldrick, Acta Crystallogr., Sect. A: Cryst. Phys., Diffr., Theor. Gen. Crystallogr., 2008, 64, 112 CrossRef CAS PubMed.
- J.-Y. Zhang, L.-J. Su, Q.-J. Guo and J. Tao, Inorg. Chem. Commun., 2017, 82, 39–43 CrossRef CAS.
- B. W. Smucker, J. M. Hudson, M. A. Omary and K. R. Dunbar, Inorg. Chem., 2003, 42, 4714–4723 CrossRef CAS PubMed.
- S. Shibahara, H. Kitagawa, Y. Ozawa, K. Toriumi, T. Kubo and K. Nakasuji, Inorg. Chem., 2007, 46, 1162–1170 CrossRef CAS PubMed.
- S. Yang, F. Pop, C. Melan, A. C. Brooks, L. Martin, P. Horton, P. Auban-Senzier, G. L. J. A. Rikken, N. Avarvari and J. D. Wallis, CrystEngComm, 2014, 16, 3906–3916 RSC.
- M. A. Dobrowolski, G. Garbarino, M. Mezouar, A. Ciesielski and M. K. Cyrański, CrystEngComm, 2014, 16, 415–429 RSC.
- P. Hu, L. Ma, K. J. Tan, H. Jiang, F. Wei, C. Yu, K. P. Goetz, O. D. Jurchescu, L. E. McNeil, G. G. Gurzadyan and C. Kloc, Cryst. Growth Des., 2014, 14, 6376–6382 CAS.
- H. Sun, M. Wang, X. Wei, R. Zhang, S. Wang, A. Khan, R. Usman, Q. Feng, M. Du, F. Yu, W. Zhang and C. Xu, Cryst. Growth Des., 2015, 15, 4032–4038 CAS.
- T. R. Cundari, B. Chilukuri, J. M. Hudson, C. Minot, M. A. Omary and H. Rabaâ, Organometallics, 2010, 29, 795–800 CrossRef CAS.
- H. Rabaâ, S. Taubert and D. Sundholm, J. Phys. Chem. A, 2013, 117, 12363–12373 CrossRef PubMed.
- P. Du and R. Eisenberg, Chem. Sci., 2010, 1, 502–506 RSC.
- R. F. Pasternack and P. J. Collings, Science, 1995, 269, 935–939 CrossRef PubMed.
- H. Pan, X. Tao, C. Mao, J.-J. Zhu and F. Liang, Talanta, 2007, 71, 276–281 CrossRef CAS PubMed.
- S. Y.-L. Leung and V. W.-W. Yam, Chem. Sci., 2013, 4, 4228–4234 RSC.
- J. Crassous, Chem. Soc. Rev., 2009, 38, 830–845 RSC.
- M. Liu, L. Zhang and T. Wang, Chem. Rev., 2015, 115, 7304–7397 CrossRef CAS PubMed.
- J. Han, P. Duan, X. Li and M. Liu, J. Am. Chem. Soc., 2017, 139, 9783–9786 CrossRef CAS PubMed.
Footnote |
| † Electronic supplementary information (ESI) available. CCDC 1823177 ((−)-1/(+)-1-TCNQ). For ESI and crystallographic data in CIF or other electronic format see DOI: 10.1039/c8ra01330f |
| This journal is © The Royal Society of Chemistry 2018 |


