 Open Access Article
Study on the degradation mechanism and pathway of benzene dye intermediate 4-methoxy-2-nitroaniline via multiple methods in Fenton oxidation process
Ying Guoa,
Qiang Xue *a,
Kangping Cuib,
Jia Zhanga,
Hui Wanga,
Huanzhen Zhanga,
Fang Yuana and
Honghan Chen*a
aBeijing Key Laboratory of Water Resources and Environmental Engineering, School of Water Resources and Environment, China University of Geosciences, Beijing 100083, China. E-mail: xueqiang@cugb.edu.cn; chenhh@cugb.edu.cn; Tel: +86-10-82322281 Tel: +86-10-82323345
bSchool of Resources and Environmental Engineering, Hefei University of Technology, Hefei 230009, China
First published on 16th March 2018
Abstract
Benzene dye intermediate (BDI) 4-methoxy-2-nitroaniline (4M2NA) wastewater has caused significant environmental concern due to its strong toxicity and potential carcinogenic effects. Reports concerning the degradation of 4M2NA by advanced oxidation process are limited. In this study, 4M2NA degradation by Fenton oxidation has been studied to obtain more insights into the reaction mechanism involved in the oxidation of 4M2NA. Results showed that when the 4M2NA (100 mg L−1) was completely decomposed, the TOC removal efficiency was only 30.70–31.54%, suggesting that some by-products highly recalcitrant to the Fenton oxidation were produced. UV-Vis spectra analysis based on Gauss peak fitting, HPLC analysis combined with two-dimensional correlation spectroscopy and GC-MS detection were carried out to clarify the degradation mechanism and pathway of 4M2NA. A total of nineteen reaction intermediates were identified and two possible degradation pathways were illustrated. Theoretical TOC calculated based on the concentration of oxalic acid, acetic acid, formic acid, and 4M2NA in the degradation process was nearly 94.41–97.11% of the measured TOC, indicating that the oxalic acid, acetic acid and formic acid were the main products. Finally, the predominant degradation pathway was proposed. These results could provide significant information to better understand the degradation mechanism of 4M2NA.
1. Introduction
Benzene dye intermediates (BDIs) like 4-methoxy-2-nitroaniline (4M2NA) are important industrial chemicals and have a wide range of applications in the dye and pharmaceutical industries. Their production wastewater is often highly toxic, high in color, high in both substrate and salt concentrations, and does not degrade easily.1–3 Because of its highly toxic, carcinogenic, teratogenic and mutagenic hazards,4–6 BDI 4M2NA has been listed as a priority pollutant in many countries.7 In recent years, due to the illegal discharge and leakage in the production process,8 BDIs have been detected in many industrial parks and surrounding surface and underground water.9–11 According to the Pollution Events of Tengger Desert in China,12 a wide range of BDIs were detected with a concentration of up to 100–120 mg L−1 in both surface and underground water, which have threatened groundwater safety seriously. Therefore, it is greatly urgent to control the BDIs pollution in our environment.13,14In recent years, many methods, such as extraction,15,16 adsorption17 and biodegradation,18,19 have been used to decompose the wastewater of BDIs. Because of its stable structure and strong toxicity, BDIs wastewater is difficult to be effectively treated by conventional physicochemical and biochemical effects. In addition, these technologies have some disadvantages. For example, the extraction chemicals are also very toxic and expensive. Adsorption method is not cost effective, not easy to be regenerated and only move the pollutants from the water phase to absorbents, which is not a complete treatment method.6,20 Biodegradation is usually slower and with less shock resistant.21 Therefore, it is necessary to find a more effective way to treat the wastewater of BDIs.
Due to the properties of anti-biodegradation, anti-oxidation and anti-photolysis of BDIs,22 advanced oxidation technology (AOT) seems a suitable and promising treatment method.23,24 This is based on their strong oxidation performance and a wide range of applications of AOT.25–29 For AOT, electrochemical incineration,30 microwave radiation,5 photocatalysis,31,32 and other Fenton methods2,4 have been also used to treat BDIs wastewater effectively. However, the above methods have some limitations in practical application. Such as photocatalysis, the absorption range of commonly used ultraviolet light is narrow. Some suspended matter and deep chroma in printing and dyeing wastewater will affect the photocatalytic effect, and the electron–hole pair is easy to be recombined and inactivated.33 In contrast, Fenton advanced oxidation method has a great practical potential, due to its high efficiency, simple equipment, short reaction time, low additional energy and easy to operate, the Fenton oxidation process has been selected for the treatment of BDIs wastewater.34,35
During the Fenton reaction, the chain reaction between Fe2+ and H2O2 catalyzes the formation of hydroxyl radicals (˙OH) with strong oxidizing ability,36 which can oxidize many kinds of organic matters non-selectively and is especially good for the treatment of organic wastewater that is recalcitrant to biological treatment or general chemical oxidation.37,38
Therefore, in recent years, researchers have paid more attention to the use of various Fenton technologies for the treatment of BDIs, and study the mechanism and identify the degradation products. El-Ghenymy et al.4 have studied the use of electro-Fenton and solar photoelectro-Fenton technology for the treatment of sulfanilic acid solutions, optimized the processing parameters, and identified the intermediate products. Masomboon et al. have compared the characteristics and kinetics of oxidation degradation of 2,6-dimethylaniline by Fenton,39 electro-Fenton40 and photoelectro-Fenton process,41 and discussed the reaction mechanism and possible degradation intermediates. Shen J. et al.42 studied the Fenton technology combined with zero valent iron reduction for the pretreatment 2,4-dinitroanisole and discussed the change of intermediate products in each reaction stage.
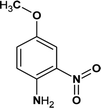
Although several studies have been conducted on the oxidation of Fenton to some of the BDIs, however, with the development of dye intermediates industry, more stable BDIs have been developed and applied. 4M2NA, as an important new benzene dye intermediate, has been widely used in the manufacture and synthesis of many organic dyes, drugs and sensitive materials in recent years.43 Compared to other BDIs, 4M2NA has electron donating group (–NH2), electron withdrawing groups (–NO2) and neutral groups (–OCH3), and its structure is more complex. In addition, 4M2NA, a highly toxic substance, has potential mutagenic and carcinogenic effects and even can cause liver poisoning and hemolytic anemia.44 It has been listed as a priority pollutant in several countries.7
However, the researches at home and abroad are mostly focused on the synthesis, manufacture, physical properties43,45 and toxicity tests44 of 4M2NA, but the studies mainly on the oxidative degradation by Fenton method have seldom been reported.
In recent years, the implementation goals of Fenton technology have shifted from the complete elimination of pollutants to the partial degradation of pollutants aiming at reducing toxicity of pollutants and improving the biodegradability of wastewater. Therefore, monitoring the reaction intermediates is also essential for understanding and predicting the biocompatibility of treated wastewater by Fenton method.46,47 Hence, it is of great significance to understand the characteristics and mechanism of the degradation of 4M2NA by Fenton method.
In this study, 4M2NA was selected as the research target. Firstly, the effect of various factors (initial pH, initial H2O2 concentration, and initial Fe2+ concentration) on Fenton oxidative degradation of 4M2NA was analyzed. Then the mechanism and possible pathway of the 4M2NA degradation were predicted using UV-Vis spectra analysis based on Gauss peak fitting, HPLC measurement combined with two-dimensional correlation spectroscopy and GC-MS analysis. Finally, based on the theoretical TOC calculation between 4M2NA and main reaction intermediates, the predominant degradation pathway was also proposed.
2. Materials and methods
2.1 Chemicals and materials
The 4M2NA (CAS: 96-96-8), with the purity of 99%, was purchased from J&K Scientific Ltd., The NaOH, anhydrous Na2SO4, FeSO4·7H2O, H2O2 (30%), methanol, phosphoric acid, KH2PO4, n-hexane, formic acid, acetic acid and oxalic acid were received from Sinopharm Chemical Reagent Co., Ltd. The physical and chemical properties of 4M2NA are shown in Table 1.2.2 Experimental setup
The 4M2NA wastewater sample (500 mL) was put in a beaker (1 L) with a magnetic stirrer. The initial solution pH was adjusted to the desired value by using 0.1 M H2SO4 or 0.1 M NaOH solution. A measured amount of catalytic FeSO4·7H2O was added, followed by the addition of H2O2 into the solution to start the reaction. At selected time intervals (1, 5, 10, 30, 60, 90, 120, 180 min), 5 mL aliquots of the reaction mixture were taken and immediately injected with 1.0 or 0.1 M NaOH (or methanol, for the identification of organic products) to terminate the reaction. The mixed solution was centrifuged for 10 min at 12![[thin space (1/6-em)]](https://www.rsc.org/images/entities/char_2009.gif) 000 rpm, and the supernatant was withdrawn for the subsequent analysis.
000 rpm, and the supernatant was withdrawn for the subsequent analysis.
All measurements were performed in triplicate, and the results displayed in tables were the average value of at least three measurements with an accuracy of ±5%.
2.3 Chemical analysis
The concentration of 4M2NA was measured by high performance liquid chromatography (HPLC, LC-20AT, SHIMADZU), equipped with a C18 analytical column (5 μm, 150 mm × 4.6 mm) at 30 °C. The mobile phase was methanol at a flow rate of 0.5 mL min−1, and the detection wavelength was set at 254 nm. The injection volume was 10 μL. TOC was measured using a TOC analyzer (TOC-VWP, SHIMADZU). The residence time was 12 min. pH was determined by glass electrode method.The oxidation products of 4M2NA were identified by GC-MS (Agilent 6890N/5975C) measurement. At selected time intervals, 15 mL reaction solution (with 5 mL methanol) was extracted with 10 mL hexane in triplicate. The organic phases were combined and dried by nitrogen gas at a gentle stream, and then dissolved in 1 mL hexane for GC-MS analysis. Organic phase was injected into the GC-MS for analysis after desiccation with anhydrous Na2SO4. The oxidation products were analyzed using the GC-MS with a HP-5MS chromatographic column (60 m × 0.25 mm × 0.25 μm). The temperature programmed was that the initial temperature of 40 °C maintained for 7 min and post run at 150 °C maintained for 4 min. The flow rate of the carrier gas (He) was 1.0 mL min−1 and the split ratio was 10![[thin space (1/6-em)]](https://www.rsc.org/images/entities/char_2009.gif) :
:![[thin space (1/6-em)]](https://www.rsc.org/images/entities/char_2009.gif) 1. The temperature of the ion source was 230 °C, respectively. The energy of the ion source was 70 eV. The full scan spectrum (m/z 25–500) was acquired and the solvent delay was set to 4 min. Chromatograms were compared between the control and experimental groups to detect possible products.
1. The temperature of the ion source was 230 °C, respectively. The energy of the ion source was 70 eV. The full scan spectrum (m/z 25–500) was acquired and the solvent delay was set to 4 min. Chromatograms were compared between the control and experimental groups to detect possible products.
Low molecular weight organic acids (LMWOAs) were measured by (HPLC, LC-20AT, SHIMADZU), equipped with an inert sustain swift-C18 analytical column (5 μm, 250 mm × 4.6 mm) at 30 °C. The mobile phase was KH2PO4 solution (with 2% methanol) methanol at a flow rate of 0.8 mL min−1, and the detection wavelength was set at 210 nm. The injection volume was 10 μL.
The UV-Vis spectras of 4M2NA samples were analyzed by using Gauss multi-peak fitting.48 The method is based on the description of each spectrum by a series of Gaussian peaks.49 The HPLC spectra of a series of 4M2NA samples were analyzed by the method of two-dimensional correlation spectroscopy analysis described by Noda and Ozaki.50 The dynamic spectra that represent the variation of spectral intensity compared with the reference spectrum can be calculated from the following:
![[x with combining tilde]](https://www.rsc.org/images/entities/i_char_0078_0303.gif) j(v) = j(v) = ![[x with combining tilde]](https://www.rsc.org/images/entities/i_char_0078_0303.gif) (v,tj) = x(v,tj) − (v,tj) = x(v,tj) − ![[x with combining macron]](https://www.rsc.org/images/entities/i_char_0078_0304.gif) (v), j = 1, 2,…, m, (v), j = 1, 2,…, m, |
The variable v is the spectral index of HPLC. ![[x with combining tilde]](https://www.rsc.org/images/entities/i_char_0078_0303.gif) (v,tj) is the dynamic spectra measured at m equally spaced points in perturbation t between t1 and tm, and the average spectrum
(v,tj) is the dynamic spectra measured at m equally spaced points in perturbation t between t1 and tm, and the average spectrum  has been subtracted from raw data x(v,tj). The synchronous correlation intensity of two spectral indices can be directly calculated from the following:
Synchronous correlation spectrum Φ(v1,v2) represents synchronous changes of two spectral intensities measured at v1 and v2. A positive Φ(v1,v2) indicates that the spectral intensities at v1 and v2 are either increasing or decreasing simultaneously. A negative value indicates that one of the spectral intensities is increasing while the other is decreasing.51 The two-dimensional correlation spectroscopy analysis was produced using 2Dshige software (Kwansei-Gakuin University, Japan).
3. Results and discussion
3.1 Degradation of 4M2NA
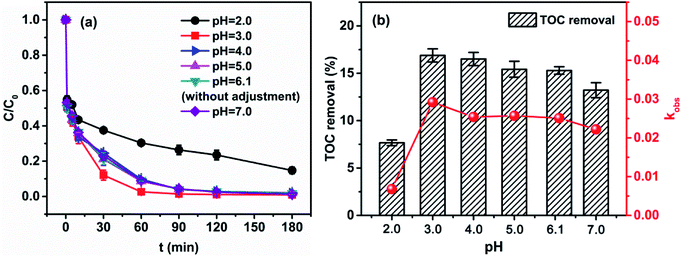
In this study, experiments were carried out to investigate the pH and operational variables that could affect the 4M2NA degradation efficiency for the preparation of suitable reaction conditions.52On the other hand, as shown in Fig. 1(b), when pH was 2.0, the TOC removal efficiency was only 7.66%, but the TOC removal efficiency (16.88%) was the highest at pH of 3.0. When pH was increased from 3.0 to 7.0, the removal efficiency of TOC was slightly decreased, but they were basically maintained at around 13.0–16.0%. In summary, the degradation of 4M2NA by Fenton oxidation can be carried out at a wide pH range.
For analysis, when the solution pH was lower (pH = 2.0), the high concentration of H+ reacted with ˙OH and reduced the amount of ˙OH production, thus affecting the overall efficiency of the reaction.53 Besides, the formation of the complex species [Fe(H2O)6]2+ slows down the oxidation reaction due to its slower reaction with H2O2 compared to that of [Fe(OH)(H2O)5]+. The formation of the stable oxonium ion [H3O2]+ in the presence of high concentrations of H+ also makes the peroxide electrophilic enhancing its stability and presumably hindering the reaction activity between H2O2 and Fe2+.54,55 On the contrary, generally under the conditions of near neutral pH, the production of ˙OH is inhibited by ferric hydroxo complexes. Moreover, Fe2+ or Fe3+ tends to generate a variety of amorphous complex precipitation,56 which significantly decreases the oxidation capability of the system. However, the degradation efficiency was generally good, when the pH was in the range of 3.0–7.0 in our current study. It was probably due to the formation of LMWOAs in the reaction process,57 so that the solution pH can be reduced rapidly to about 3.0 when the initial pH near neutral condition, and the treatment efficiency is not greatly affected.
Based on the above results, the degradation of 4M2NA by Fenton method was feasible and efficient at an initial pH of near neutral condition. Therefore, subsequent experiments were performed under unadjusted pH (6.12 ± 0.01) condition.
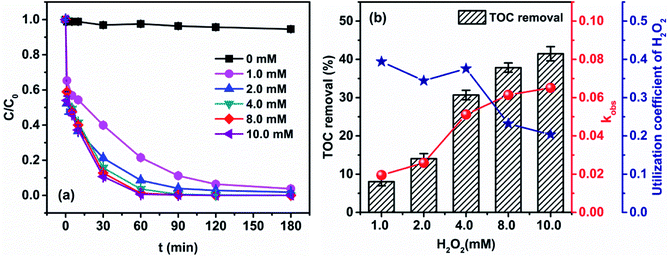 | ||
| Fig. 2 Effect of initial H2O2 concentration on (a) degradation of 4M2NA and (b) TOC removal and kobs ([4M2NA]0 = 100 mg L−1, [Fe2+]0 = 0.4 mM, and temperature = 25 °C; pH = 6.12 ± 0.01). | ||
In this study, the degradation effect of 4M2NA by Fenton method was gradually increased with an increase of initial H2O2 concentration. Besides, it could be seen from Fig. 2(a) that the degradation efficiency of 4M2NA did not decrease significantly when the concentration of H2O2 was too high. However, from Fig. 2(b), the reaction rate and overall TOC removal efficiency increased greatly with an increase the initial H2O2 concentration (from 1.0 to 4.0 mM), and the increase rate became slow when the initial concentration of H2O2 increased from 4.0 to 10.0 mM. The apparent rate constant kobs showed a similar trend. However, if according to the ratio of the TOC removal and initial H2O2 concentration to calculate effective utilization coefficient of H2O2, it could be found that with an increase of initial H2O2 concentration, the effective utilization coefficient of H2O2 was stable from 1.0 to 4.0 mM but decreased substantially from 4.0 to 10.0 mM. The maximum effective utilization coefficient of 0.3785 was observed at the initial H2O2 concentration of 4.0 mM. This is because too much H2O2 generated large amounts of oxygen, which reduce the efficiency of effective utilization of H2O2.39
Therefore, considering the above factors, the most suitable initial concentration of H2O2 was 4.0 mM, simultaneously the TOC removal efficiency and the apparent rate constant were 30.70% and 0.0512 s−1, respectively.
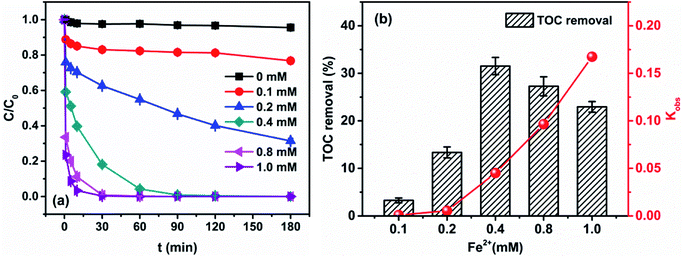 | ||
| Fig. 3 Effect of initial Fe2+ concentration on (a) degradation of 4M2NA and (b) TOC removal and kobs ([4M2NA]0 = 100 mg L−1, [H2O2]0 = 4 mM, and temperature = 25 °C; pH = 6.12 ± 0.01). | ||
The results showed that the degradation of 4M2NA by Fenton oxidation was enhanced significantly with an increase of initial concentration of Fe2+. The apparent rate constant increased exponentially from 0.0009 to 0.1674 s−1 when the initial Fe2+ concentration ranged from 0.1 to 1.0 mM. And when the initial Fe2+ concentration was larger than or equal to 0.4 mM, the removal efficiency of 4M2NA could reach 100% after 180 min. But the TOC removal efficiency initially increased then decreased. When the initial concentration of Fe2+ increased from 0.1 to 0.4 mM, the TOC removal efficiency increased from 3.26% to 31.54%, reaching the maximum value. However, when the initial concentration of Fe2+ continued to increase up to 1.0 mM, the TOC removal efficiency gradually decreased to 22.95%.
Fe2+ is the catalyst in Fenton oxidation reaction. With an increase of initial Fe2+ concentration, H2O2 could be catalyzed to produce more ˙OH, which could degrade 4M2NA effectively. However, when the initial concentration of Fe2+ increased to a certain level, the TOC removal efficiency was still minor although the removal of 4M2NA was quite significant, which was probably because 4M2NA produced more refractory intermediates. On the other hand, excessive Fe2+ react with ˙OH to cause the depletion of ˙OH (˙OH + Fe2+ → Fe3+ + OH−), thereby reducing the degradation efficiency of organic constituents in the whole system. Therefore, a suitable initial concentration of Fe2+ was 0.4 mM.
The above results revealed that when the 4M2NA degradation was quite complete, it seemed the apparent removal for total TOC did not occur, which was a sign that some organic substances highly recalcitrant to the Fenton process had been formed58 (the analysis of intermediates formed was discussed in detail below).
3.2 Oxidation products and proposed pathways
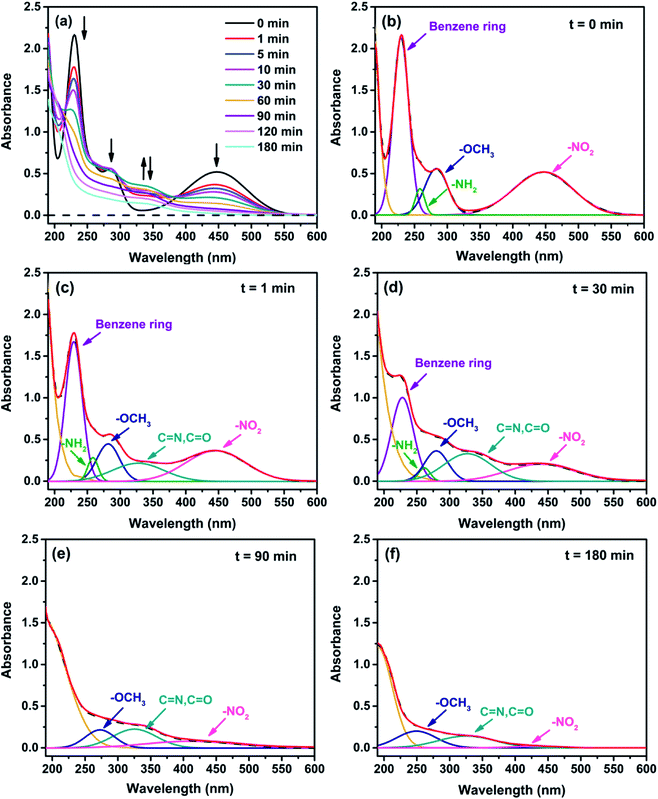
The oxidative degradation of 4M2NA using Fenton reagent by producing ˙OH was a complex chemical reaction process. The ˙OH increases or terminates the reaction chain by means of hydrogen abstraction, addition, fragmentation, etc. Because of the high activity of ˙OH, the reaction is usually fast with low activation energy, and several reaction pathways can occur simultaneously, thus producing complex chemical products. In this study, we used UV-Vis, HPLC, and GC-MS methods to characterize the variation of the products during the degradation of 4M2NA. Based on the results in 3.1 Section, the reaction conditions were set as follows: [4M2NA]0 = 100 mg L−1, [H2O2]0 = 4.0 mM, [Fe2+]0 = 0.4 mM, pH = 6.12 ± 0.01, temperature = 25 °C.Fig. 4(a) showed full wavelength UV-Vis absorption spectra of 4M2NA proceeded Fenton reaction. Wiff chromophore theory can be used to explain the relationship between the chromospheres behavior of most dyes and their intermediates and chromospheres.59 For the dye intermediate 4M2NA, the chromosphere is benzene ring, the chromophore is –NO2, and the chromophore bodies are –NH2 and –OCH3. Through the Gauss peak fitting (Fig. 4(b)), it could be seen clearly that the absorption peaks of the ultraviolet region at 230, 258 and 285 nm were characteristic peaks of benzene ring, –NH2 and –OCH3, respectively.6 The absorption peak at 450 nm corresponded to the –NO2 chromophore, produced by n → π* transition, namely, the visible chromophore.
The experimental results showed that with an increase of processing time, the peak intensities at 450, 230, 258 and 285 nm in the visible region were gradually weakened, i.e., the –NO2, benzene ring, –NH2 and –OCH3 were gradually destroyed. However, when the reaction time was 1 min, a new absorption peak appeared at 326 nm in the ultraviolet region. The absorption peak was mainly expressed as C![[double bond, length as m-dash]](https://www.rsc.org/images/entities/char_e001.gif) O or C
O or C![[double bond, length as m-dash]](https://www.rsc.org/images/entities/char_e001.gif) N bond, indicating the possibility of producing ketones or acids.6 When the reaction time increased from 0 to 30 min, the intensity of absorption peak gradually increased, then it decreased step by step when the reaction proceeded from 30 to 180 min.
N bond, indicating the possibility of producing ketones or acids.6 When the reaction time increased from 0 to 30 min, the intensity of absorption peak gradually increased, then it decreased step by step when the reaction proceeded from 30 to 180 min.
The TOC removal efficiency was approximately 30% after the reaction, indicating that there were still a great amount of intermediate products in the solution. In order to illustrate the degradation process more accurately, more analytic methods should be carried out for further understanding of the reaction mechanism.
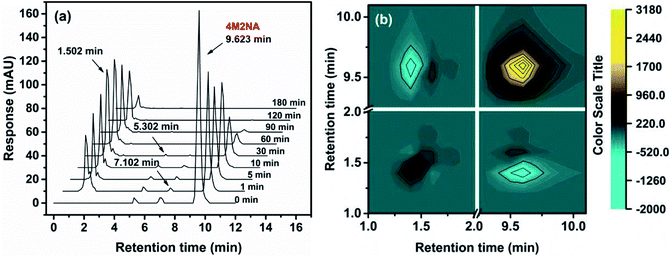 | ||
| Fig. 5 HPLC spectrum (a) and two-dimensional correlation spectroscopy (b) in the process of degradation of 4M2NA by Fenton oxidation. | ||
Fig. 5(a) showed the retention peaks of solution in the chromatographic column at different reaction times after Fenton oxidation. The X axis indicated the retention time, and the Y axis indicated response sensitivity. The peak at retention time of 9.623 min was the characteristic peak of 4M2NA, and the peak area gradually decreased with the reaction time prolonged, indicating that the 4M2NA molecule was fully degraded in a relatively short time (less than 1 h), which was consistent with the result achieved by UV-Vis spectrum measurement. Among them, the characteristic peaks at retention time of 5.302 and 7.102 min indicated the trace impurities in the original sample, namely, 5-methoxybenzofurazan (CAS: 4413-48-3) and 3-nitroanisole (CAS: 555-03-3), which were also decayed as the reaction proceeded. When the reaction was carried out at 1 min, three new characteristic peaks appeared at 1.502, 1.801 and 1.921 min, and the peak intensity at 1.502 min was higher than those at both 1.801 and 1.921 min. This was probably because 4M2NA was rapidly oxidized by ˙OH to produce phenols and the ˙OH capture hydrogen from phenol, causing it open the ring to form the short chain carboxylic acids. As the reaction continued, the area of the peak at 1.502 min initially increased and then decreased. While, the peak areas at both 1.801 and 1.921 min decreased gradually.
The two-dimensional correlation spectroscopy method was used to further analyze the spectrum data of HPLC. The synchronous maps generated from the HPLC spectra during the whole oxidation process are shown in Fig. 5(b). The sequential relationship of the main peaks was obtained through the comparison of the signs (positive or negative) from synchronous maps (upper-left corner). As mentioned above, a positive sign Φ(v1,v2) indicates that the spectral intensities at v1 and v2 are either increasing or decreasing simultaneously. A negative value indicates that one of the spectral intensities is increasing, while the other is decreasing.51 As can be seen, the comparison of the signs at upper-left corner of Fig. 5(b) was negative. Therefore, the change of 4M2NA peak area showed the opposite trend with that of the three unknown peaks, which indicated that some other products were produced during the process of the 4M2NA oxidative degradation.
Since the degradation process of BDIs by Fenton method was complex, it was difficult to infer the detailed degradation products of 4M2NA only on the basis of the retention peaks of HPLC.
According to previous studies, it was speculated that the peaks at retention time of 1.502 min were probably the short chain carboxylic acid produced by the opening of the benzene ring. Because such organic acids were linked to hydroxyl groups, carboxyl groups and other polar functional groups, and the retention time in the chromatographic column always short.59
It should be noted that this HPLC operating conditions were only suitable for relatively weaker polar organic molecules. For the main components of TOC in the later stage of the reaction, further analysis should be carried out by targeted methods such as GC-MS.
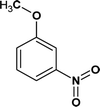
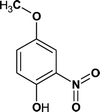
According to the total ion flow diagram of the standard dye sample at 0 min, the peak at retention time of 17.455 min indicated 4M2NA, and the remaining peaks were dominated by column loss and indicated some trace impurities such as 5-methoxy-2,1,3-benzoxadiazole (CAS: 4413-48-3) and 1-methoxy-3-nitrobenzene (CAS: 555-03-3). As the reaction proceeded, more small peaks appeared after 1 min reaction, mainly including newly generated 5-methoxy-2,1,3-benzoxadiazole (CAS: 4413-48-3), 1-methoxy-3-nitrobenzene (CAS: 555-03-3) and 4-methoxy-2-nitrophenol (CAS: 1568-70-3). At the same time, some new peaks were formed, mainly including 4-methoxy-1,2-benzenediol (CAS: 3934-97-2), 4-methoxy-1,2-benzoquinone (CAS: 69818-23-1), toluene (CAS: 108-88-3). When the reaction proceeded to 5 min, the above substances were still present and other new peaks were formed including (2E,4Z)3-methoxy-2,4-hexadienedinitrile (CAS: 1789-46-4), 3-butenamide (CAS: 432491-67-3), methacrylamide (CAS: 79-39-0), acrylamide (CAS: 79-06-1), 3-hexanone (CAS: 589-38-8), 2-methyl-3-pentanone (CAS: 565-69-5), ethyl cyanate (CAS: 627-48-5), cyanoacetic acid (CAS: 372-09-8), acetic acid (CAS: 64-19-7), acetaldehyde (CAS: 75-07-0) and hydrogen azide (CAS: 7782-79-8). After 30 min of reaction, the peaks above gradually disappeared. However, there were still several small peaks. Further identification by HPLC showed that the final products were mainly oxalic acid (CAS: 144-62-7), formic acid (CAS: 64-18-6) and other substances.
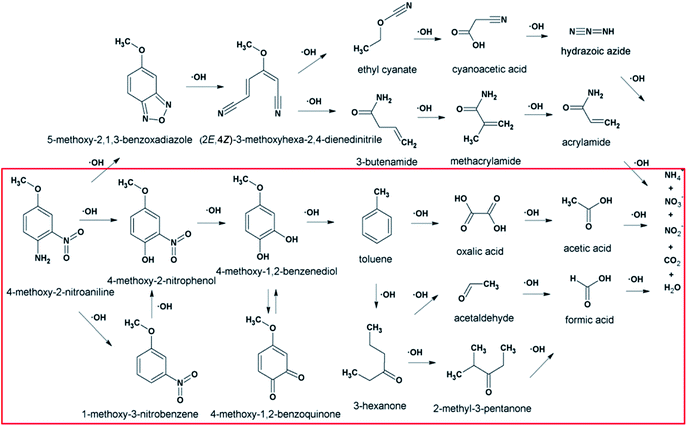
From Fig. 6, for the major pathway (red box), at the beginning of the reaction, 4M2NA was oxidized to 2-nitro-4-methoxyphenol. Because of the highest density of electron clouds near the –NH2 of the three substituents on 4M2NA, ˙OH attacked –NH2 first, and –NH2 was oxidized to form hydroxyl (–OH). At the same time, 4M2NA might also undergo deamination to produce 1-methoxy-3-nitrobenzene, which was then attacked by ˙OH and a hydroxyl substitution reaction occurred to produce 2-nitro-4-methoxyphenol. Because if there is an ortho- and para-position orienting group (–OCH3) and an inter-position orienting group (–NO2) on the benzene ring, the position of the third substituent is determined mainly by the ortho- and para-position orienting group, namely –OCH3. Therefore, the generation of 2-nitro-4-methoxyphenol from 1-methoxy-3-nitrobenzene was possible and reasonable. The presence of –OH in benzene ring enhanced its activity. As the reaction continued, the –NO2 on the benzene ring was attacked by ˙OH, and then the substitution reaction took place to form polyphenols60 such as 4-methoxy-1,2-benzenediol, which might react with Fe3+ to produce Fe2+ and 4-methoxy-1,2-benzoquinone.61 However, 4-methoxy-1,2-benzoquinone was unstable. When it was further attacked by ˙OH, the benzene ring was oxidized to fracture to form oxalic acid, acetaldehyde and other substances,62 which continued to be oxidized to form acetic acid, formic acid, etc., and eventually were mineralized to carbon dioxide, water and so on.
On the other hand, there may be another way. 5-Methoxy-2,1,3-benzoxadiazole and 1-methoxy-3-nitrobenzene were detected at the early stage of reaction. Although these impurities contained in the original 4M2NA sample, the peak area varied with the reaction. So it was possible to combine –NO2 with –NH2 on the 4M2NA molecule to produce 5-methoxy-2,1,3-benzoxadiazole in the early intense oxidizing atmosphere. Moreover, 4M2NA is usually used as an raw material for the manufacture of 5-methoxy-2,1,3-benzoxadiazole. Therefore, the result was reasonable. As the reaction continued, (2E,4Z)3-methoxy-2,4-hexadienedinitrile, ethyl cyanate and hydrogen azide were identified mainly due to the attack by ˙OH on the C![[double bond, length as m-dash]](https://www.rsc.org/images/entities/char_e001.gif) N bond and the benzene ring, resulting in that the ring of 5-methoxy-2,1,3-benzoxadiazole was broken. Meanwhile, the detected cyanoacetic acid, ethyl cyanate, hydrogen azide, 3-butenamide, methacrylamide, acrylamide might be the products of (2E,4Z)3-methoxy-2,4-hexadienedinitrile after ˙OH attack. They might eventually continue to be fully mineralized.
N bond and the benzene ring, resulting in that the ring of 5-methoxy-2,1,3-benzoxadiazole was broken. Meanwhile, the detected cyanoacetic acid, ethyl cyanate, hydrogen azide, 3-butenamide, methacrylamide, acrylamide might be the products of (2E,4Z)3-methoxy-2,4-hexadienedinitrile after ˙OH attack. They might eventually continue to be fully mineralized.
In summary, since the Fenton reaction is rapid and complex, the above reactions may occur simultaneously. Subsequent oxidation of these intermediate by-products yielded the formation of short-chain carboxylic acids like oxalic acid, acetic acid and formic acid, which were finally mineralized into CO2 and H2O as well as the formation of other inorganic ions like NH4+, NO3− and NO2−.
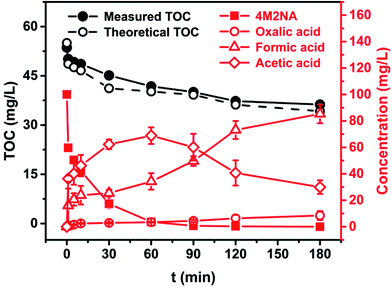
In general, LMWOAs are the end products of the degradation process of Fenton systems, such as acetic acid, which was difficult to be attacked by ˙OH. Hence, LMWOAs are likely to be the major components of the remaining TOC in the system.59,63 The LMWOAs identified in this study mainly included oxalic acid, acetic acid and formic acid, and the variation of their concentrations with time were detected by HPLC method. Besides, to further confirm the major degradation pathway, the measured TOC at various time intervals during the degradation process of 4M2NA was compared with the theoretical TOC calculated by the actual concentration of 4M2NA, oxalic acid, acetic acid and formic acid, as shown in Fig. 7.
The concentration of acetic acid increased rapidly with reaction time from 1 to 60 min, and reached a peak value of 68.88 mg L−1 at 60 min. Then, as the reaction continued, the concentration of acetic acid decreased gradually. After 120 min, the decrease rate slowed down, and the concentration dropped to 29.95 mg L−1 at 180 min. The concentration of oxalic acid increased gradually with the reaction proceeding and remained at about 8.42 mg L−1 at the later stage of the reaction. Oxalic acid and iron ions could form quite stable organic complexes, which were not susceptible to degradation attacked by free radical.59 The concentration of formic acid showed a gradually increasing trend, and the final concentration was about 85.37 mg L−1 at 180 min. On the other hand, it was clear that the theoretical TOC was nearly 94.41–97.11% of the measured TOC, which indicated that the oxalic acid, acetic acid and formic acid were the main end products and the pathway marked by red box was the major degradation way. These results provide significant information to deep understand the degradation mechanism of 4M2NA.
Besides, NH4+, NO3− and trace amounts of NO2− were detected at concentrations of 44.78, 12.71 and 0.36 mg L−1 respectively at the end of the reaction, which indicated that the removal of –NO2 and –NH2 by ˙OH during Fenton oxidation process was partly mediated by ionization.
4. Conclusions
The present study showed Fenton oxidation was highly effective to decompose 4M2NA at a near neutral aqueous solution. The results were summarized as follows.(1). The effect of initial pH, Fe2+ and H2O2 concentrations on 4M2NA degradation efficiency was investigated. The initial concentrations of both H2O2 and Fe2+ affected the oxidation efficiency of 4M2NA, in which the Fe2+ had a more significant impact.
(2). The removal efficiency of 4M2NA (100 mg L−1) could reach 100% after 180 min at the condition of that the initial pH was 6.12 ± 0.01 and the initial H2O2 and Fe2+ concentrations were 4.0 and 0.4 mM respectively. But the TOC removal efficiency was less than 32%, which suggested that many by-products recalcitrant to the Fenton oxidation were still present in the system.
(3). A total of nineteen reaction intermediates were identified by UV-Vis spectra analysis based on Gauss peak fitting, HPLC analysis combined with two-dimensional correlation spectroscopy and GC-MS detection, and two possible degradation ways were illustrated. Theoretical TOC calculated based on the concentration of oxalic acid, acetic acid, formic acid, and 4M2NA during the degradation process was nearly 94.41–97.11% of the measured TOC, which indicated that the oxalic acid, acetic acid and formic acid were the main products.
(4). The predominant mechanism and pathway of oxidative degradation of 4M2NA by Fenton method was preliminarily determined. With the attack of ˙OH, 4M2NA was rapidly oxidized to 4-methoxy-2-nitrophenol, 4-methoxy-1,2-benzenediol and toluene successively. Then a large amount of oxalic acid, acetic acid and formic acid were produced after the benzene ring was opened. Eventually some of them could be mineralized to CO2, H2O, NH4+, NO3− and trace amounts of NO2−.
These results may provide a significant insight to deep understand the degradation mechanism of 4M2NA during the Fenton oxidation process, which could provide theoretical basis and support for better treatment of 4M2NA contaminated surface and groundwater.
Conflicts of interest
There are no conflicts to declare.Acknowledgements
This study was financially supported by the Fundamental Research Fund for the Central Universities (No. 2652017166), the fund of water quality control principles for safe storage of reclaimed groundwater (Project No. 51238001), the National Natural Science Foundation of China (Grant 41672239) and (Grant 41572229), the Research Fund of China Geological Survey (1212011121166 and DD20160300), and the National Water Pollution Control and Treatment Science and Technology Major Project (2015ZX07406005-001).References
- L. Gu, N. Zhu, L. Wang, X. Bing and X. Chen, J. Hazard. Mater., 2011, 198, 232–240 CrossRef CAS PubMed.
- W. P. Ting, M. C. Lu and Y. H. Huang, J. Hazard. Mater., 2008, 156, 421–427 CrossRef CAS PubMed.
- G. Chen, K. Y. Cheng, M. P. Ginige and A. H. Kaksonen, Water Res., 2012, 46, 145–151 CrossRef CAS PubMed.
- A. El-Ghenymy, S. Garcia-Segura, R. M. Rodríguez, E. Brillas, M. S. El Begrani and B. A. Abdelouahid, J. Hazard. Mater., 2012, 221–222, 288–297 CrossRef CAS PubMed.
- N. Wang, Z. Tong, J. Jiang and W. Peng, Chem. Eng. J., 2015, 260, 386–392 CrossRef CAS.
- Y. Y. Lau, Y. S. Wong, S. A. Ong, L. N. Ho, K. Hussin and N. A. Lutpi, J. Taiwan Inst. Chem. Eng., 2017, 76, 27–34 CrossRef CAS.
- M. M. Rosli, P. S. Patil, H. K. Fun, I. A. Razak and S. M. Dharmaprakash, Acta Crystallogr., 2007, 63, 1039–1040 Search PubMed.
- N. Riaz, F. K. Chong, B. K. Dutta, Z. B. Man, M. S. Khan and E. Nurlaela, Chem. Eng. J., 2012, 185–186, 108–119 CrossRef CAS.
- A. L. Yang, G. H. Huang, X. S. Qin and Y. R. Fan, J. Hazard. Mater., 2012, 213–214, 421–433 CrossRef CAS PubMed.
- Y. Guo, Q. Xue, H. Zhang, N. Wang, S. Chang, H. Wang, H. Pang and H. Chen, RSC Adv., 2017, 8, 80–90 RSC.
- L. Bai, Q. Qiao, Y. Yao, J. Guo and M. Xie, J. Cleaner Prod., 2014, 70, 4–14 CrossRef.
- M. Dou, Q. Mi, C. Li and Y. Wang, Environ. Earth Sci., 2015, 74, 3681–3683 CrossRef CAS.
- P. Li, J. Wu, H. Qian, Y. Zhang, N. Yang, L. Jing and P. Yu, Exposure Health, 2016, 8, 331–348 CrossRef CAS.
- Y. S. C. Sarita, D. K. Tyagi and O. P. Yadav, Asian J. Res. Chem., 2012, 5, 1–7 Search PubMed.
- S. Datta, P. K. Bhattacharya and N. Verma, J. Membr. Sci., 2003, 226, 185–201 CrossRef CAS.
- W. Chai, X. Zhu, W. Liu, W. Zhang, Z. Zhou and Z. Ren, RSC Adv., 2016, 6, 6125–6132 RSC.
- Y. Sun, D. Yin, J. Luo, Y. Xu and A. Li, Environ. Eng. Sci., 2016, 34, 528–535 CrossRef.
- J. Y. Shen, H. Rui, H. X. Yu, L. J. Wang, J. F. Zhang, X. Y. Sun, J. S. Li, W. Q. Han and X. Lu, Bioresour. Technol., 2009, 100, 1922–1930 CrossRef CAS PubMed.
- H. Feng, Y. Wang, X. Zhang, D. Shen, N. Li, W. Chen, B. Huang, Y. Liang and Y. Zhou, Chem. Eng. J., 2016, 314, 232–239 CrossRef.
- L. Gu, J. Y. Nie, N. W. Zhu, L. Wang, H. P. Yuan and Z. Shou, Chem. Eng. J., 2012, 189–190, 108–116 CrossRef CAS.
- J. Shen, C. Ou, Z. Zhou, J. Chen, K. Fang, X. Sun, J. Li, L. Zhou and L. Wang, J. Hazard. Mater., 2013, 260, 993–1000 CrossRef CAS PubMed.
- C. C. Hsueh, C. T. Chen, A. W. Hsu, C. C. Wu and B. Y. Chen, J. Taiwan Inst. Chem. Eng., 2017, 79, 141–150 CrossRef.
- Y. Ju, Y. Yu, X. Wang, M. Xiang, L. Li, D. Deng and D. D. Dionysiou, J. Hazard. Mater., 2016, 323, 611–620 CrossRef PubMed.
- R. P. Cavalcante, R. S. L. Da, D. Bogo, A. M. Barbosa, M. E. Osugi, M. Blanco, S. C. de Oliveira, F. C. M. M. De, Amilcar Machulek Jr and V. S. Ferreira, Environ. Sci. Pollut. Res., 2013, 20, 2352–2361 CrossRef CAS PubMed.
- J. J. Pignatello, E. Oliveros and A. MacKay, Crit. Rev. Environ. Sci. Technol., 2006, 36, 1–84 CrossRef CAS.
- Y. Liu, X. He, Y. Fu and D. D. Dionysiou, Chem. Eng. J., 2016, 284, 1317–1327 CrossRef CAS.
- J. A. Khan, X. He, N. S. Shah, M. Sayed, H. M. Khan and D. D. Dionysiou, Chem. Eng. J., 2017, 325, 485–494 CrossRef CAS.
- K. Jaworek, M. Czaplicka and Ł. Bratek, Environ. Sci. Pollut. Res. Int., 2014, 21, 11917–11923 CrossRef CAS PubMed.
- V. N. Lima, C. S. D. Rodrigues and L. M. Madeira, Environ. Sci. Pollut. Res., 2017, 1–12 Search PubMed.
- A. El-Ghenymy, C. Arias, P. L. Cabot, F. Centellas, J. A. Garrido, R. M. Rodríguez and E. Brillas, Chemosphere, 2012, 87, 1126–1133 CrossRef CAS PubMed.
- N. Riaz, F. K. Chong, Z. B. Man, R. Sarwar, U. Farooq, A. Khan and M. S. Khan, RSC Adv., 2016, 6, 55650–55665 RSC.
- N. Riaz, F. K. Chong, Z. B. Man, M. S. Khan and B. K. Dutta, Ind. Eng. Chem. Res., 2013, 52, 4491–4503 CrossRef CAS.
- M. R. D. Khaki, M. S. Shafeeyan, A. A. A. Raman and M. A. W. D. Wan, J. Environ. Manage., 2017, 198, 78–94 CrossRef CAS PubMed.
- X. R. Xu, H. B. Li, W. H. Wang and J. D. Gu, Chemosphere, 2004, 57, 595–600 CrossRef CAS PubMed.
- E. Neyens and J. Baeyens, J. Hazard. Mater., 2003, 98, 33–50 CrossRef CAS PubMed.
- M. M. Ballesteros Martín, J. A. Sánchez Pérez, J. L. Casas López, I. Oller and R. S. Malato, Water Res., 2009, 43, 653–660 CrossRef PubMed.
- J. A. Zimbron and K. F. Reardon, Water Res., 2005, 39, 865–869 CrossRef CAS PubMed.
- C. K. Duesterberg and T. D. Waite, Environ. Sci. Technol., 2006, 40, 4189–4195 CrossRef CAS PubMed.
- N. Masomboon, C. Ratanatamskul and M. C. Lu, Environ. Sci. Technol., 2009, 43, 8629–8634 CrossRef CAS PubMed.
- N. Masomboon, C. Ratanatamskul and M. C. Lu, J. Hazard. Mater., 2010, 176, 92–98 CrossRef CAS PubMed.
- N. Masomboon, C. Ratanatamskul and M. C. Lu, Appl. Catal., A, 2010, 384, 128–135 CrossRef CAS.
- J. Shen, C. Ou, Z. Zhou, J. Chen, K. Fang, X. Sun, J. Li, L. Zhou and L. Wang, J. Hazard. Mater., 2013, 260, 993–1000 CrossRef CAS PubMed.
- C. Ravikumar and J. I. Hubert, Phys. Chem. Chem. Phys., 2010, 12, 9452–9460 RSC.
- Y. Tsubokura, S. Aso, T. Koga, J. Kikuchi, T. Kobayashi, S. Hoshuyama, Y. Oshima, K. Miyata, Y. Kusune and T. Muroi, Drug Chem. Toxicol., 2015, 38, 361–374 CrossRef CAS PubMed.
- B. Gu, W. Ji, X. Q. Huang, P. S. Patil and S. M. Dharmaprakash, J. Appl. Phys., 2009, 106, 33511–33514 CrossRef.
- T. X. H. Le, T. V. Nguyen, Z. A. Yacouba, L. Zoungrana, F. Avril, D. L. Nguyen, E. Petit, J. Mendret, V. Bonniol and M. Bechelany, Chemosphere, 2017, 172, 1–9 CrossRef CAS PubMed.
- S. Khan, X. He, J. A. Khan, H. M. Khan, D. L. Boccelli and D. D. Dionysiou, Chem. Eng. J., 2017, 318, 135–142 CrossRef CAS.
- H. Küpper, M. Spiller and F. C. Küpper, Anal. Biochem., 2000, 286, 247–256 CrossRef PubMed.
- J. A. Yoon, Y. H. Kim, N. H. Kim, C. B. Moon, G. He and W. Y. Kim, J. Lumin., 2014, 153, 104–108 CrossRef CAS.
- I. Noda and Y. Ozaki, Practical Computation of Two-Dimensional Correlation Spectra, John Wiley & Sons, Ltd, ch. 3, 2005, pp. 39–46 Search PubMed.
- J. Zhang, L. Chen, H. Yin, S. Jin, F. Liu and H. Chen, Environ. Pollut., 2017, 225, 86–92 CrossRef CAS PubMed.
- J. A. Zimbron and K. F. Reardon, Water Res., 2009, 43, 1831–1840 CrossRef CAS PubMed.
- J. Yongsik, L. Wootaik, P. Jooyang and K. Younghun, Environ. Technol., 2009, 30, 183–190 CrossRef PubMed.
- Y. Wu, S. Zhou, X. Ye, R. Zhao and D. Chen, Colloids Surf., A, 2011, 379, 151–156 CrossRef CAS.
- W. K. Yun and K. Y. Hwang, Water Res., 2000, 34, 2786–2790 CrossRef.
- A. D. Bokare and W. Choi, J. Hazard. Mater., 2014, 275, 121–135 CrossRef CAS PubMed.
- C. C. Su, L. M. Bellotindos, A. T. Chang and M. C. Lu, J. Taiwan Inst. Chem. Eng., 2013, 44, 310–316 CrossRef CAS.
- N. Klamerth, W. Gernjak, S. Malato, A. Agüera and B. Lendl, Water Res., 2009, 43, 441–449 CrossRef CAS PubMed.
- N. Zhu, L. Gu, H. Yuan, Z. Lou, L. Wang and X. Zhang, Water Res., 2012, 46, 3859–3867 CrossRef CAS PubMed.
- L. Fu, Z. Zhao, J. Ma and X. Hu, Catal. Commun., 2015, 65, 96–101 CrossRef CAS.
- P. R. Salgado, V. Melin, Y. Duran, H. D. Mansilla and D. Contreras, Environ. Sci. Technol., 2017, 51, 3687–3693 CrossRef CAS PubMed.
- Y. Liu, G. Zhang, S. Fang, S. Chong and J. Zhu, J. Environ. Manage., 2016, 182, 367–373 CrossRef CAS PubMed.
- G. Liu, H. Huang, R. Xie, Q. Feng, R. Fang, Y. Shu, Y. Zhan, X. Ye and C. Zhong, RSC Adv., 2016, 7, 71–76 RSC.
| This journal is © The Royal Society of Chemistry 2018 |


